
Visual analytics for cosmological simulation results
Source: arXiv:2607.29426 · Published 2026-07-31 · By Paul Vauterin, Maarten Baes
TL;DR
Modern cosmological simulations produce extremely large and complex datasets, creating challenges in interpretation, diagnostics, and knowledge discovery. While powerful visualization tools exist, they often present high barriers to entry and lack integrated real-time visual analytics capabilities tailored to cosmology. This paper introduces ARGOS, an open-source, browser-based visual analytics platform specifically designed for cosmological simulation outputs. ARGOS emphasizes user experience, interactivity, and performance via GPU-accelerated rendering enabling responsive exploration of datasets up to about 1-2 GB in size, typical of downsampled simulation snapshots.
ARGOS supports linked multiple coordinated views, interactive filtering, 3D spatial and velocity visualization, and a flexible, template-driven dashboard architecture that enables rapid adaptation to various data types (e.g., particle data, multi-band synthetic galaxy images). Its client-only architecture relies on WebGL and IndexedDB for efficient browser-native operation without server-side computation, facilitating easy deployment and frictionless data dissemination. Demonstrations include exploration of IllustrisTNG and EAGLE particle datasets and detailed drill-down workflows for SKIRT synthetic image atlases. Overall, ARGOS enables more intuitive, hypothesis-driven exploration of complex cosmological simulation data, aiding quality control, discovery, and interpretation.
Key findings
- ARGOS manages real-time interactive visualization of cosmological particle simulation data sets up to ~14 million data points (e.g., the IllustrisTNG subhalo catalogue) with update latencies below 500 ms.
- Interactive linked views and multi-dimensional filtering enable users to identify substructures, correlations, and anomalies that static analysis misses, demonstrated through coordinated spatial, scatter, histogram, and categorical plots.
- User-driven spatial volume selection in 3D is implemented by combining multiple 2D lasso selections from different viewing angles, enabling intuitive selection of spatial subsets (Fig. 3).
- ARGOS supports mathematical transformations and metadata augmentation on imported HDF5 datasets during import, improving interpretability by converting from computational units to astrophysical units.
- The SKIRT synthetic multi-band imaging atlas use case showcases ARGOS’s ability to seamlessly drill down from catalogue-level exploration of 1154 galaxies to pixel-level interactive analysis within individual galaxy dashboards.
- User scripting embedded at the concept level enables custom automation workflows, e.g., dynamically fetching detailed per-object data on demand while maintaining a generic code base.
- ARGOS’s client-only architecture using WebGL and IndexedDB allows fully offline, platform-independent deployment, including remote static HTTP hosting without backend computation.
- Visual analytics with ARGOS discovered subtle dust morphology artefacts in SKIRT radiative transfer processing, demonstrating practical benefits for workflow validation and scientific quality control.
Methodology — deep read
Threat model & assumptions: This is a visualization and data exploration tool rather than a security-focused system; no adversary model is defined.
Data: ARGOS primarily ingests cosmological simulation data provided as HDF5 snapshot files or tab-delimited text. Example datasets used include IllustrisTNG particle cutouts (TNG282784, TNG479290), the EAGLE full snapshot 028, the TNG300 subhalo catalogue (14 million points), and the SKIRT synthetic image atlas (1154 galaxies). Data is typically downsampled to meet browser memory constraints (~1–2 GB).
Architecture and algorithm: ARGOS is a client-side web application implemented in TypeScript and React. It relies heavily on WebGL for GPU-accelerated rendering of millions of points with shaders customized for domain-specific color coding (e.g., line-of-sight velocity). The core data model is concept-driven, where concept YAML files describe dataset schema, transformations, visualizations, and automation scripts. Data tables consist of entities (rows) and properties (columns). The architecture supports multiple coordinated views (scatter plots, histograms, 3D kinematics plots, parallel coordinates, etc.) linked by interactive filtering and brushing. Interactive spatial volume selection is implemented by combining multiple 2D lasso selections from different viewing directions, enabling definition of 3D volumes.
Training regime: Not applicable as this is a visualization system. Performance tuning is done through low-level TypedArray data structures and efficient WebGL rendering.
Evaluation protocol: Qualitative demonstration through selected use cases showing exploration of three large cosmological datasets and synthetic image catalogues. Responsiveness measured by update latency below 500 ms during linked filtering of millions of points. Effectiveness discussed by illustrative discovery of subtle data artefacts in synthetic imaging. No quantitative user study or benchmarking against alternative tools is reported.
Reproducibility: ARGOS is open source with code and examples available under MIT license at https://github.com/pvaut/skirt-argos. A public reference deployment with sample datasets is accessible at https://skirt-argos.ugent.be. Data provenance is clearly stated with links to well-known cosmological simulation suites (IllustrisTNG, EAGLE, SKIRT). The paper includes screenshots and detailed architectural descriptions to facilitate reimplementation or extension.
Concrete example: A user uploads downsampled particle data from an IllustrisTNG HDF5 snapshot into the browser client. The data is stored in IndexedDB for fast local access. The user opens a configured dashboard with linked spatial, velocity-space, histogram, and scatter plots. They create filters by brushing metallicity ranges and lasso-select spatial subvolumes (using multiple directional lasso tools) to isolate specific galaxy components. The various views update in <500 ms to show filtered subsets, enabling rapid identification of correlations and substructures. The user then clicks on individual particles to inspect detailed properties in a sidebar. For the synthetic imaging data, the user visually selects galaxies from the catalogue plots, triggers a scripted fetch of multi-band pixel maps, and explores spatial and property correlations interactively—all within the web client without requiring server-side computation.
Technical innovations
- Client-only WebGL-accelerated browser-based visual analytics environment optimized for cosmological simulation data up to ~1–2 GB in size, enabling sub-second interactivity with millions of particles.
- Multi-view coordinated dashboards supporting linked filtering, brushing, and details-on-demand, enabling real-time exploration of multimodal, high-dimensional astrophysical datasets.
- Intuitive 3D spatial volume selection by iterative combination of multiple 2D lasso selections from different viewpoints to define finite 3D subvolumes.
- Concept-driven data architecture allowing user-configurable data ingestion, transformation, visualization templates, and scripting with reusable YAML definitions.
- Embedded lightweight scripting engine enabling client-side automation and dynamic data fetching workflows while preserving generic core codebase.
Datasets
- IllustrisTNG particle cutouts (TNG282784, TNG479290) — millions of particles — public simulation data
- EAGLE simulation snapshot 028 (RefL0012N0188) — full simulation box — public simulation data
- TNG300 Subhalo Catalogue (z=0) — ~14 million subhalos — public simulation data
- TNG50-SKIRT Atlas (TSA) — 1154 synthetic multi-band galaxy images — derived from TNG50 with SKIRT radiative transfer
Baselines vs proposed
- ARGOS achieves update latencies below 500 ms when filtering and interacting with datasets containing up to 14 million data points (TNG300 subhalo catalogue), demonstrating scaling and responsiveness.
- Compared to traditional HPC or desktop visualizers (e.g., yt, TOPCAT), ARGOS provides a browser-native platform with real-time linked views and user-friendly dashboards but does not aim to replace heavier 3D volume rendering tools.
- No quantitative benchmarking against other cosmology visualization tools is presented; emphasis is on complementary capabilities, ease-of-use, and rapid, frictionless analysis workflows.
Figures from the paper
Figures are reproduced from the source paper for academic discussion. Original copyright: the paper authors. See arXiv:2607.29426.
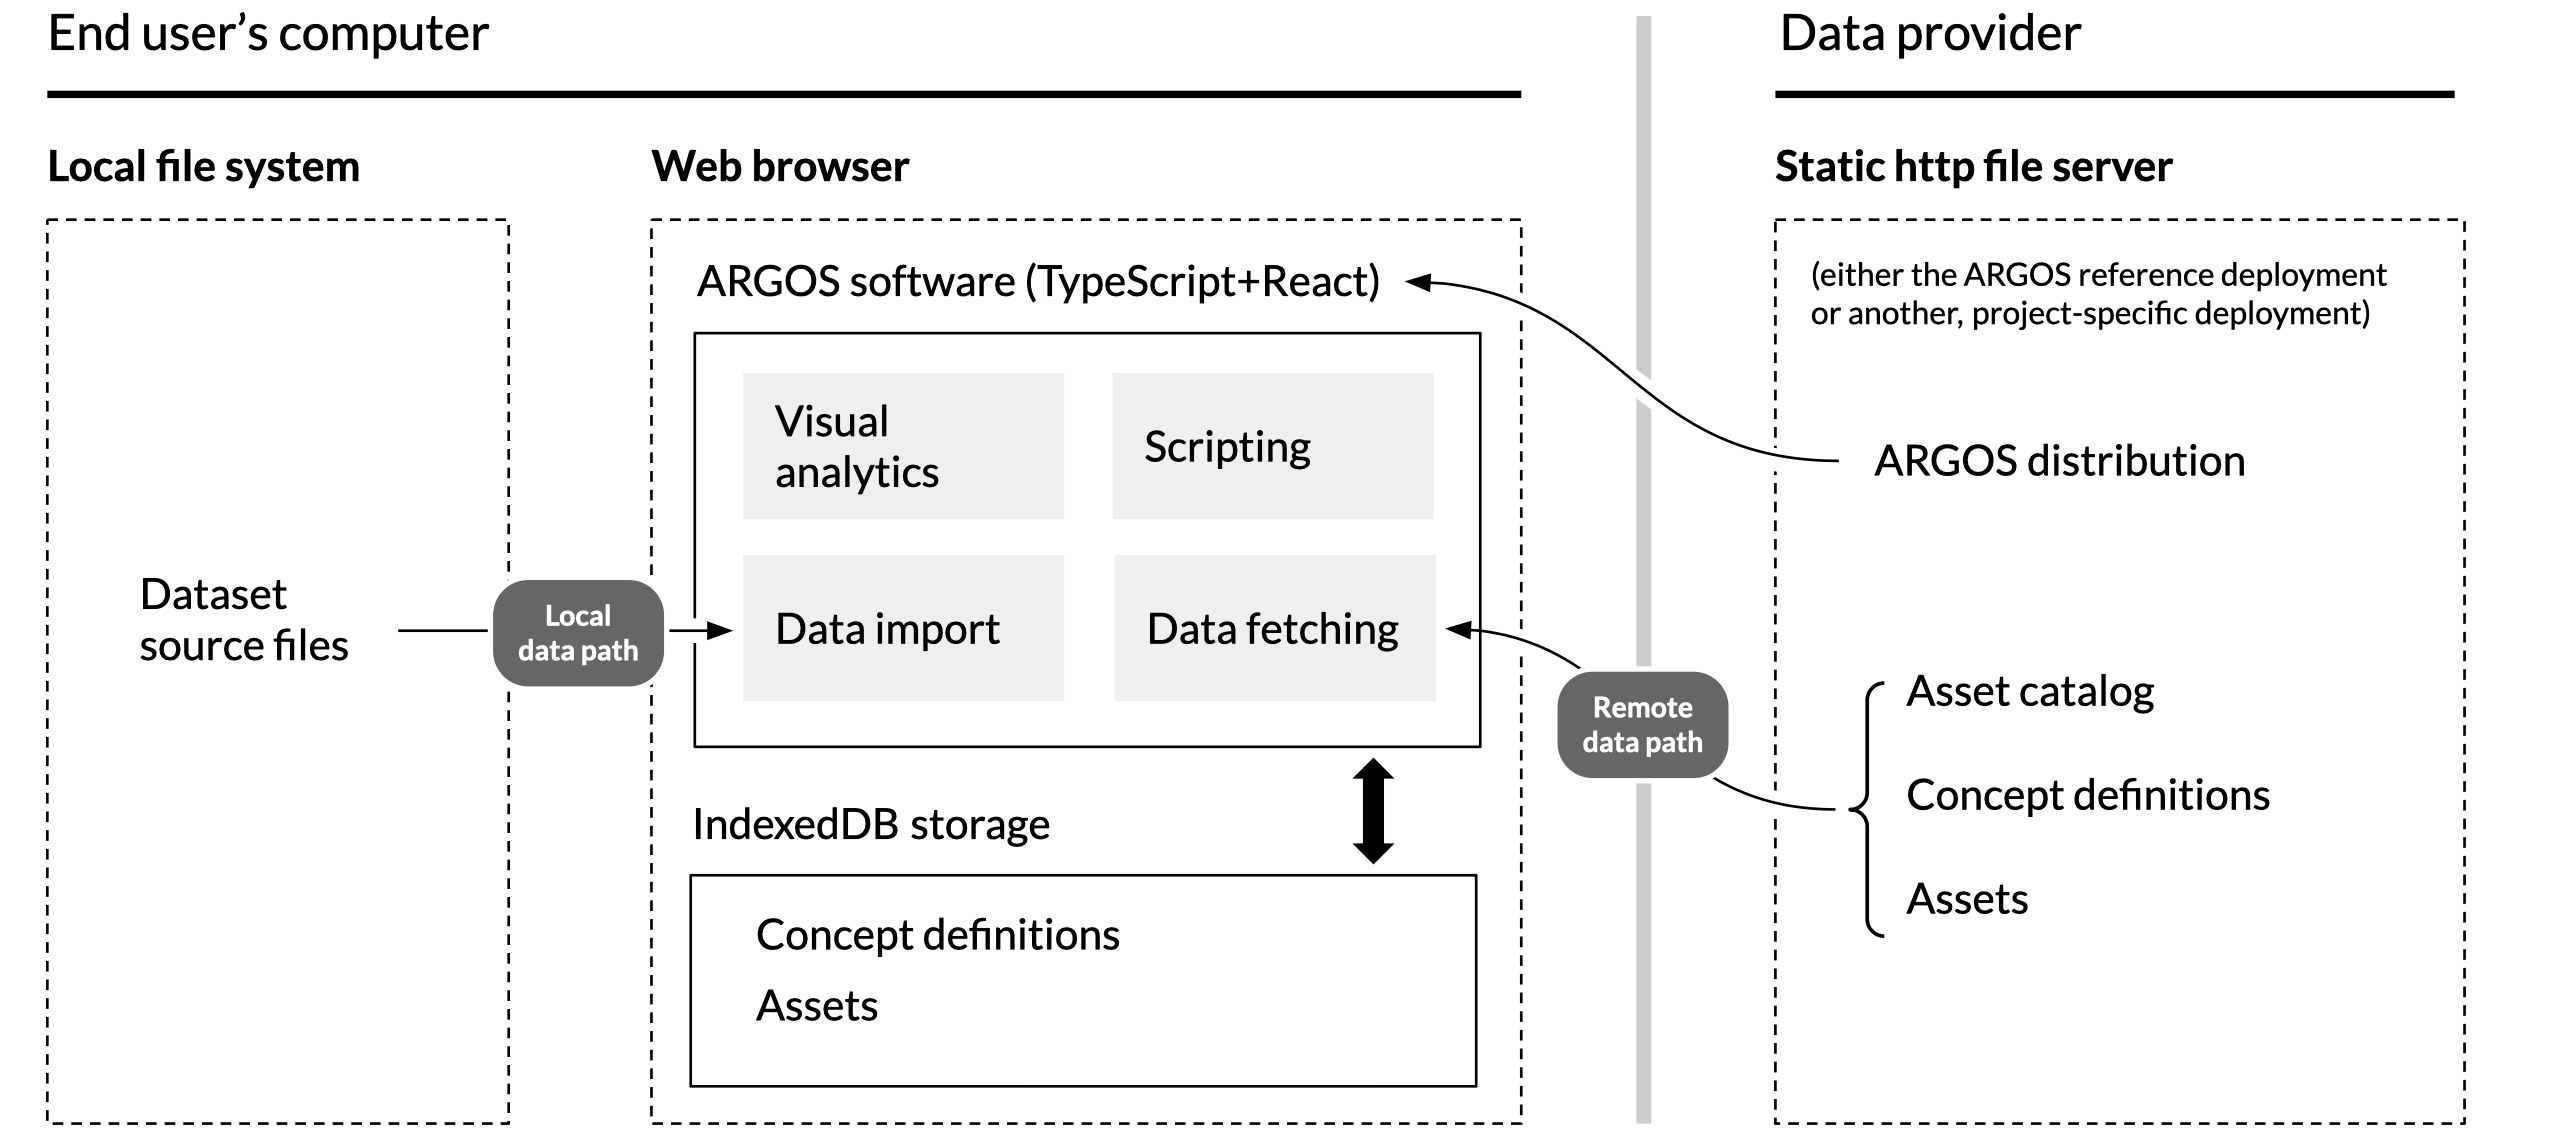
Fig 1: Schematic overview of the ARGOS software architecture and data flow. See Section 2.2 for details.
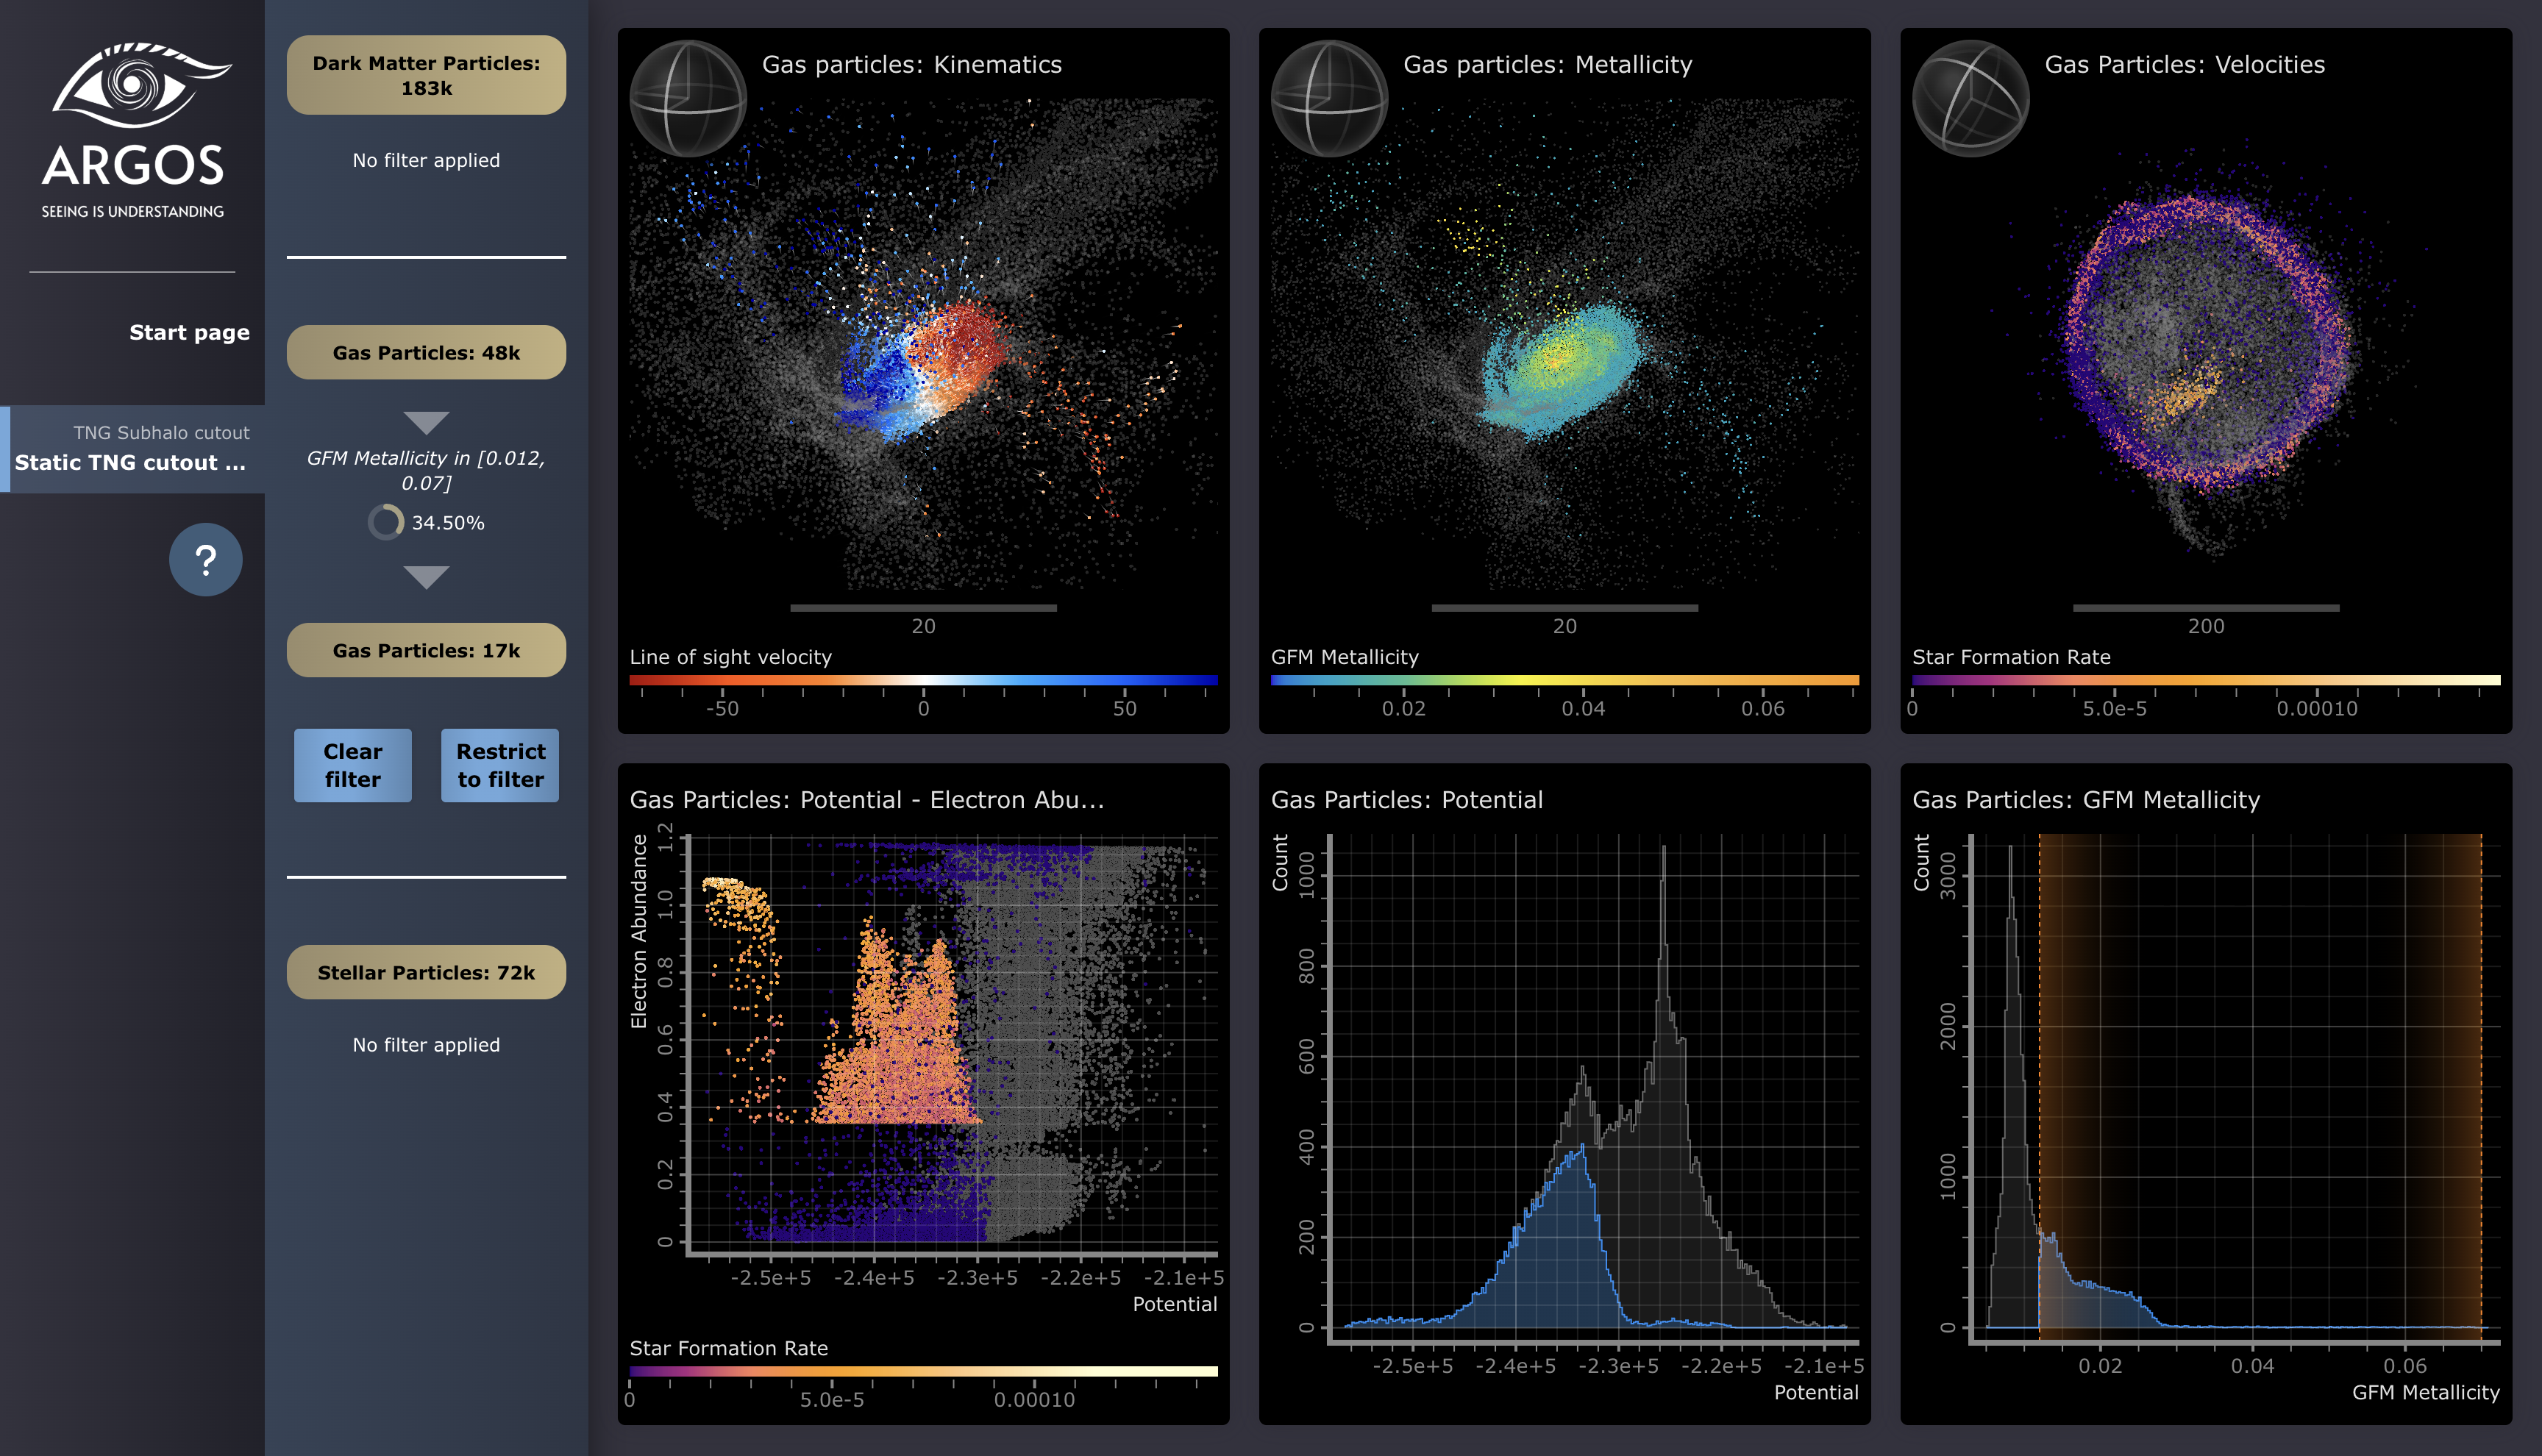
Fig 2: Example of an ARGOS dashboard showing gas particles from a TNG50 simulation cutout. Top row, left to right:
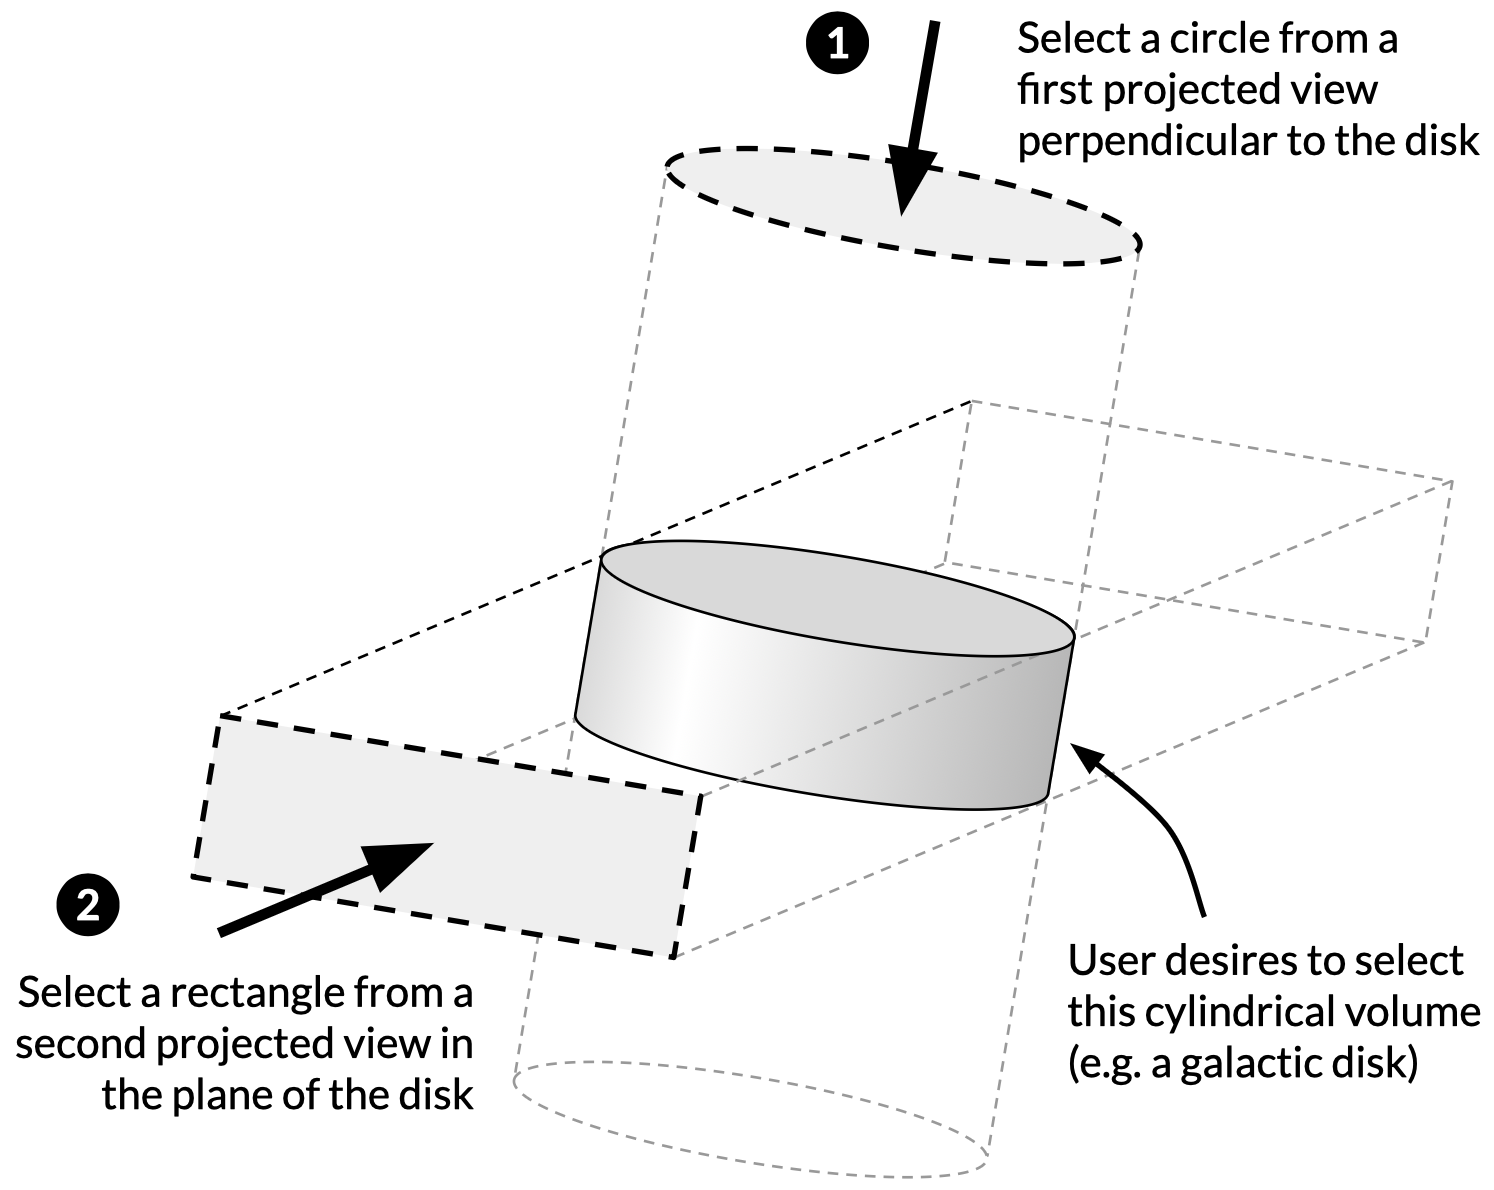
Fig 3: Selecting a specific spatial volume using two succes-
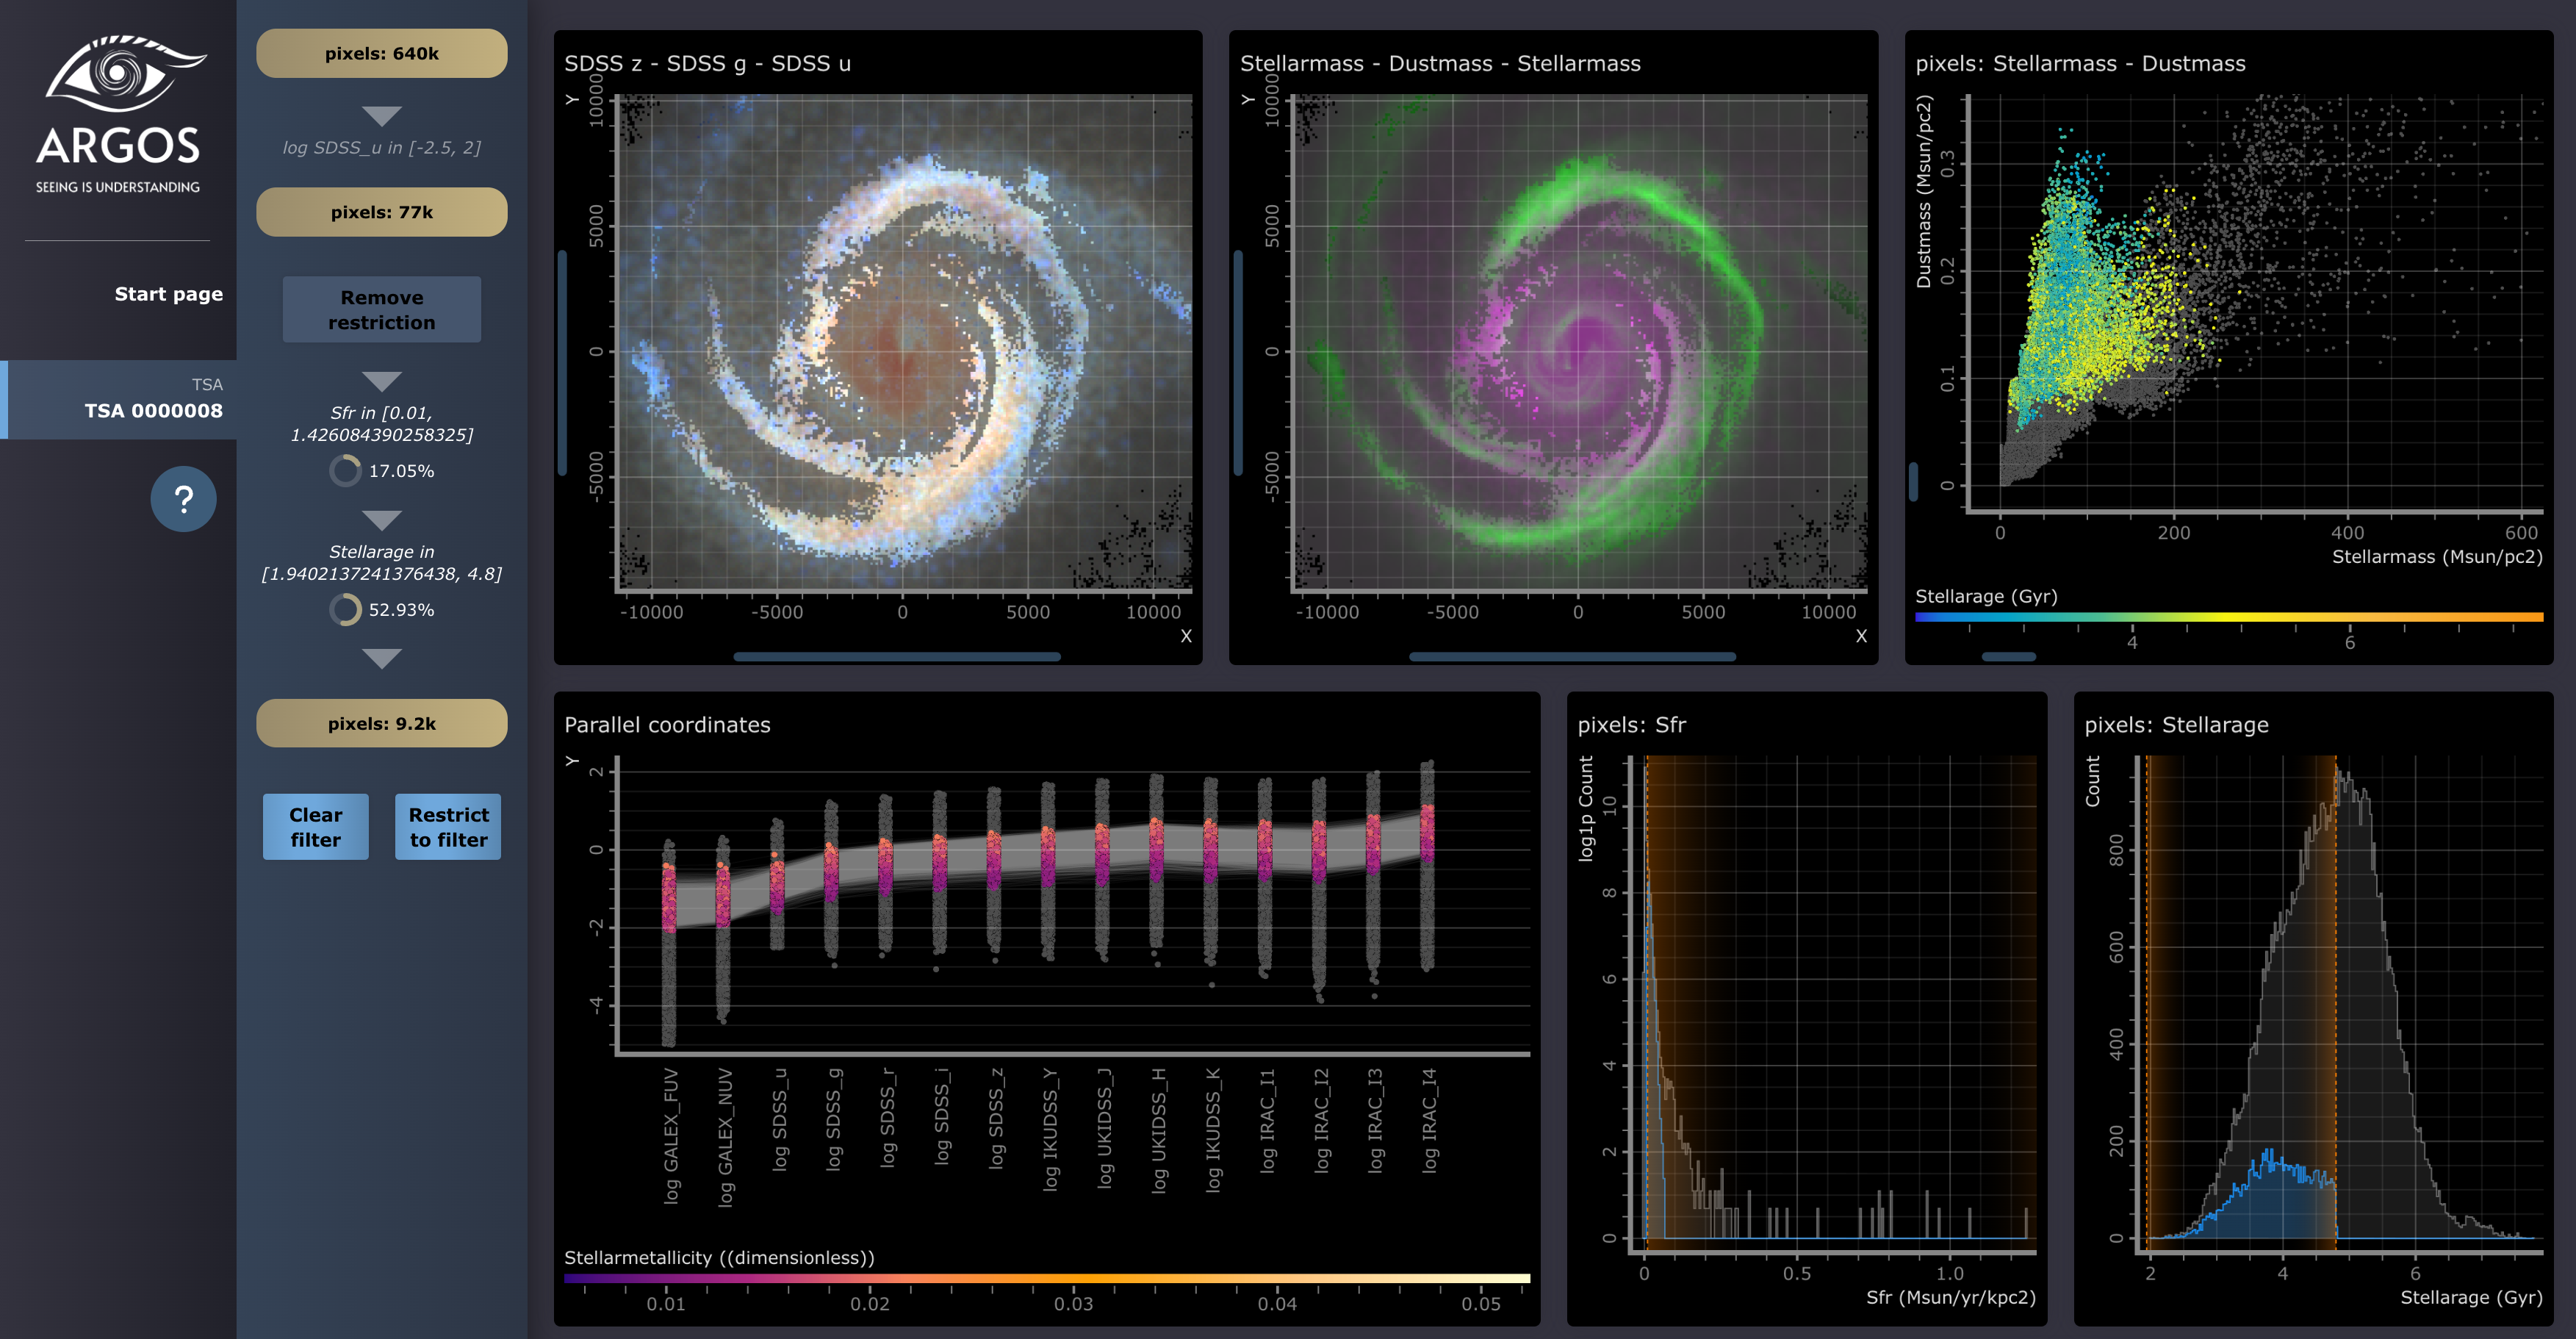
Fig 4: Example of an ARGOS dashboard showing a TNG50-SKIRT Atlas galaxy. Top row, left to right: pseudocolour
Limitations
- Maximum asset size is limited to approximately 1–2 GB due to browser memory and IndexedDB constraints, requiring downsampling for larger datasets.
- ARGOS does not support full-resolution 3D volume rendering or complex server-side querying, limiting applicability for very large or raw unprocessed simulation outputs.
- No formal user studies or quantitative evaluations of usability and scientific impact are reported.
- The reactive scripting language is lightweight and may not support complex automation workflows requiring extensive programming.
- Performance depends on client hardware and browser capabilities, potentially limiting use on lower-end devices.
- ARGOS’s design prioritizes interactivity over exhaustive analysis pipelines, so it complements rather than substitutes advanced HPC or desktop tools.
Open questions / follow-ons
- Can ARGOS be extended to support streaming or incremental data loading to handle even larger datasets without prior downsampling?
- How does user-driven visual exploration in ARGOS quantitatively improve scientific discovery or error diagnosis compared to traditional batch plotting workflows?
- What are the best practices for integrating ARGOS with batch simulation pipelines for continuous quality control and monitoring?
- Can the embedded scripting engine be expanded to support more complex, programmable analysis tasks while maintaining web-native performance?
Why it matters for bot defense
While ARGOS is not a security or bot-defense tool, its design principles for scalable, responsive, browser-native, GPU-accelerated visual analytics of large datasets provide useful patterns for CAPTCHA/anti-bot practitioners. For example, techniques for efficiently rendering and interacting with millions of high-dimensional data points in real-time without server-side computation could inspire similar front-end data exploration or behavior analysis dashboards. The concept-driven, flexible schema and scriptable dashboards highlight architectures that encourage user customization while preserving responsiveness. Moreover, ARGOS’s approach to combining multiple coordinated views and interactive filtering can inform sophisticated anomaly detection UIs for bot traffic pattern analysis or CAPTCHA performance monitoring. However, its client-side data size and complexity limits contrast with bot detection needs for low-latency but lightweight, scalable inference and risk scoring.
Cite
@article{arxiv2607_29426,
  title={ Visual analytics for cosmological simulation results },
  author={ Paul Vauterin and Maarten Baes },
  journal={arXiv preprint arXiv:2607.29426},
  year={ 2026 },
  url={https://arxiv.org/abs/2607.29426}
}