
A Human-Centered Validation of the Explainability-Performance Coefficient
Source: arXiv:2607.29614 · Published 2026-07-31 · By Christian Oliva, Luis F. Lago-Fernández
TL;DR
This paper addresses a fundamental challenge in Explainable AI (XAI): objectively evaluating explanation quality by balancing explanation sparsity with preserved predictive performance. The authors propose an extension of the Explainability-Performance Coefficient (EPC) into a scalar EPC score that summarizes the trade-off between selecting compact, relevant feature subsets versus model accuracy degradation. Their key innovation is to assess explanations across multiple data modalities (tabular, image, text) and network architectures, validating that higher EPC scores reflect explanations that better align with both model behavior and independent human explanations. Empirical evaluations identify Integrated Gradients as a consistently top-performing explainer, while revealing how dataset dimensionality, network activation functions, and nullification methods impact the validity of saliency-based explanations. The EPC score provides a practical, model-agnostic metric to quantitatively compare explanation fidelity in a human-centered manner.
Key findings
- The EPC score correlates strongly with independent human-centered explainability measures, including lexical sentiment scores (AFINN lexicon) and spatial visual annotations (ImageNet ROIs).
- Integrated Gradients consistently outperforms other local explainers like Gradient × Input, LRP, SHAP, and LIME across tabular, image (MNIST, ImageNet), and text (IMDB) datasets when measured by the EPC score.
- Nullification strategies significantly affect EPC results; Gaussian blur as a nullifier mitigates out-of-distribution artifacts in image data better than zero-masking, improving faithfulness of explanations.
- EPC curves reveal that explanations are less faithful on models using non-ReLU activations (e.g., Sigmoid, tanh), due to instability in methods like LRP under these activations.
- The EPC score quantitatively captures the expected linear upper bound of explanation quality, where a perfect explainer would achieve an EPC curve equal to k/100, interpolating sparsity k.
- Deletion top-k and bottom-k protocols provide complementary perspectives — deletion of high-relevance features triggers performance drops while deletion of low-relevance features minimally impacts predictions, validating explanation utility.
- Score normalization by original model performance and perturbation sensitivity analysis ensure the EPC is robust and meaningful across data modalities and model capacities.
- EPC scores greater than 1 can occur when removing irrelevant features improves model performance, especially in weaker baseline models.
Threat model
The adversary is an evaluator with black-box access to the model’s predictions and the ability to perturb input features by nullification, aiming to validate explanation fidelity. The evaluator does not alter the model or know its internals beyond input-output behavior. The setting assumes no capability for adversarial manipulation or model inversion.
Methodology — deep read
The authors focus on evaluating local explanations of models (neural networks) via the Explainability-Performance Coefficient (EPC), which balances sparsity of selected features against the preserved prediction accuracy. The threat model assumes a black-box model whose outputs can be perturbed by nullifying input features, with the adversary being an evaluator trying to validate explanation quality—that is, the extent to which identified relevant features truly influence model output.
They use three datasets spanning tabular, vision, and NLP modalities: a Kaggle bank loan default dataset (45,000 samples, 21 features after one-hot encoding), MNIST digits, ImageNet images, and IMDB movie reviews. Explanations were computed on subsets of training samples (e.g., 1000 for tabular, 2000 for IMDB).
Explanation algorithms benchmarked include model-agnostic methods (SHAP, LIME), model-specific gradient-based and propagation-based methods (Gradient × Input, Integrated Gradients (IG), Linear Integrated Gradients, Layer-wise Relevance Propagation (LRP), Grad-CAM). The relevance vectors assign signed attributions per feature.
For evaluation, the authors systematically perturb inputs by nullifying subsets of features determined by percentiles k of the relevance scores. They compute model performance when either the top k% least relevant features are nullified (bottom-k deletion), or the top k% most relevant features are nullified (top-k deletion). Nullification is implemented by feature masking or smoothing (e.g., mean imputation, Gaussian blur on images) to avoid artifacts biasing model responses.
The EPC for sparsity level k is computed as the normalized performance gap between deleting bottom-k versus top-k features relative to original performance. The EPC curve across k in [0, 50] is plotted against an optimal upper bound f(k) = k/100. The EPC score is defined as 1 minus the normalized area between f(k) and the EPC curve — a scalar summary metric.
Training details of the base models (CNNs, LSTMs, MLPs) vary per dataset but include standard architectures trained on the original datasets. The analysis isolates effects of model activation functions and nullification choices.
Evaluation metrics include model accuracy or AUC under perturbed inputs for deletion tests, correlation between EPC scores and human-centered lexical or spatial annotations. Baselines are standard explainability metrics and individual explainers. Ablations assess performance under different nullifiers and activation functions.
Code release status is not explicitly stated. Experiments involve extensive cross-modality and model-architecture explorations. The approach is fully model-agnostic, only needing input perturbations and output observations to compute the EPC.
Technical innovations
- Introduction of the EPC score, a scalar summary of the Explainability-Performance Coefficient curve that quantitatively balances feature selection sparsity and preserved model performance across data modalities.
- Use of a percentile-based thresholding method to define top-k and bottom-k feature subsets for perturbation, enabling contrastive evaluation of explanation reliability.
- Empirical validation of EPC against independent human explanations (lexical sentiment and visual annotations), bridging objective metrics with human-centered criteria.
- Demonstration that the choice of perturbation strategy (e.g., Gaussian blur vs. zero-masking) critically impacts explanation evaluation, especially for high-dimensional inputs.
Datasets
- Kaggle bank loan default dataset — 45,000 samples, 21 features after encoding — public Kaggle source
- MNIST — 70,000 handwritten digit images — public
- ImageNet — millions of annotated images for object classification — public
- IMDB movie review dataset — 50,000 text reviews labeled for sentiment — public
Baselines vs proposed
- Gradient × Input: EPC score significantly lower than Integrated Gradients (IG) which achieves highest EPC score across all modalities
- SHAP and LIME: slower and less consistent EPC scores compared with IG on tabular and image data
- LRP: unstable EPC scores under Sigmoid and tanh activations, performs worse than IG
- Grad-CAM: produces coarse maps with lower EPC scores than IG on ImageNet
- Nullification with Gaussian blur increases EPC scores by up to 12% over mean imputation in image datasets
Figures from the paper
Figures are reproduced from the source paper for academic discussion. Original copyright: the paper authors. See arXiv:2607.29614.
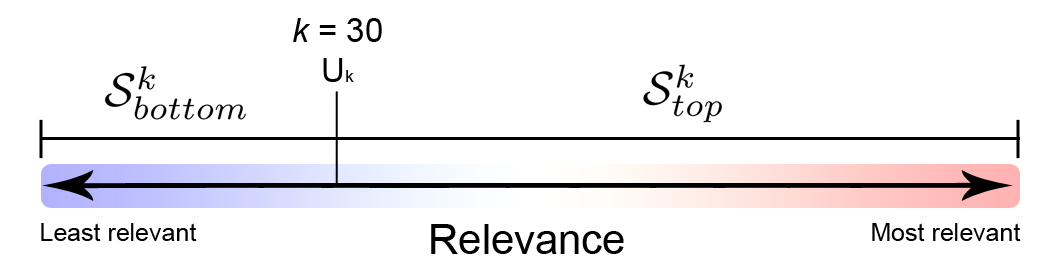
Fig 1: Illustration of the percentile-based feature partitioning strategy. For a given
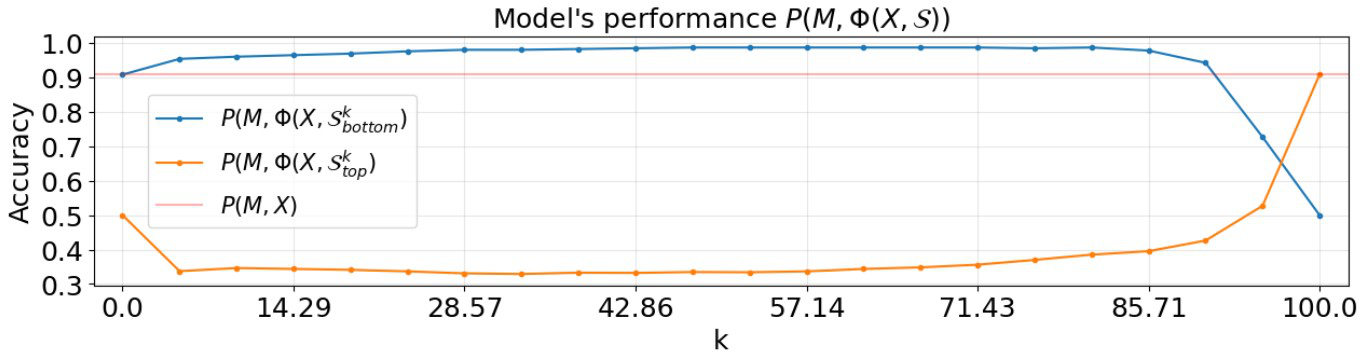
Fig 3: EPC curve (solid blue) plotted against the expected Optimal EPC (shaded
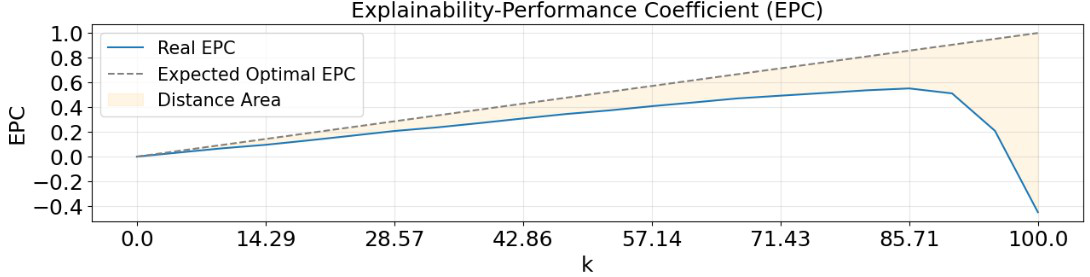
Fig 4: EPC curves for several explainers under ReLU activation function across dif-
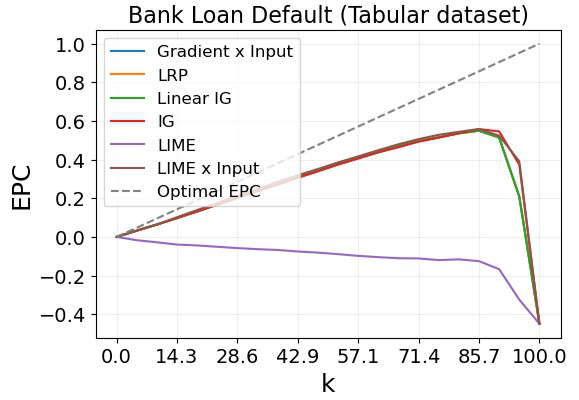
Fig 4 (page 19).
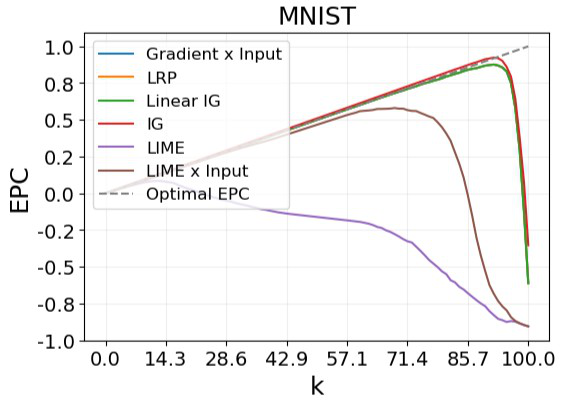
Fig 5 (page 19).
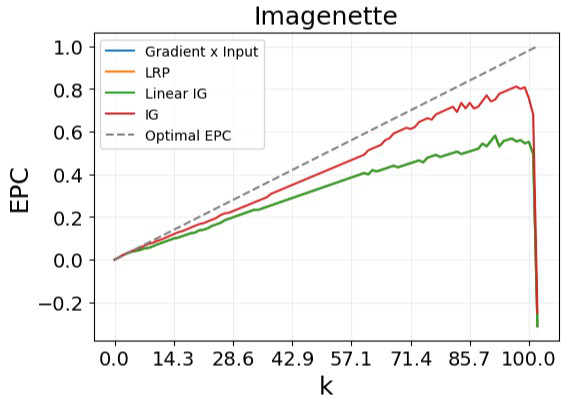
Fig 6 (page 19).
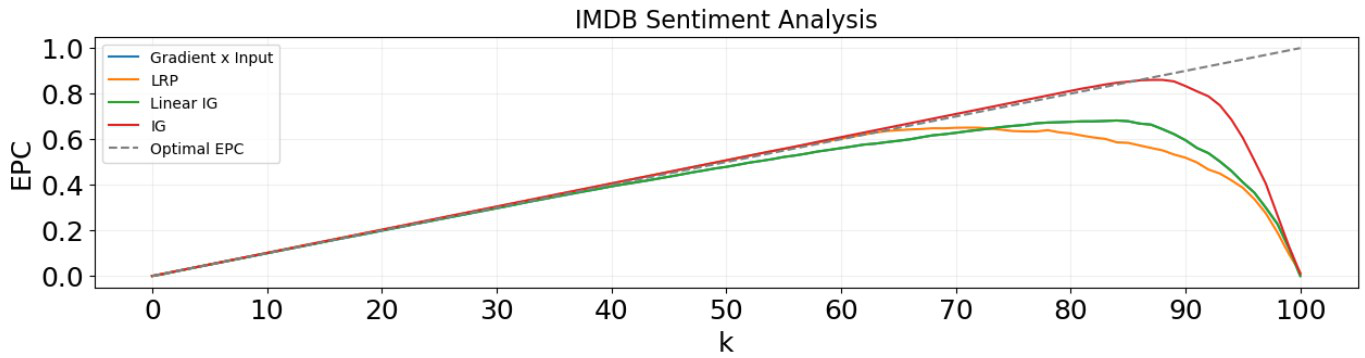
Fig 5: EPC curves for model-specific explainers for IMDB dataset. Note that Gradient

Fig 6: Distribution of Sγ=5(w) obtained with Integrated Gradients after filtering out
Limitations
- No adversarial evaluation of explanations under malicious perturbations or model manipulation was performed.
- The EPC score depends on the choice of perturbation function Φ, which may bias certain models or data types.
- Experiments primarily involve standard datasets; generalization to other domains is not demonstrated.
- Several explainers (e.g., LRP) suffer from instability in non-ReLU activations impacting EPC interpretation.
- The code release status is unclear, potentially limiting reproducibility.
- Human-centered validation is indirect (lexical and spatial alignment) rather than involving human user studies.
Open questions / follow-ons
- How does EPC perform under adversarial attacks or model manipulation aimed at deceiving explainability metrics?
- Can the EPC score be integrated with other explanation evaluation frameworks to better capture stability and robustness beyond deletion tests?
- What are the implications of using EPC in real-world high-stakes domains with more complex data and user feedback?
- How can nullification methods be standardized or adapted dynamically to improve fidelity without introducing artifacts?
Why it matters for bot defense
For bot-defense and CAPTCHA practitioners, the EPC score provides a rigorous, quantitative metric to evaluate explanation quality of models that classify or assess user behavior. Since bot-detection models often operate in complex, multimodal feature spaces, the EPC’s model-agnostic nature and human-centered validation offer a pathway to more trustworthy explanations that align with human intuition and operational needs. This insight aids in diagnosing whether explanations truly reflect model logic or simply artifact correlations, helping engineers choose and tune explainers for security applications. Additionally, understanding how factors like nullification strategies and model activations affect explanation fidelity can improve the design of interpretable bot-detection pipelines to resist evasion.
Cite
@article{arxiv2607_29614,
  title={ A Human-Centered Validation of the Explainability-Performance Coefficient },
  author={ Christian Oliva and Luis F. Lago-Fernández },
  journal={arXiv preprint arXiv:2607.29614},
  year={ 2026 },
  url={https://arxiv.org/abs/2607.29614}
}