
A study of the large-scale formation in the environment of A3266: Infalling groups, filaments, and a premerger cold front
Source: arXiv:2607.28140 · Published 2026-07-30 · By J. Dietl, A. Veronica, T. H. Reiprich, F. Pacaud, Y. Zhao, J. S. Sanders et al.
TL;DR
This study investigates the large-scale environment surrounding the dynamically active galaxy cluster Abell 3266 (A3266) using eROSITA X-ray survey data combined with galaxy distribution data and cosmological simulations. The main goal is to characterize the previously unexplored cluster outskirts out to about three times the virial radius (3R100), identify and analyze neighboring galaxy groups, and search for filamentary structures connecting A3266 to its environment. The authors detect a statistically significant X-ray filament connecting A3266 to its nearest northwestern galaxy group that extends over a physical 3D length of roughly 1.1 (+0.5, -0.1) Mpc with a 3.6σ significance level. This filament shows elevated temperature (~1.2 keV) and electron density (~8 × 10^-5 cm^-3) properties consistent with processed intracluster gas rather than pristine warm-hot intergalactic medium (WHIM). The northwestern group itself shows cool-core characteristics and is embedded within this filament. Comparison to the cosmological simulation SLOW reveals qualitative agreement that such filamentary group arrangements trace ongoing cluster accretion from the cosmic web, highlighting A3266 as an actively assembling system.
Key findings
- Detection of an X-ray emitting filament connecting A3266 to its nearest NW galaxy group over a 3D length of 1.1 (+0.5, -0.1) Mpc with 3.6σ significance.
- Filament properties include temperature T = 1.2 (+0.3, -0.2) keV, metallicity Z = 0.07 (+0.09, -0.05) Z_⊙, and electron density n_e = (8 (+1, -2)) × 10^-5 cm^-3 assuming cylindrical geometry.
- Surface brightness excess between A3266 and NW group of (8 ± 2) % beyond model accounting for elongated cluster morphology and group emission, indicating filament presence (Fig. 6).
- The NW group exhibits a surface brightness discontinuity with a density jump of 2.8 ± 0.7 at ~1.8 arcmin, consistent with a cold front rather than a shock.
- X-ray emission in cluster outskirts extends beyond the virial radius (R100) in most directions except southeast, where emission falls below cosmic X-ray background (CXB).
- Two narrow arm-like surface brightness features west of A3266 detected at 4.6σ and 4.9σ significance, reaching ~R100, suggesting localized anisotropic gas structures linked to accretion or stripped gas.
- Comparison to galaxy distribution from NASA/IPAC Extragalactic Database (NED) shows spatial correlation of galaxy groups and filaments around A3266 consistent with accretion along cosmic web.
- Cosmological simulation SLOW qualitatively reproduces the observed filament and group morphology, supporting interpretation of an actively accreting system.
Methodology — deep read
Threat Model & Assumptions: The work assumes that A3266 and its surrounding galaxy groups form a complex dynamical system embedded within the cosmic web. The study aims to detect low surface brightness extended X-ray emissions such as filaments and group outskirts, implicitly assuming the absence of major foreground/background contamination after excision of resolved sources. The analysis assumes cylindrical geometry for filament density estimation and negligible projection effects for the detected filamentary structure.
Data: The X-ray data are from the eROSITA all-sky survey (eRASS:5) covering multiple sky tiles that include A3266 and environs. Seven telescope modules were used with energy bands adjusted (0.3-2.0 keV for most; 0.8-2.0 keV for modules 5 and 7 to reduce optical light leaks). Point sources and background/foreground clusters were excised using wavelet filtering, SExtractor detection, and manual refinement. The final cleaned images were adaptively smoothed for visualization. Spectral analysis used source and background regions carefully defined to isolate the NW group, the filament connecting it to A3266, and control sectors (NE blank region). Background modeling included particle-induced background, local hot bubble, Milky Way halo, and cosmic X-ray background components.
Architecture / Algorithm: For image analysis, the authors used wavelet transformations to denoise images and extract surface brightness profiles in well-defined sectors covering cluster, filaments, and groups. Surface brightness profiles were fitted using β-models (single and double) and broken power-law models for discontinuities. Spectral modeling employed XSPEC with multi-component background and absorbed thermal plasma emission models (apec) to derive gas temperature, metallicity, and emission measure. The electron density in the filament was derived from X-ray emission normalization assuming uniform cylindrical geometry, correcting for excluded areas due to point source removal.
Training Regime: Not applicable (observational astrophysics). Spectral fitting procedures included variation of the background parameters to test robustness. The authors applied consistency checks by comparing filtered sectors (cluster-facing vs cluster-opposite) in the NW group. Redshifts were allowed to vary for calibration.
Evaluation Protocol: The significance of filament and arm-like features was assessed by comparing surface brightness excess against background and modeled cluster emission with appropriate statistical errors. The filament detection significance was 3.6σ, arm-like features showed ~4.6-4.9σ. Temperature and metallicity uncertainties were quoted at 68% confidence intervals. The cluster and group radial profiles were compared to models to isolate excess emission indicative of filaments. The fit quality was evaluated visually and statistically.
Reproducibility: Data products are based on publicly available eROSITA all-sky survey datasets processed with eSASS software (cited versions). The authors do not mention releasing code or frozen models, but procedures follow standard X-ray astronomy analysis methods. The cosmological simulation SLOW used for qualitative comparison is referenced; data availability unclear.
Example end-to-end: To characterize the filament, they defined a rectangular region between A3266 and the NW group bounded by the R200 radii of both. Using wavelet-filtered images with point sources excised, they extracted the surface brightness profile in the NW sector. They fit β-models to the cluster outskirts and NW group and found an 8% excess surface brightness with 3.6σ significance beyond these models, indicating a filament. Spectra extracted from this region were fitted with thermal plasma models to obtain a filament gas temperature of 1.2 keV and metallicity 0.07 Z_⊙. Converting the plasma normalization using assumed cylindrical geometry gave an electron density of ~8 × 10^-5 cm^-3, consistent with gas pre-processed by cluster environment and infalling subgroups, as opposed to pristine warm-hot intergalactic medium.
Technical innovations
- Detection and confirmation of an X-ray emitting inter-cluster filament connecting a massive cluster (A3266) to its nearest group with detailed surface brightness and spectral analysis.
- Combining wavelet filtering techniques with adaptive smoothing and sector-based surface brightness profile modeling to isolate low surface brightness filament and subgroup emission beyond R200.
- Application of multi-component spectral background modeling tailored to eROSITA data including local hot bubble, Milky Way halo, and unresolved cosmic X-ray background for robust filament parameter estimation.
- Identification and characterization of a cold front candidate associated with a density jump at the NW group’s cluster-facing edge through combined imaging and spectral fitting, distinguishing it from a shock front.
Datasets
- eROSITA all-sky survey (eRASS:5) — multi-tile observations covering Abell 3266 and surrounding groups — public after proprietary period
- NASA/IPAC Extragalactic Database (NED) galaxy redshift catalog — 693 galaxies with spectroscopic and photometric redshifts within z = 0.0462–0.0730
- Simulating the LOcal Web (SLOW) cosmological simulation — used for qualitative comparison of group environment and filamentary structures
Baselines vs proposed
- Azimuthally averaged double-β model surface brightness: baseline profile vs NW sector including NW group and filament — emission excess: (8 ± 2)% at 3.6σ significance
- Cluster-facing vs cluster-opposite surface brightness profile of NW group — density jump of 2.8 ± 0.7 detected only in cluster-facing sector
- Filament temperature from spectral fit: T = 1.2 (+0.3, -0.2) keV vs expected WHIM temperature ~0.1-0.3 keV (literature typical range), indicating processed gas
- Metallicity in filament Z = 0.07 (+0.09, -0.05) Z_⊙ vs typically near-zero metallicity expected for unprocessed warm-hot intergalactic medium
Figures from the paper
Figures are reproduced from the source paper for academic discussion. Original copyright: the paper authors. See arXiv:2607.28140.
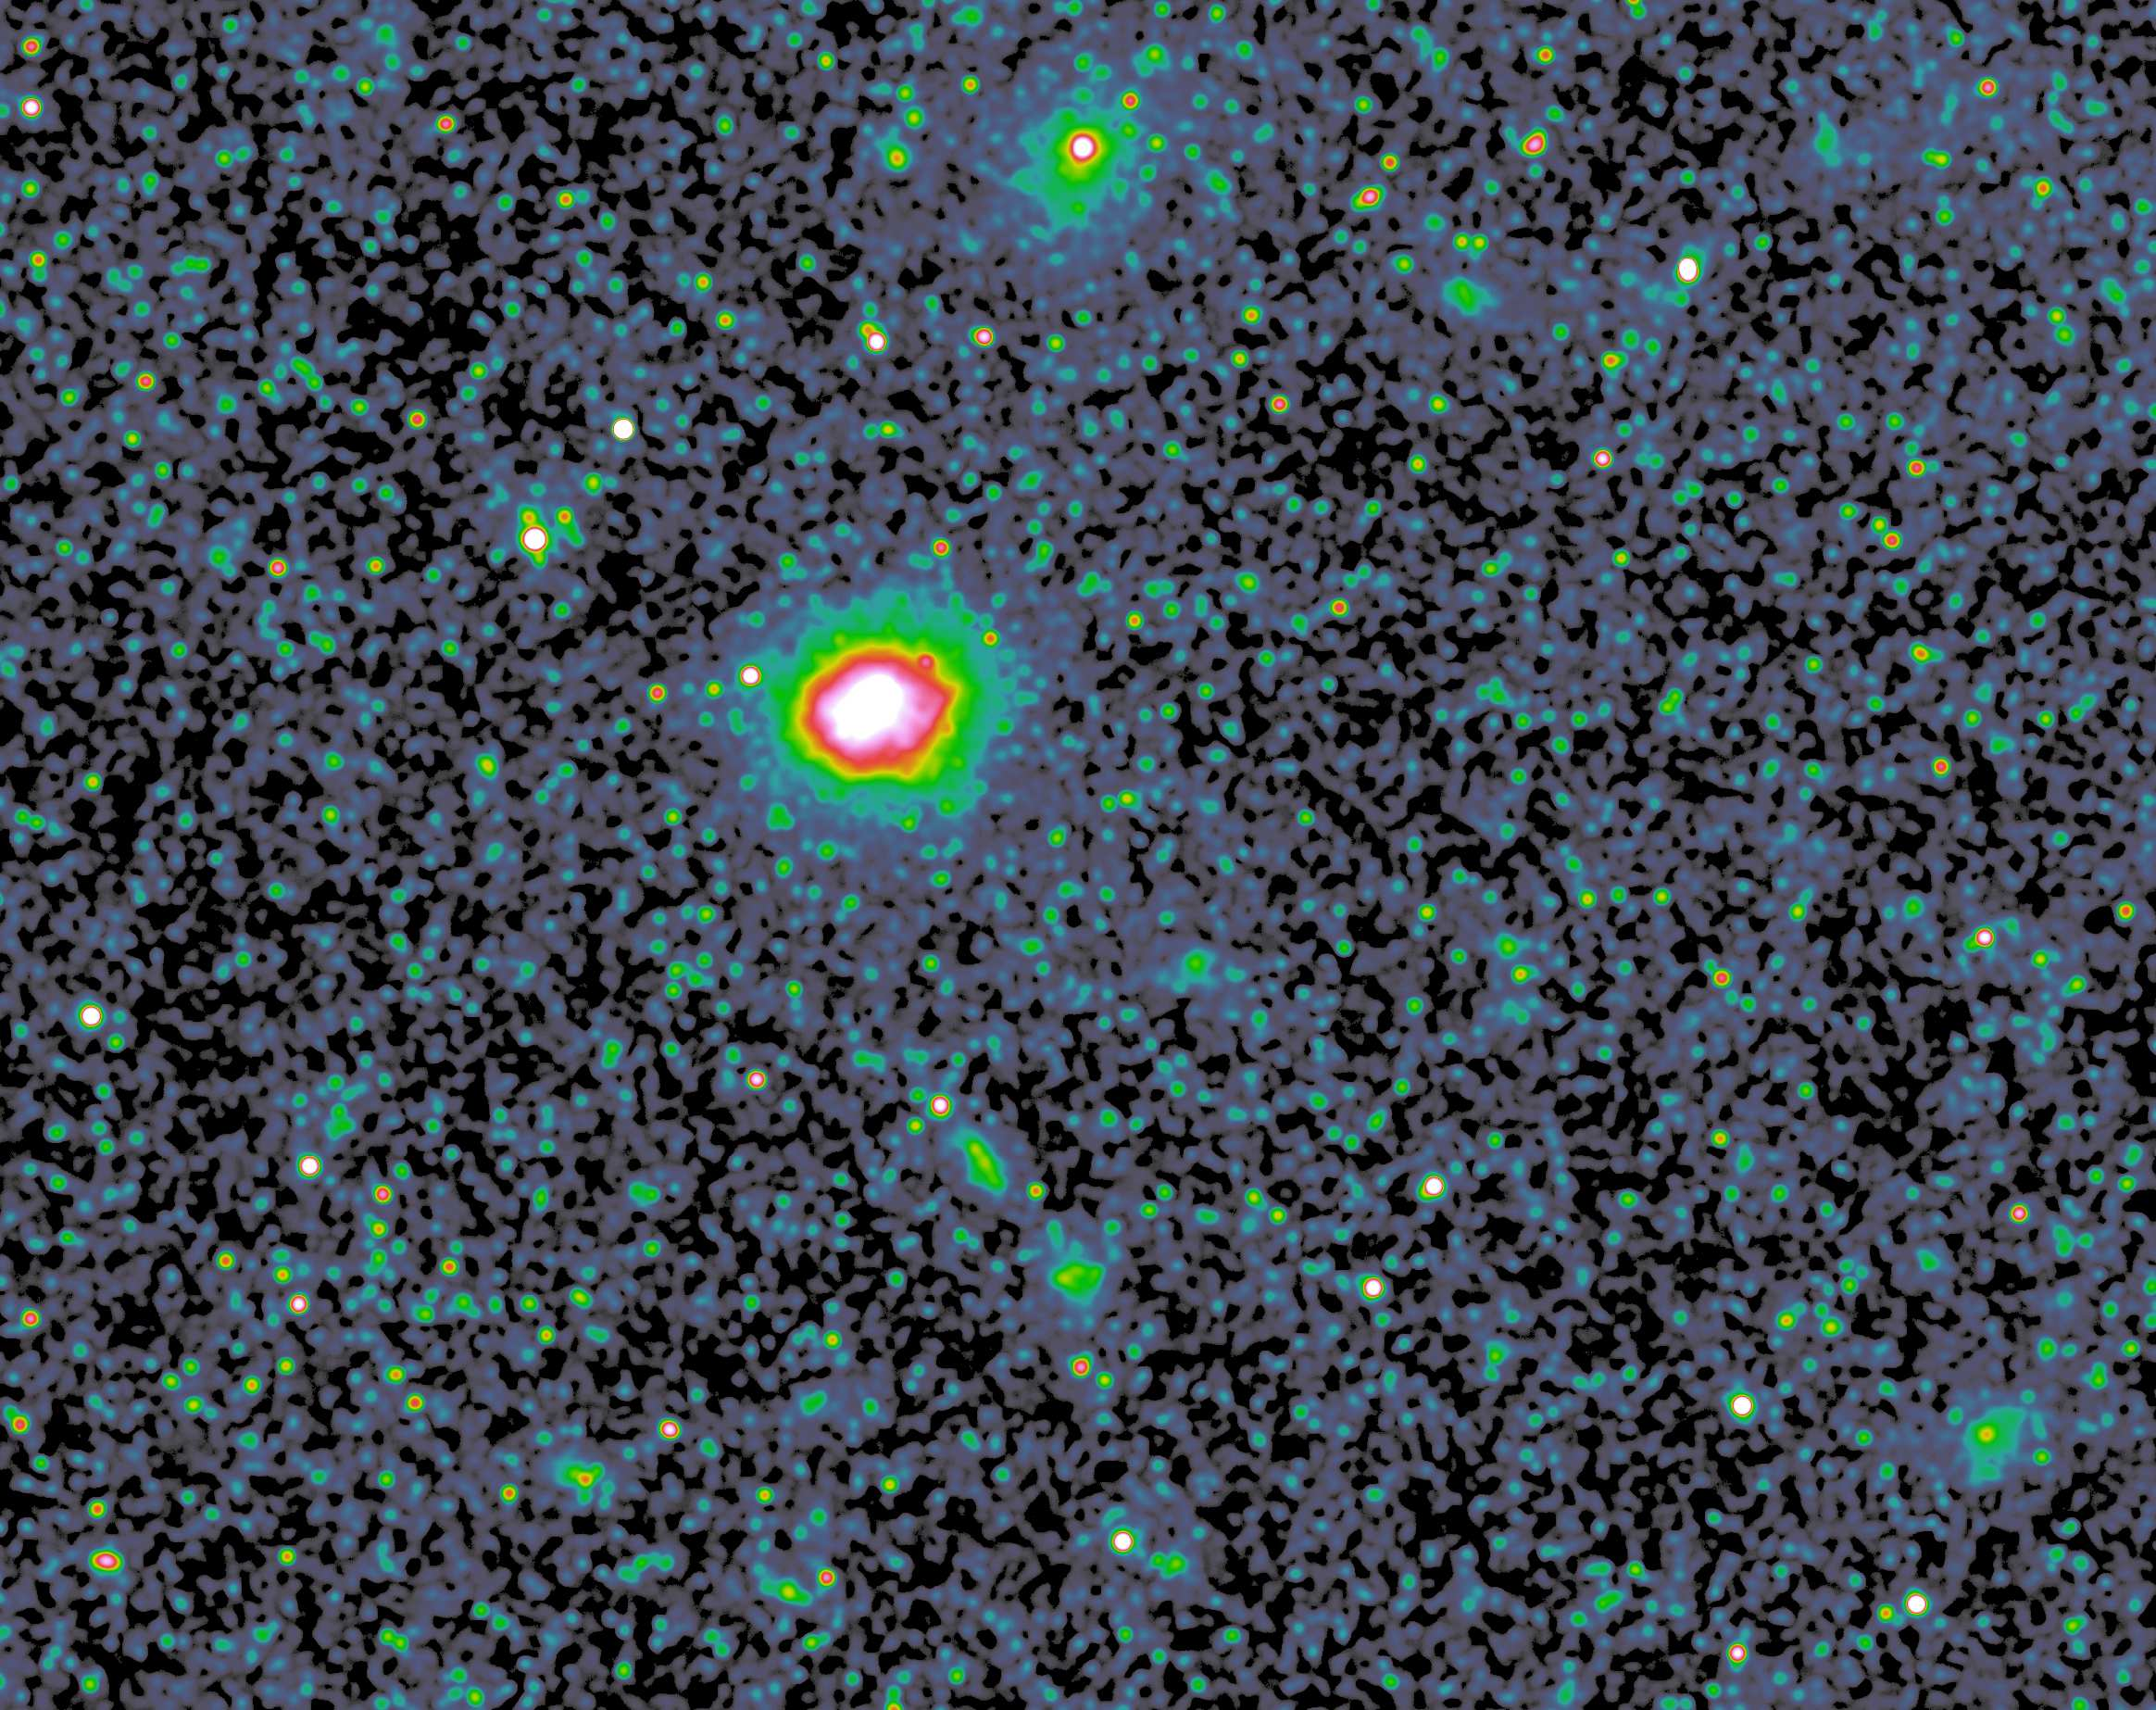
Fig 1: eROSITA image of the large-scale field around A3266 in the
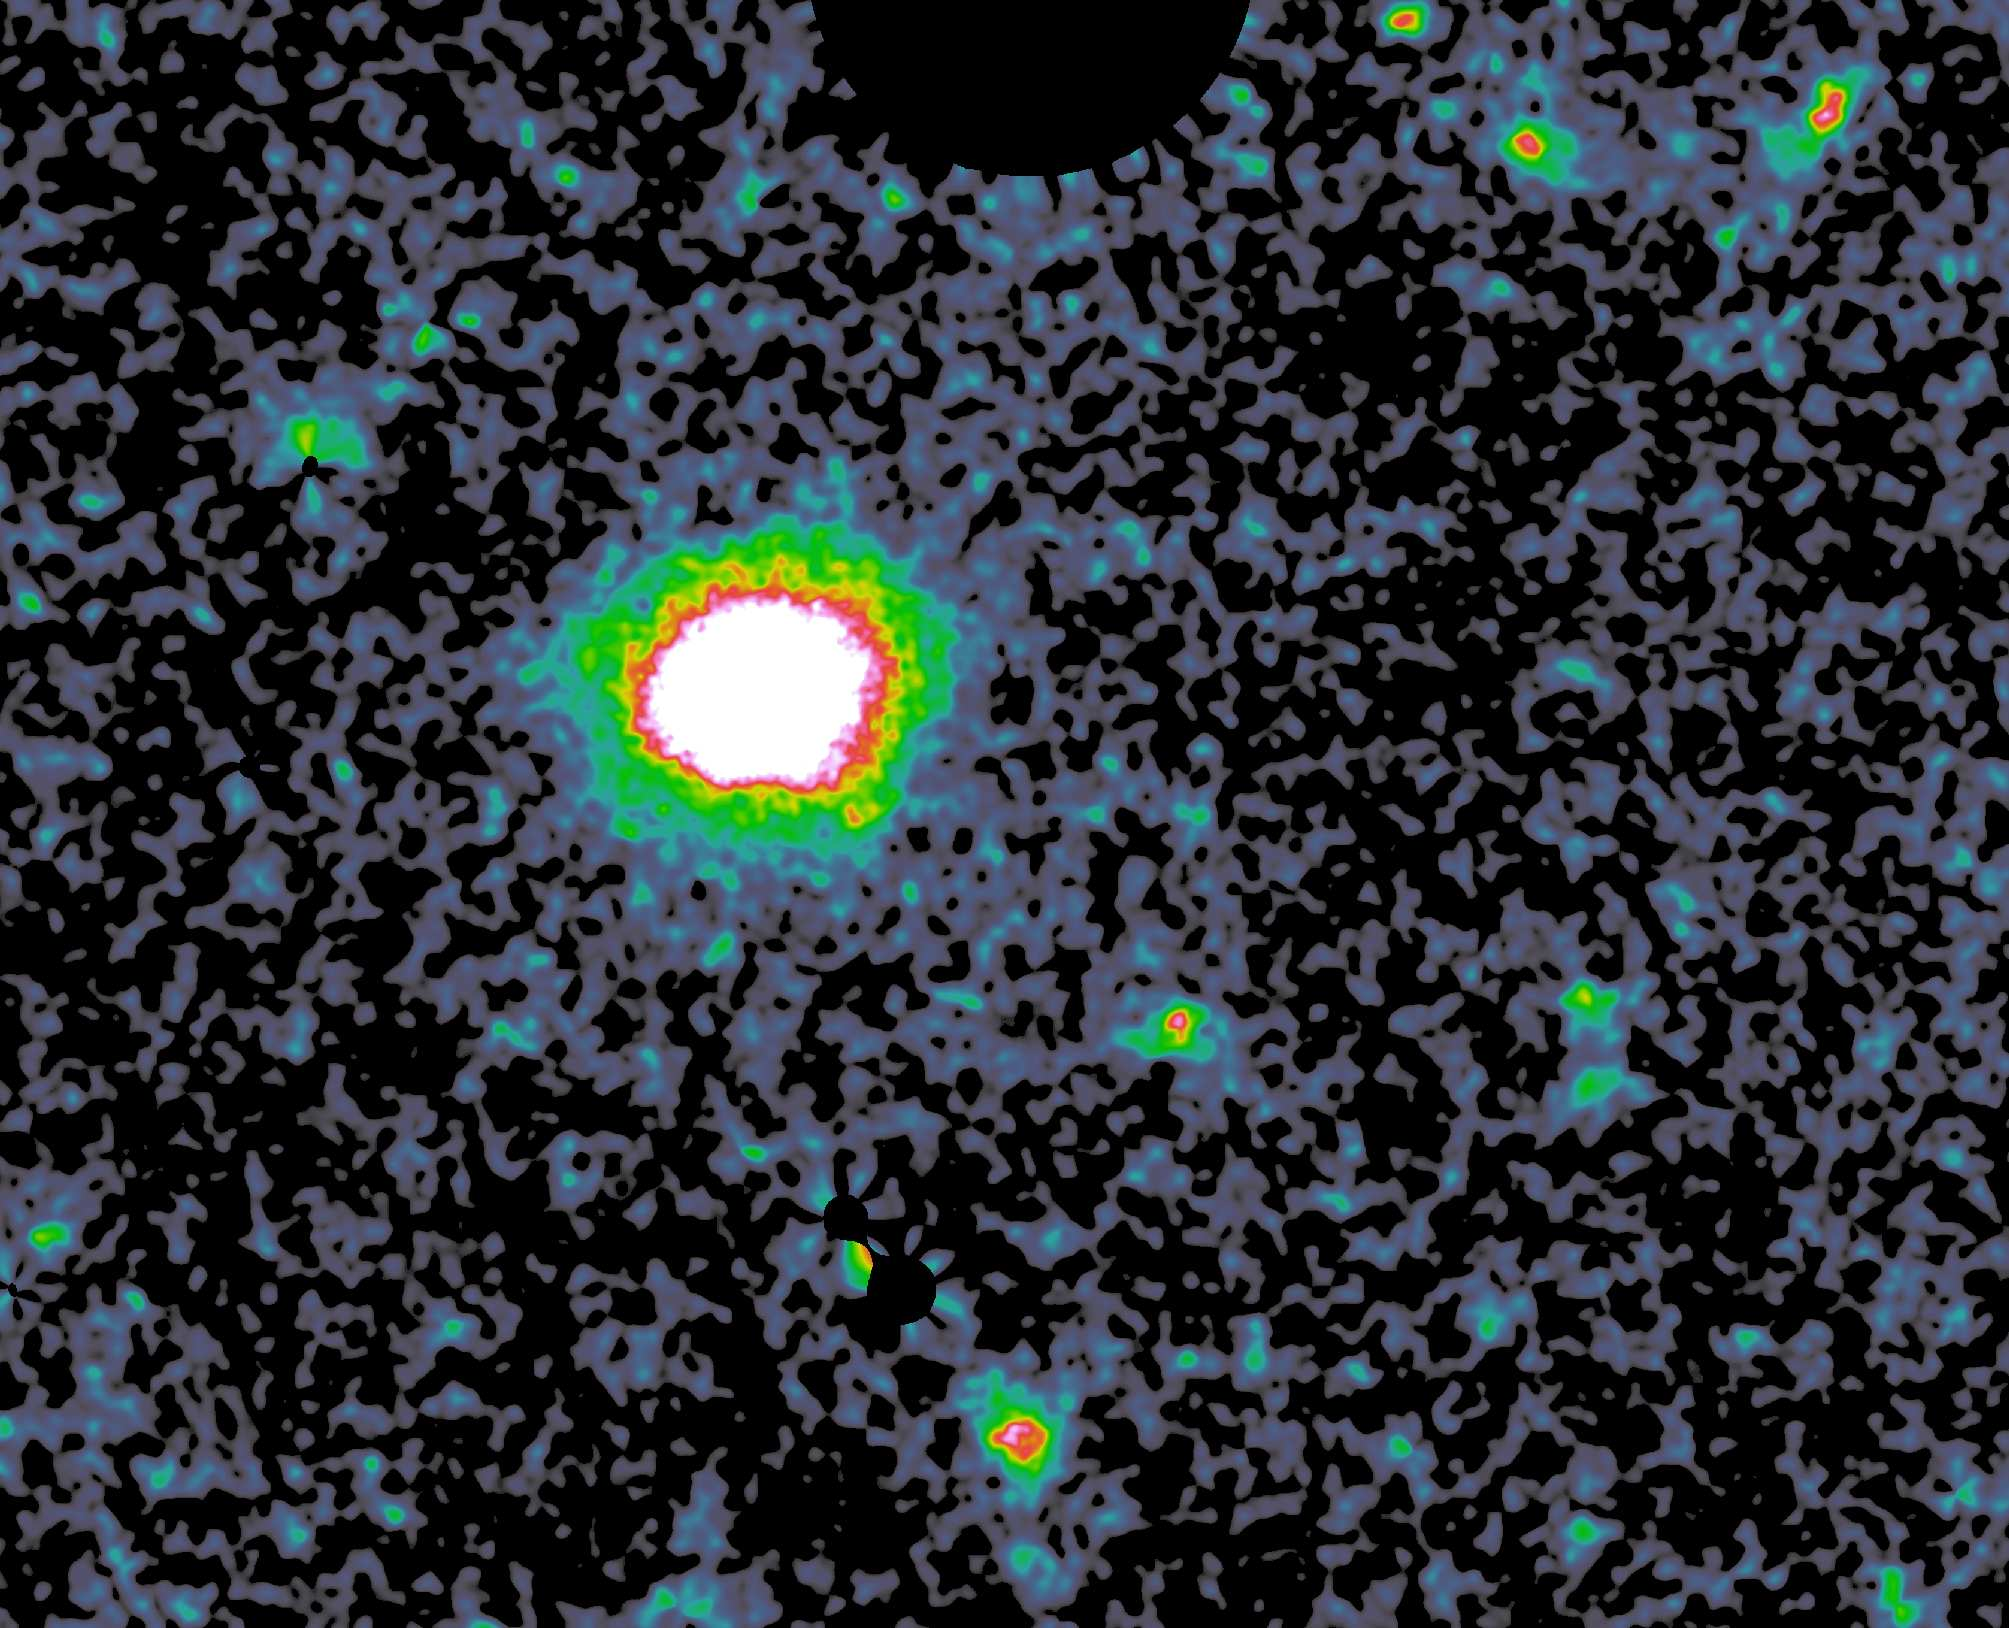
Fig 2: Data-reduced and adaptively smoothed eRASS:5 X-ray image
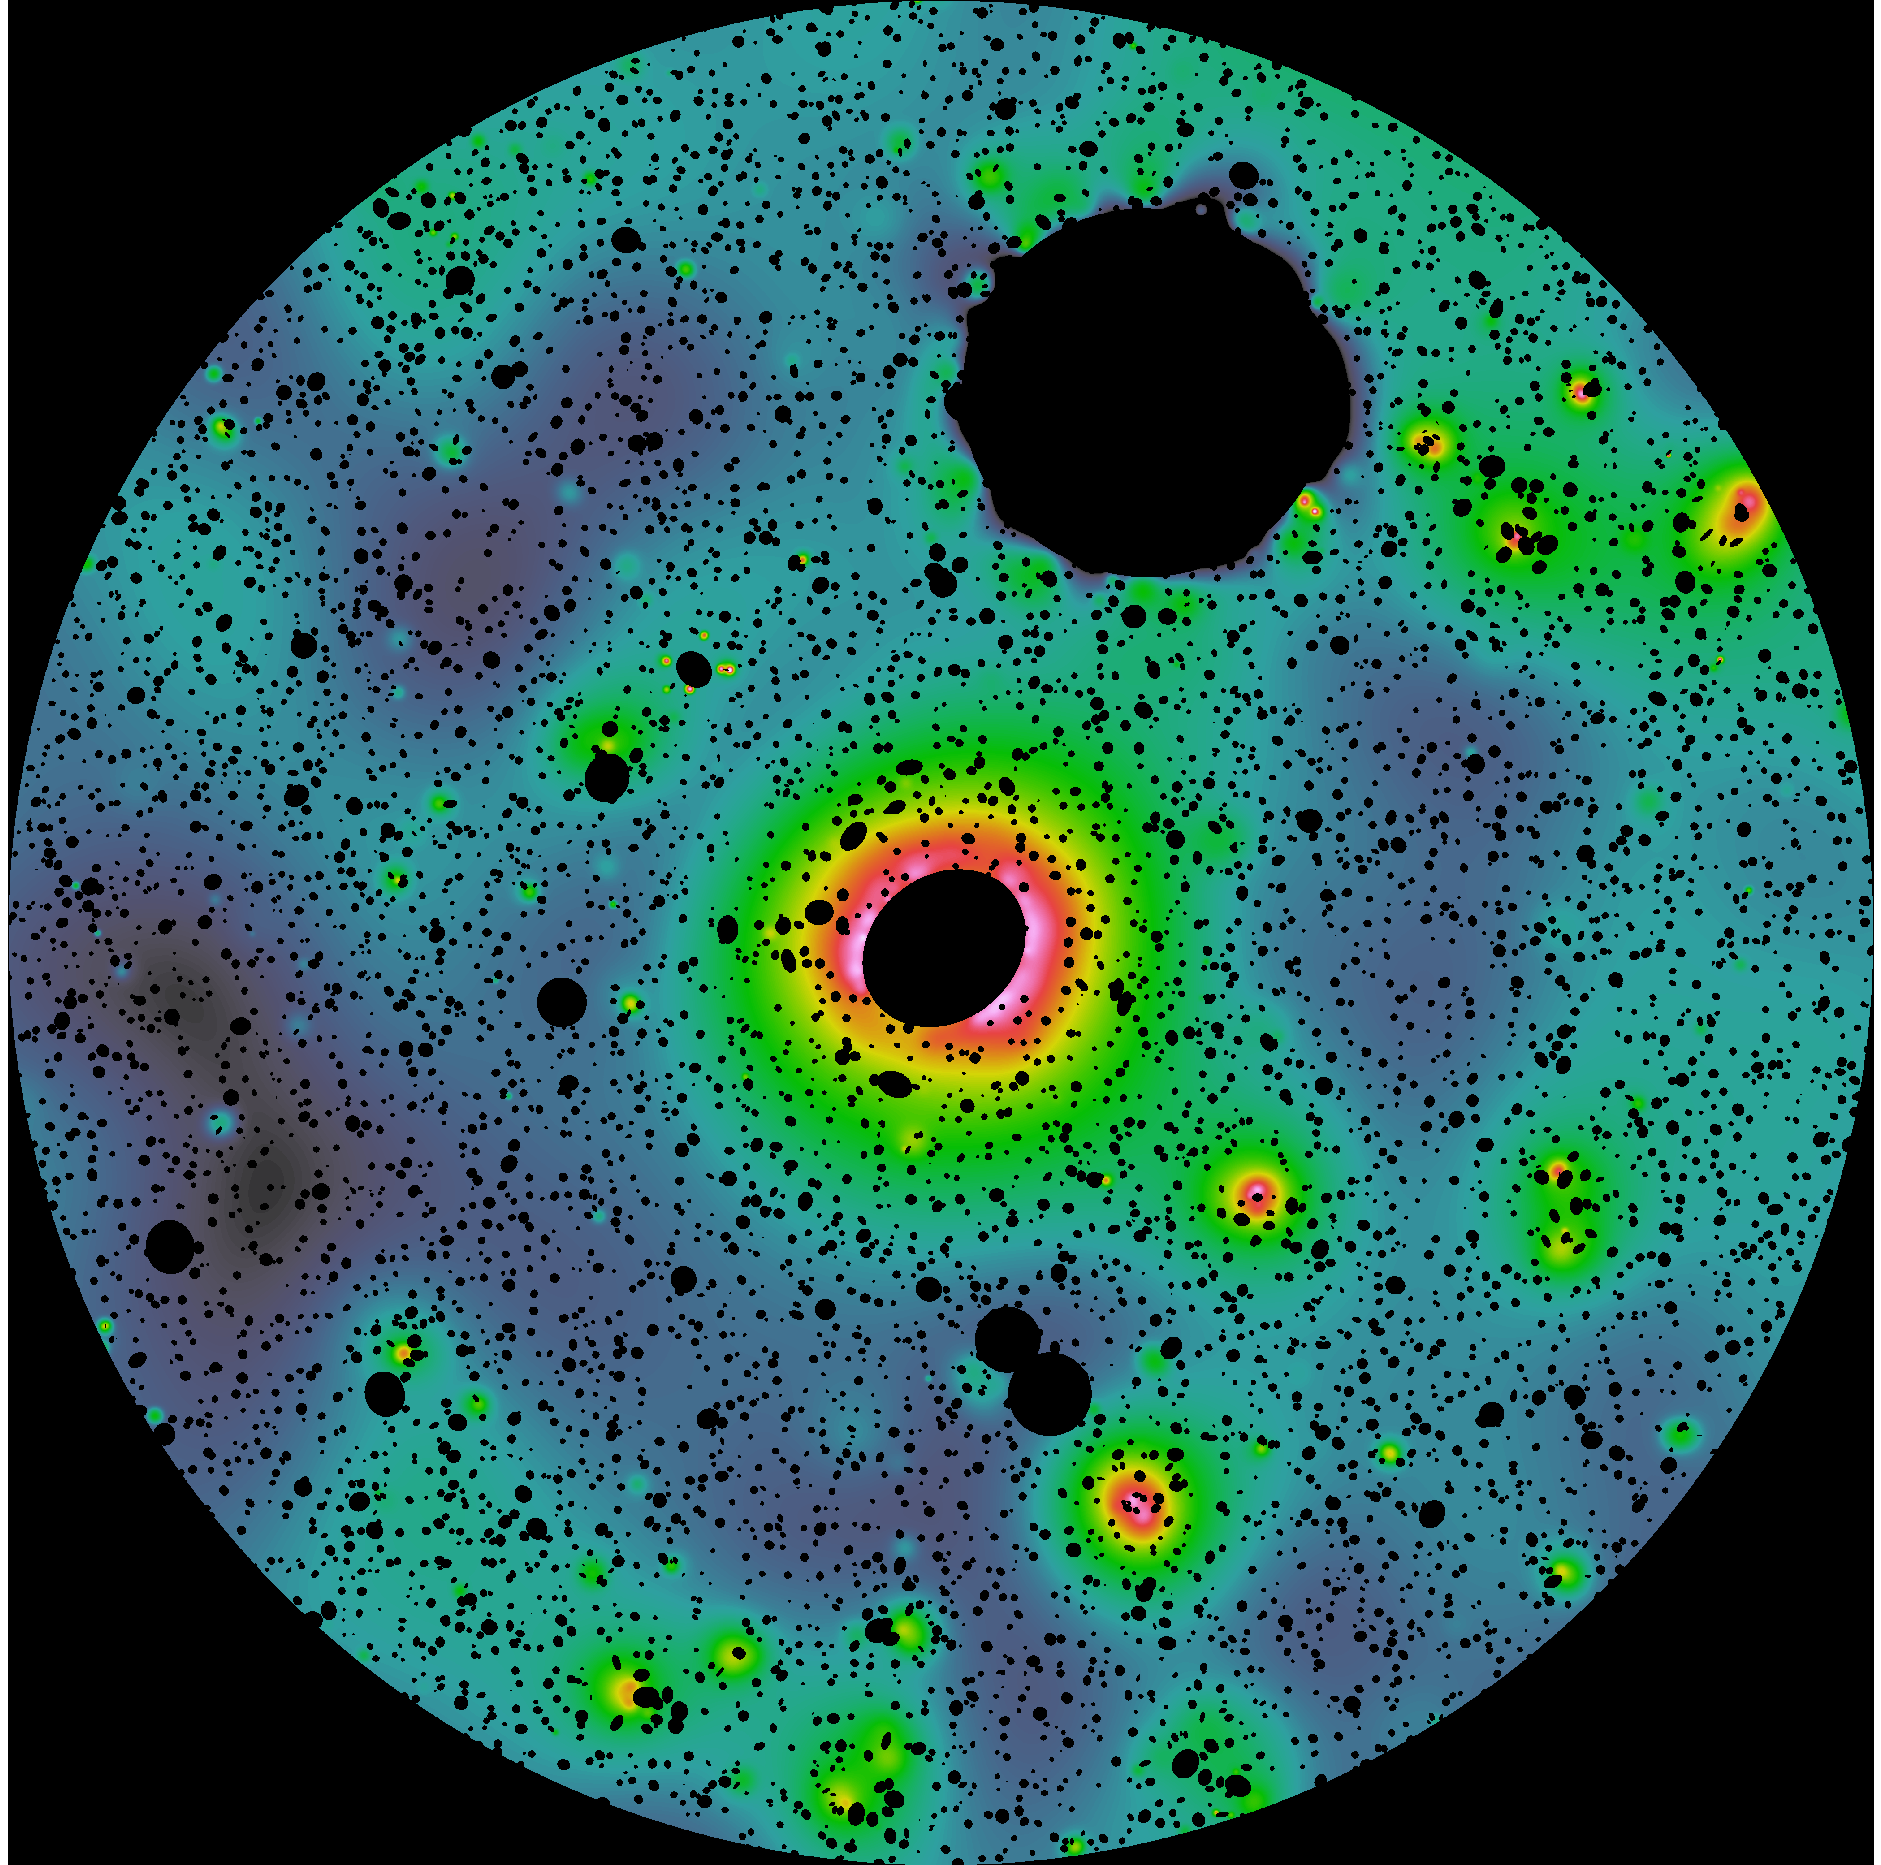
Fig 3: Wavelet-filtered image after source removal, cut to 3R100. The
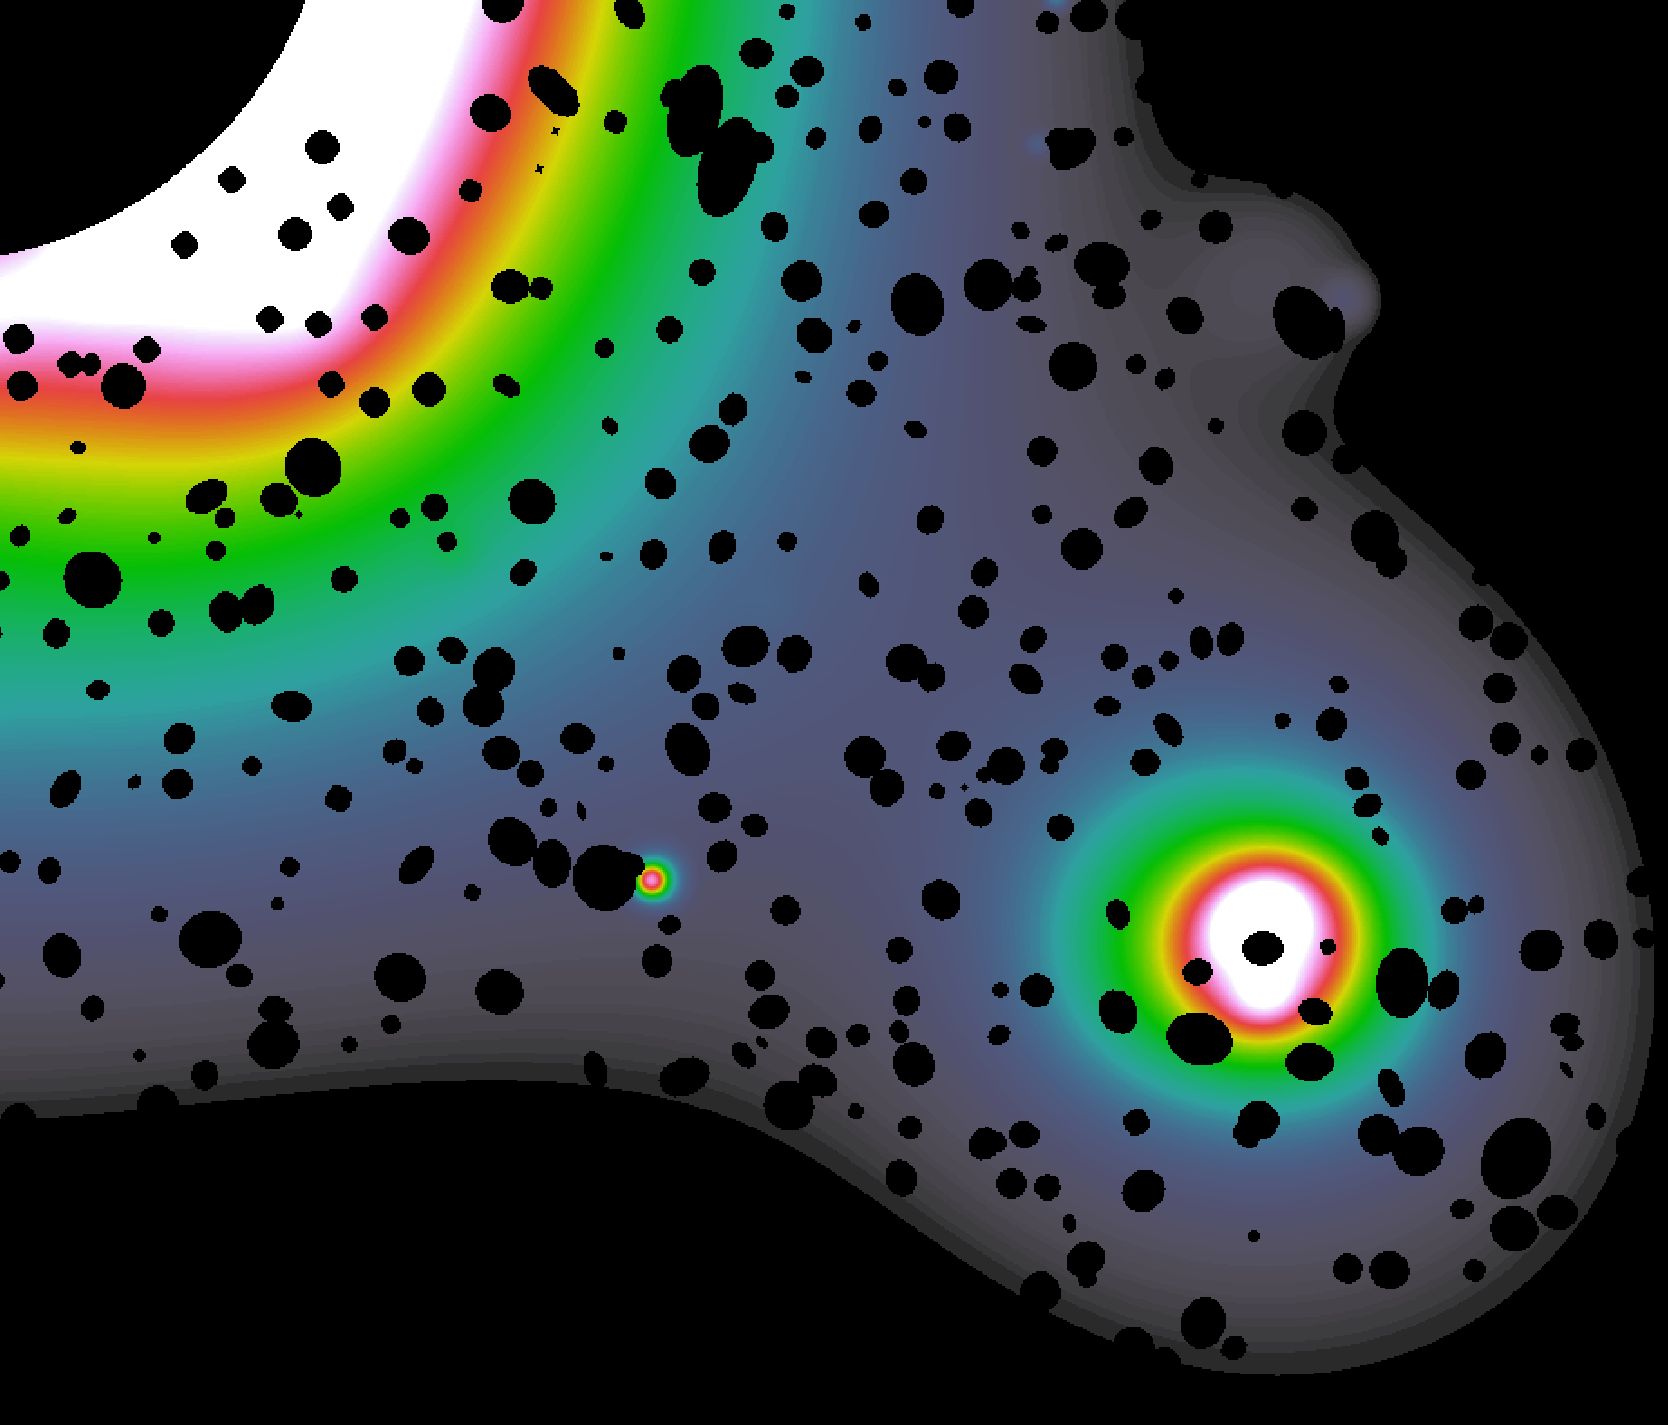
Fig 6: NW sector profile of A3266. The NW group is not excised. This
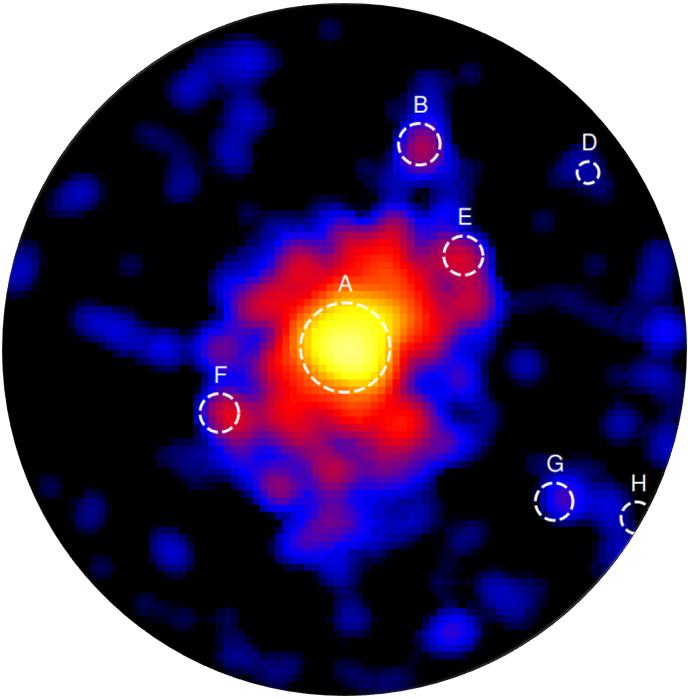
Fig 10: Galaxy density map of galaxies extracted from NED with a
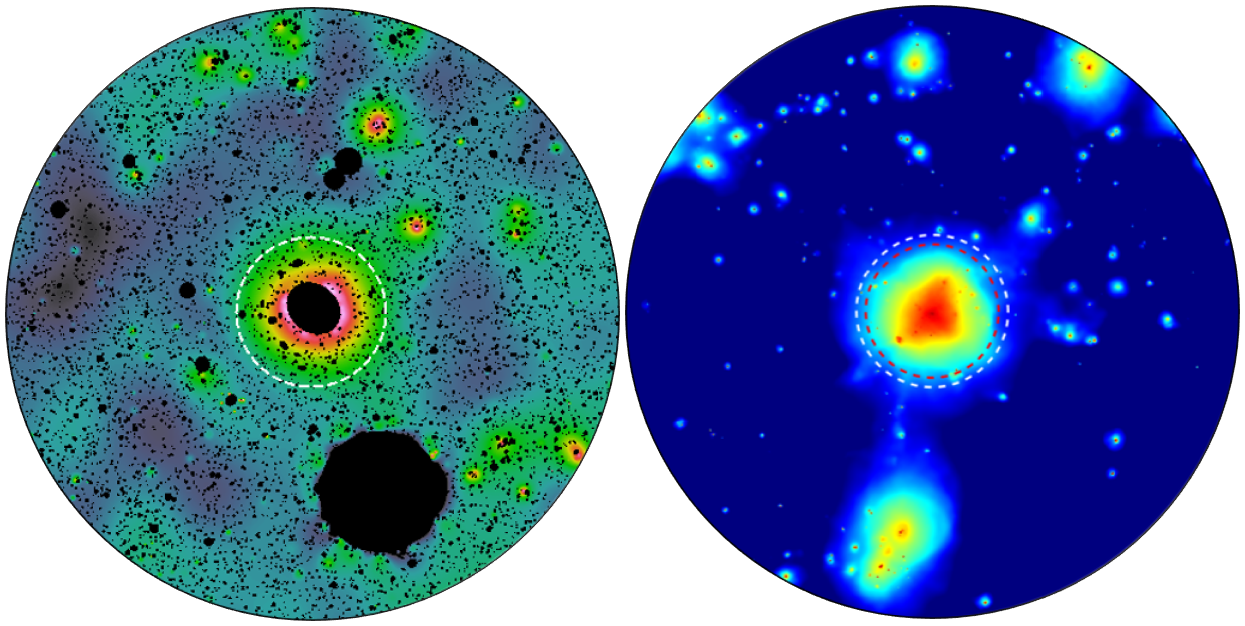
Fig 11: shows the eRASS:5 wavelet-filtered X-ray image and
Limitations
- The filament electron density estimate depends on assumed cylindrical geometry and orientation; projection effects can introduce systematic uncertainty.
- Spectral data quality limits detection of temperature asymmetry or multiphase structure within the filament and NW group; two-temperature fits were inconclusive.
- Emission contamination from nearby background / foreground clusters and residual point sources cannot be completely excluded despite excision and masking.
- Redshift uncertainties and velocity dispersions of groups complicate associating certain groups with the same supercluster structure definitively.
- Significance levels, while above 3σ, remain modest in direct filament detection, motivating deeper observations to confirm and refine gas properties.
- The cosmological simulation comparison is qualitative; no direct mock observation or statistical comparison with the data is presented.
Open questions / follow-ons
- What is the detailed three-dimensional geometry and gas-phase structure of the filament connecting A3266 and the NW group, including gas velocity and turbulence?
- How does the detected cold front in the NW group relate precisely to the ongoing cluster merger dynamics and infall processes at play in A3266?
- Can deeper or higher resolution X-ray observations reveal multiphase gas components or shock features within the filament or groups to better understand gas processing?
- How generalizable are these filament and subgroup features across other nearby massive clusters, and can surveys identify a population-level filamentary census?
Why it matters for bot defense
While the paper focuses on astrophysical large-scale structure rather than security or bot detection, its methodology offers useful analogies for practitioners building bot defense and CAPTCHA systems. The authors demonstrate how low signal-to-noise extended features (here, faint X-ray filaments) can be reliably detected and characterized by combining multi-scale filtering (wavelet transforms), spatially localized profile modeling (sector-level fits), and combined spectral and spatial analyses to isolate weak signals embedded within complex backgrounds. In bot defense, similar multi-faceted approaches integrating signal extraction from noisy, highly heterogeneous data could enhance detection of stealthy automated actors whose footprints are diffuse or weak compared to benign human behaviors. The notion of modeling and accounting for complex overlapping foregrounds (e.g., cluster plus group emission) before detecting subtle excess signals echoes the challenge of controlling false positives when legitimate users cluster in complex ways. Moreover, uncertainty quantification and significance testing (e.g., sigma levels reported here) exemplify the statistical rigor needed in security-sensitive detection systems. Thus, bot-defense engineers could adapt concepts of multi-scale denoising, spatial sector analysis, and combined spectral-spatial modeling from this astrophysical study for analogous tasks in filtering and detecting adversarial behaviors in noisy usage telemetry. However, direct applicability requires domain adaptation beyond astrophysical signals. The high-dimensionality and physics-specific modeling also highlight the importance of designing interpretable, modular detection components that reflect the structured complexity of the environment.
Cite
@article{arxiv2607_28140,
  title={ A study of the large-scale formation in the environment of A3266: Infalling groups, filaments, and a premerger cold front },
  author={ J. Dietl and A. Veronica and T. H. Reiprich and F. Pacaud and Y. Zhao and J. S. Sanders and B. Seidel and M. C. H. Yeung and K. Dolag and E. Gatuzz },
  journal={arXiv preprint arXiv:2607.28140},
  year={ 2026 },
  url={https://arxiv.org/abs/2607.28140}
}