
A Needs Assessment for Measuring Geographic - Legislative Associations in the U.S. House of Representatives
Source: arXiv:2607.21502 · Published 2026-07-23 · By Ashu Gupta, Cameron Owens, Benjamin Wilson-Langman, Max Hill, Jason Cox, Joshua Clinton et al.
TL;DR
This technical report addresses the challenge of systematically measuring the alignment—or legislative-geographic congruence—between U.S. House Representatives' roll call votes and the geographic and demographic characteristics of their constituencies. The authors introduce an approach that merges publicly available congressional voting records from the 118th House with spatial data at the congressional district level, matched by thematic categories. Each bill is manually tagged with one or more themes (e.g., veterans, agriculture), and relevant GIS datasets are linked to these themes to characterize district features potentially impacted by the legislation. A backend database infrastructure was developed to integrate bill metadata and spatial data, supporting a front-end interactive mapping system. This tool visualizes district attributes alongside legislator votes, allowing statistical comparison via box plots and t-tests to highlight differences in district characteristics between lawmakers who voted for versus against bills. The work identifies technical challenges around data fusion, ambiguous omnibus bills, and the complexity of selecting pertinent spatial indicators.
Key results include demonstrating the thematic approach for linking legislation to geography is more flexible than keyword or site-specific methods, though it requires subjective manual curation. The interactive visualization facilitates exploration of geographic-legislative associations allowing public users and researchers to better understand how votes correspond to constituent needs. The report ultimately emphasizes the importance of accurate and accessible data infrastructure and visualization tools for enhancing transparency and engagement around legislative congruence in the U.S. House.
Key findings
- Manually tagging 118th Congress bills with thematic labels enables linkage to thematic GIS datasets at the congressional district level.
- Thematic approach outperforms keyword and site-specific approaches for linking bill text to geographic data by allowing continuous variation and broader bill coverage.
- Omnibus bills (addressing multiple themes) present ambiguity in measuring vote support as they cut across diverse geographic interests.
- Ceremonial bills show near-uniform voting patterns and add little insight into geographic representation.
- County-level GIS data frequently does not align spatially with congressional district boundaries, complicating spatial data integration.
- The interactive frontend uses box-and-whisker plots and t-tests to statistically compare district-level variables between supporting and opposing legislators.
- District boundary changes and temporal mismatch between spatial data and voting periods represent significant data currency challenges.
- The data infrastructure and visualization system built can scale to other levels of government and international contexts.
Threat model
Not applicable; this work is not focused on adversarial threats or security. The adversary concept is irrelevant as the paper addresses data integration and visualization of legislative and geographic data for analysis and public understanding.
Methodology — deep read
Threat Model & Assumptions: The focus is on analyzing U.S. House legislators' voting records with publicly available data, under the assumption that constituents' district characteristics can be linked to voting behavior. Adversarial aspects or manipulations are not considered, as this is a data integration and analysis task rather than a security challenge.
Data: The authors retrieved roll call votes of bills from the 118th U.S. House of Representatives (Jan 2023 - Jan 2025) via the Congress.gov API. Each bill was manually assigned thematic tags via human-curated data dictionaries representing topics like veterans, agriculture, disaster relief, etc. Spatial data capturing relevant district-level demographic, social, economic, and environmental characteristics were sourced from publicly available government datasets in GIS formats (GeoJSON), typically aggregated to congressional district boundaries. Due to misalignment issues, some datasets aggregated at the county level required assumptions for projection to districts.
Architecture / Algorithm: A backend relational database and file system were constructed to link bill metadata (text, votes) with thematic GIS data. Each bill to theme linkage enables associating relevant district attributes to legislators' constituencies. The front-end interactive visualization combines choropleth maps of district polygons colored by theme data, alongside statistical plot elements (box-and-whisker charts) that compare the distributions of district characteristic values between legislators voting for and against a bill. A t-test is employed to evaluate if differences are statistically significant.
Training Regime: Not applicable as this is not a machine learning model, but rather a data integration and visualization prototype.
Evaluation Protocol: The system is evaluated qualitatively through demonstration using multiple bills and GIS datasets, with illustrative examples showing how district characteristics correlate with votes. Statistical tests (t-tests) are used to identify significant differences in geographic variables between supporter and opponent groups for each bill. Limitations and challenges are discussed through case study observations rather than quantitative benchmarks.
Reproducibility: Code and data linkage methods are described but no explicit public code repository or frozen model weights are mentioned. The underlying data are publicly accessible government records, including the Congress API and GIS sources. An interactive map prototype is publicly hosted for exploration at the provided DOI link.
Example End-to-End Workflow: For H.R. 3738 (Veterans’ Economic Opportunity Act), the bill was tagged as 'veterans.' Spatial data containing the percentage of veterans per district were retrieved. The database linked legislator vote records to district veteran percentages. The map showed districts colored by veteran percentage, and statistical charts compared veteran concentrations of districts represented by legislators who voted for versus against the bill. A t-test evaluated whether the difference in veteran concentration between the two groups was significant, revealing incongruence in some cases.
Overall, the methodology is an integration workflow combining manual thematic tagging, spatial data retrieval and processing, building linked backend data infrastructure, and front-end interactive visualizations enhanced with exploratory statistics to analyze geographic-legislative alignments.
Technical innovations
- Developed a thematic approach to link congressional bills to geographic district data through manual theme tagging and thematic GIS datasets, enabling continuous spatial variation analysis.
- Built a backend data infrastructure connecting bill metadata, legislator voting records, and spatial district attributes for integrated analysis.
- Designed an interactive visualization system combining choropleth maps, statistical distribution plots, and t-tests to compare district characteristics between vote supporters and opponents.
- Compared three methods (site-specific, keyword, thematic) for linking bills to geography and identified thematic as the most scalable and flexible despite subjective matching needs.
Datasets
- 118th U.S. House of Representatives roll call votes — All bills from Jan 2023 to Jan 2025 — Retrieved via Congress.gov API (public)
- Congressional district-level GIS data — Multiple thematic variables (e.g. demographics, social, economic, environmental) — Public government sources
- County-level GIS health and social data — Various indicators (e.g., infant mortality, HIV rates) — Public government sources, aggregated and approximated to districts
Figures from the paper
Figures are reproduced from the source paper for academic discussion. Original copyright: the paper authors. See arXiv:2607.21502.
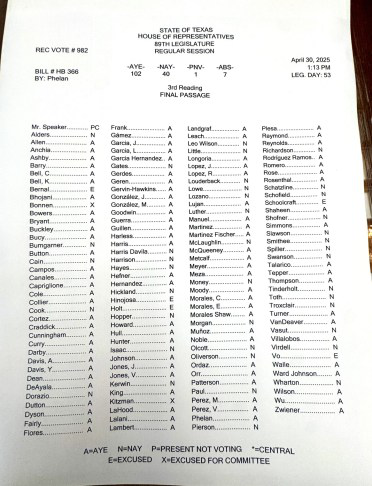
Fig 1: Legislative vote outcomes are often presented in reductive ways. Left: A sheet of papers lists
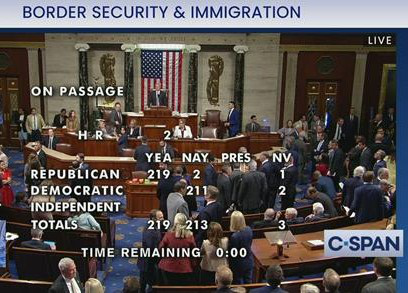
Fig 2: Visualizations from Voteview (L) and Govtrack (R), show the outcomes of US H.R.8774: On
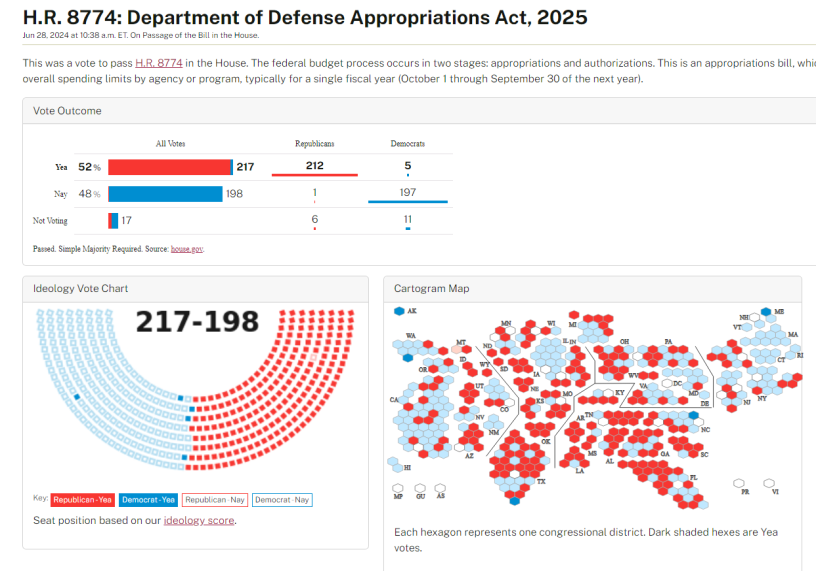
Fig 3 (page 11).
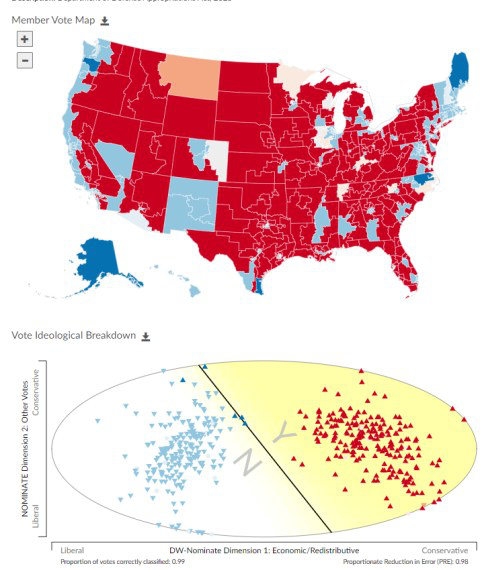
Fig 4 (page 11).
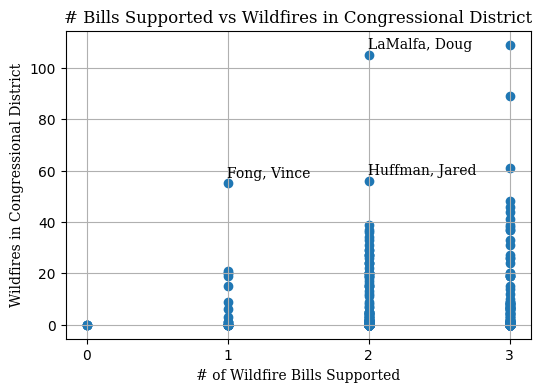
Fig 5 (page 16).
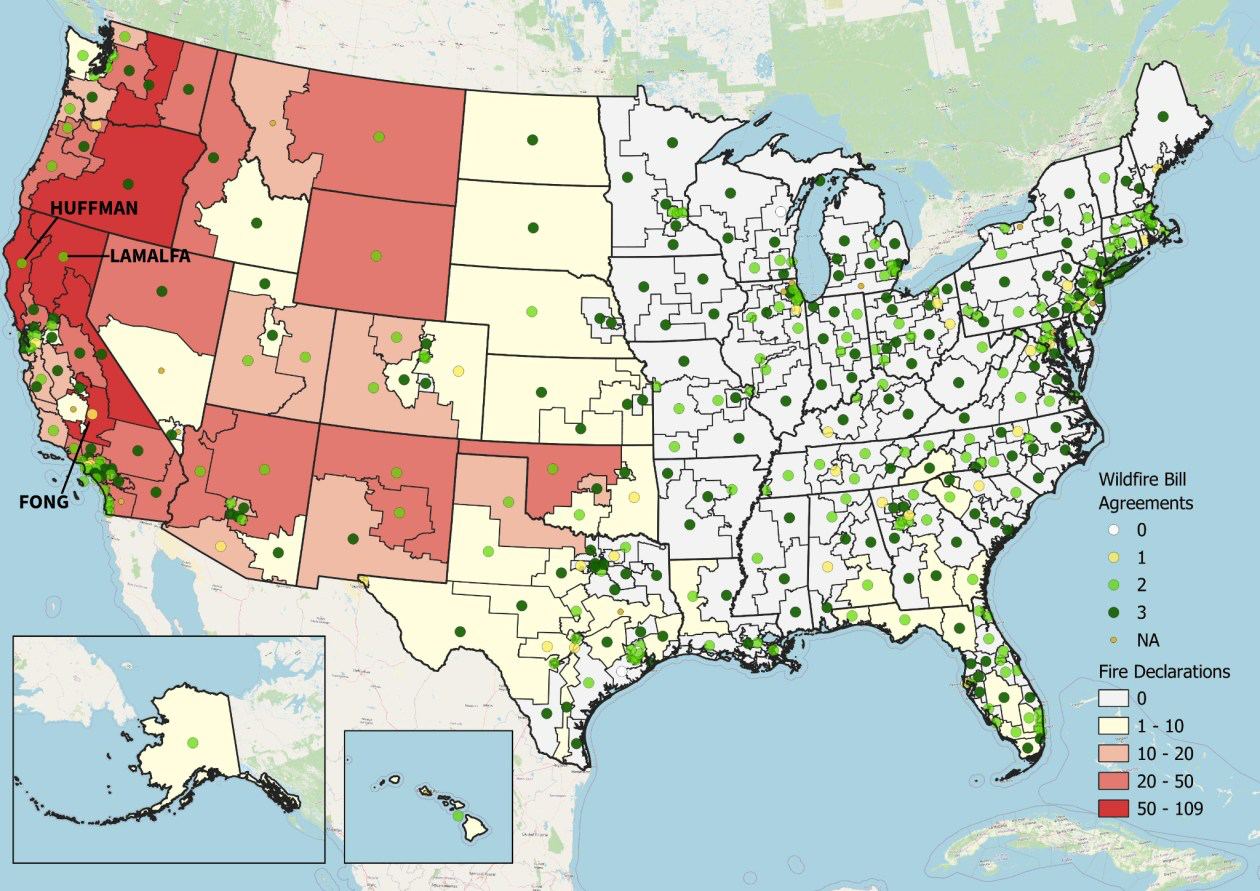
Fig 6 (page 16).
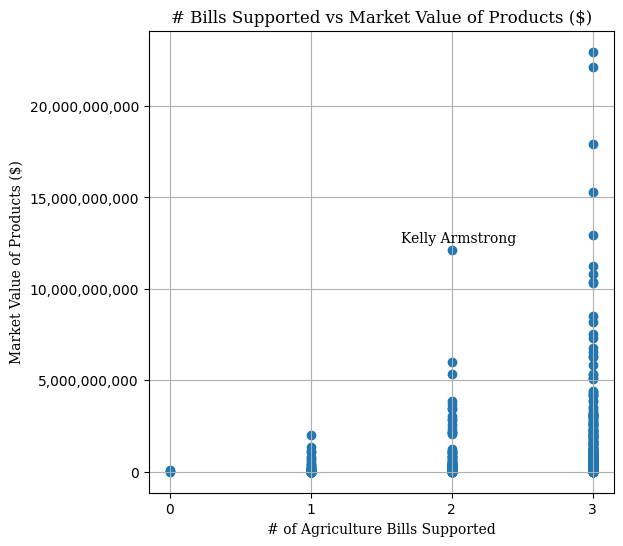
Fig 7 (page 17).
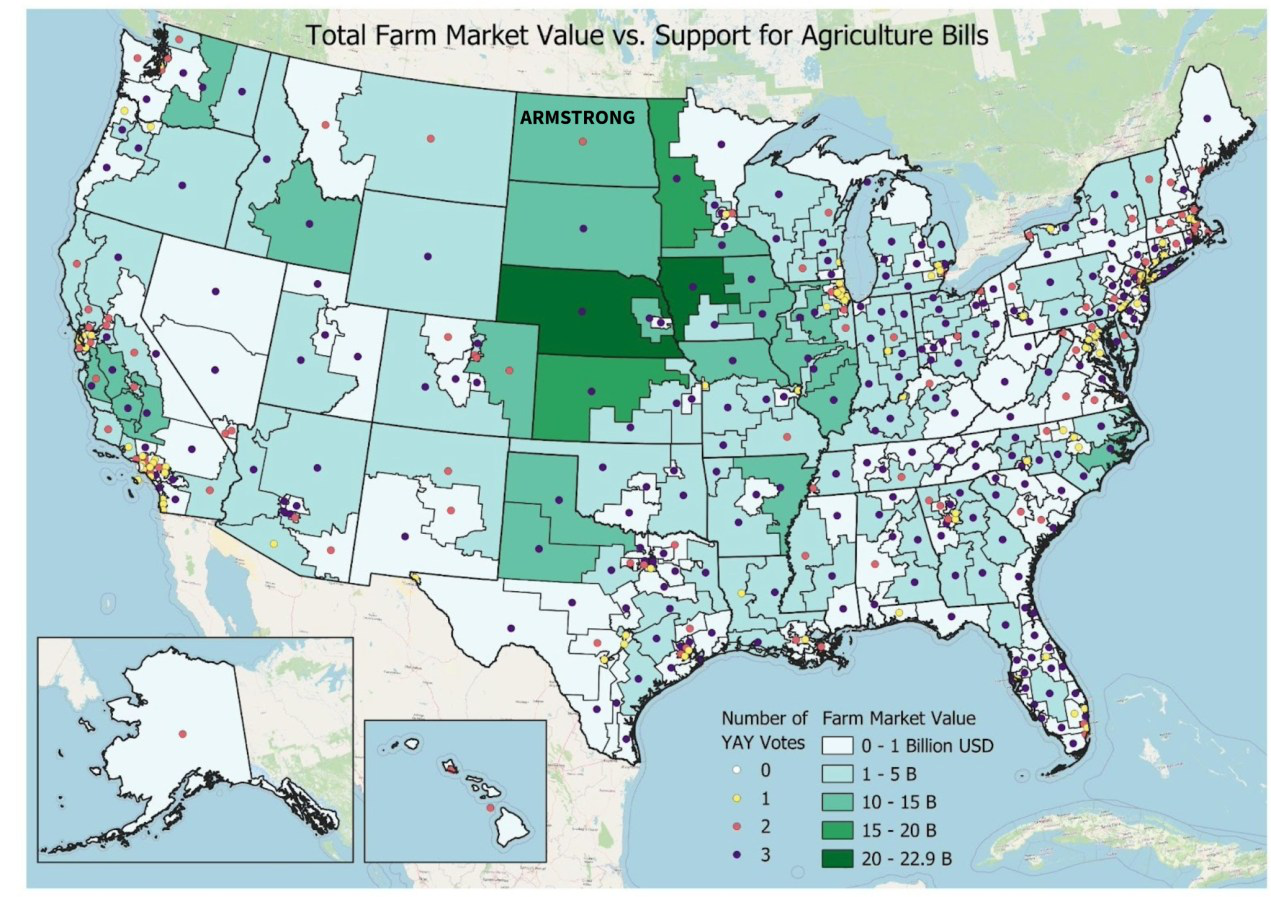
Fig 8 (page 18).
Limitations
- Manual thematic tagging introduces subjectivity and potential inconsistency in linking bills to district features.
- Omnibus bills spanning multiple themes complicate the assignment of relevant district data and interpretation of legislator support.
- Temporal mismatch between congressional district boundaries, GIS data years, and voting periods can reduce fidelity of geographic matching.
- County-level data often does not spatially align with congressional districts, limiting accuracy when projected onto districts.
- No formal user testing or quantitative validation of the visualization tool’s effectiveness is reported.
- System currently limited to the U.S. House and the 118th Congress; generalizability to other chambers or time periods not yet demonstrated.
Open questions / follow-ons
- How to automate or semi-automate thematic tagging of bills to reduce human subjectivity and improve scalability?
- How to effectively handle omnibus bills covering multiple unrelated themes in measuring geographic-legislative congruence?
- What methods can better align or reconcile temporal differences between GIS data, district boundary changes, and voting records?
- How can this framework be extended beyond the House of Representatives to Senate, state legislatures, or international legislative bodies?
Why it matters for bot defense
While this report does not address bot defense or CAPTCHA directly, its contributions in integrating heterogeneous legislative and geographic data with interactive visual analytics have indirect relevance to bot-defense data scientists handling multi-modal and spatiotemporal data. The work exemplifies challenges of merging diverse data sources, managing ambiguous thematic labels, and enabling user-centric exploratory interfaces—skills applicable in interpreting behavior across complex feature spaces such as those encountered in bot detection and behavioral analysis. Furthermore, the statistical comparison methods and visualization techniques may inspire analogous approaches for analyzing geographic or thematic patterns in automated traffic or user behavior relevant to CAPTCHA evaluation and bot mitigation research.
Cite
@article{arxiv2607_21502,
  title={ A Needs Assessment for Measuring Geographic - Legislative Associations in the U.S. House of Representatives },
  author={ Ashu Gupta and Cameron Owens and Benjamin Wilson-Langman and Max Hill and Jason Cox and Joshua Clinton and Clio Andris },
  journal={arXiv preprint arXiv:2607.21502},
  year={ 2026 },
  url={https://arxiv.org/abs/2607.21502}
}