
Benchmarking Generalization in Financial Statement Fraud Detection: robust evaluation and novel tasks
Source: arXiv:2607.19259 · Published 2026-07-21 · By Guy Stephane Waffo Dzuyo, Gaël Guibon, Christophe Cerisara, Luis Belmar-Letelier
TL;DR
This paper addresses critical shortcomings in financial statement fraud detection (FSFD), specifically the lack of realistic generalization evaluation and underutilization of textual data from financial reports. Prior work often relies on random train-test splits that cause data leakage and inflate performance by exposing models to company-identifiable patterns. To tackle this, the authors propose a novel Company-Isolated FSFD (CI-FSFD) benchmark task that enforces company-level split isolation, closely mimicking real-world deployment where fraud must be detected in entirely unseen firms. They develop a multimodal dataset combining structured quarterly financial indicators, summarized MD&A textual data using a large language model (Qwen3 32B), and rigorously verified fraud labels derived from SEC Accounting and Auditing Enforcement Releases (AAER). Using foundation LLMs fine-tuned with Low-Rank Adaptation, they demonstrate that models leveraging the textual MD&A alone outperform those using only structured data or naive combinations. Classic random split evaluations show near-perfect results (AUC ~0.96), but under the CI-FSFD setting all methods drop substantially, highlighting the overoptimism of prior evaluations and validating the need for the new benchmark. The domain-specific Fino1-8B LLM fine-tuned on summarized text achieves the highest CI-FSFD AUC of 0.74, outperforming strong classical baselines like XGBoost (0.70) on financials. This work establishes that robust company-isolated evaluation and leveraging textual narratives with LLMs are critical to advancing practical fraud detection.
Key findings
- Random train-test splits cause data leakage—each fraudulent company appears in 3.35 folds on average—leading to inflated AUC of 0.96 for Llama-3.1 8B, disproving prior generalization claims.
- The proposed CI-FSFD task enforces strict company isolation, causing performance drops across the board; e.g., XGBoost falls from 0.96 AUC (classic) to 0.66 (CI-FSFD) (p=0.000).
- A domain-specific LLM (Fino1-8B) fine-tuned on summarized MD&A text achieves highest CI-FSFD AUC of 0.74 and F1 of 0.18, outperforming both structured-only (AUC 0.69) and combined FIN+SMD&A inputs (AUC 0.72).
- Naively concatenating financial features and summarized MD&A text (FIN+SMD&A) underperforms compared to text-only input, indicating a 'textual noise bottleneck' requiring more sophisticated fusion architectures.
- Severe class imbalance (originally 0.03% fraud) was handled by downsampling to 5% fraud for stable training; model F1 scores remain low (max 0.18), reflecting the difficulty of generalized fraud detection beyond company identity leakage.
- Zero-shot performance of pretrained LLMs without fine-tuning is poor (AUC ~0.50), confirming the necessity of domain-specific fine-tuning for FSFD.
- Fine-grained misstatement-type analysis reveals variation in detectability: Revenue misstatements achieve AUC 0.71 while Asset Valuation misstatements are harder with AUC 0.54.
- Explainability via AttnLRP highlights which SMD&A sentences contribute most to fraud predictions, providing interpretability clues though not full explanations.
Threat model
The adversary is a fraudulent company seeking to misreport or manipulate financial statements to deceive investors or regulators. They control the content of both structured financial metrics and unstructured narrative textual disclosures embedded in quarterly reports. The defender aims to detect fraud across diverse firms, including previously unseen companies, without relying on memorizing firm-specific patterns. The adversary cannot retroactively alter historical data once the report is finalized, but may exploit sophisticated, subtle misstatements embedded in reports. The detection model must generalize temporally and cross-company to succeed.
Methodology — deep read
The threat model assumes an adversary attempting to commit financial statement fraud via earnings misstatements and accounting manipulations, which manifest in both numeric financial reports and textual narratives. The detector must generalize to unseen companies and time periods without exploiting company-specific patterns.
Dataset construction combines three main sources: quarterly Forms 10-Q financial statements (2009-2024) processed into 122 engineered financial features (ratios, raw values, changes), approximately 195,000 MD&A text sections summarized using the large open-source Qwen3 32B model into more tractable ~3,800 token summaries, and fraud labels derived from 3,300 SEC AAER enforcement releases. Fraud labels are linked precisely to fiscal quarters by a two-stage pipeline: automated LLM extraction followed by expert manual verification yielding 1,451 verified firm-quarter fraudulent samples. After merging and downsampling to a stable 5% fraud class, the final dataset contains 10,159 samples from 2000-2022 with preserved industry/time distributions.
They define two tasks: Classic FSFD with random splits at the observation level, and CI-FSFD enforcing company-level isolation so no firm’s data appears in both train and test splits.
For model architecture, they fine-tune two 8B-parameter LLMs: the domain-specific Fino1-8B and general Llama-3.1 8B. Input consists of either (a) serialized 122 financial feature strings (FIN), (b) summarized MD&A text (SMD&A), or (c) concatenation of both (FIN+SMD&A). Fine-tuning uses LoRA adapters on all linear layers with 4-bit quantization to reduce memory footprint. The classification head is trained not by standard autoregressive token prediction, but to classify the final token as YES/NO for fraud. Epoch-level undersampling balances batches to equal fraud/non-fraud samples. Bayesian and grid search optimize hyperparameters of baseline models.
Evaluation uses 5-fold cross-validation maintaining industry and temporal distributions. CI-FSFD folds isolate companies strictly, with metrics including ROC AUC, precision, recall, and F1-score. Model checkpoints are selected by highest AUC on 10% validation splits, with threshold calibration for decision maximizing F1. Statistical significance is assessed with bootstrap paired tests with 5,000 iterations.
Baseline comparisons include classic logistic regression (Dechow et al. 2011), MLP, Random Forest, LightGBM, XGBoost, and an adapted RCMA model that replaces legacy Doc2Vec+LSTM text encoders with modern Sentence-BERT embeddings fine-tuned with LoRA.
A concrete example: The input to the LLM is a prompt concatenating a firm-quarter’s serialized financial features (e.g. “Total Revenue: 123456...”) with the Qwen3-generated summarized MD&A. The LLM predicts a YES/NO token for fraud. Training dynamically undersamples the abundant non-fraud examples at each epoch to stabilize gradient updates. During CI-FSFD evaluation, firms in test splits never appear in training, ensuring zero company identity leakage. This setup exposes overfitting in prior random split experiments.
The authors published the assembled dataset and code publicly (link in the paper), enabling reproducibility. The dataset merges heterogeneous SEC formats and manually verified labels, a key resource for FSFD research.
Technical innovations
- Introduction of the Company-Isolated FSFD (CI-FSFD) benchmark task enforcing strict company-level train-test separation to realistically evaluate generalization.
- Construction of a large multimodal FSFD dataset integrating structured quarterly financial features, LLM-summarized MD&A text, and manually verified AAER fraud labels.
- A novel LLM-based fraud detection framework using fine-tuned domain-specific LLMs on concatenated serialized numeric features and summarized textual narratives, specialized for binary fraud classification.
- Demonstration of the superiority of textual MD&A summaries alone over structured financial data or naive combination, revealing a textual noise bottleneck and the need for improved multimodal fusion methods.
- Detailed fine-grained fraud misstatement-type performance analysis using 12 fraud subcategories derived from AAER labels to understand domain-specific detection challenges.
Datasets
- U.S. Financial Statement Fraud Dataset — 10,159 firm-quarter samples (511 fraud, 9,648 non-fraud) — constructed from SEC 10-Q financial statements, 195,023 MD&A quarterly texts summarized by Qwen3 32B, and 1,451 manually verified fraud labels from SEC AAER releases
Baselines vs proposed
- LR-DECHOW (financial features): Classic FSFD AUC = 0.68 ± 0.027 vs CI-FSFD AUC = 0.67 ± 0.04 (p=0.000, -0.074 drop)
- MLP (financial features): Classic FSFD AUC = 0.89 ± 0.01 vs CI-FSFD AUC = 0.69 ± 0.06 (p=0.000, -0.058 drop)
- LightGBM (financial features): Classic FSFD AUC = 0.95 ± 0.01 vs CI-FSFD AUC = 0.68 ± 0.01 (p=0.000, -0.085 drop)
- XGBoost (financial features): Classic FSFD AUC = 0.96 ± 0.01 vs CI-FSFD AUC = 0.66 ± 0.04 (p=0.000, -0.080 drop)
- Random Forest (financial features): Classic FSFD AUC = 0.92 ± 0.01 vs CI-FSFD AUC = 0.70 ± 0.03 (p=0.000, -0.042 drop)
- RCMA-adapted (combined FIN+SMD&A): Classic FSFD AUC = 0.89 ± 0.008 vs CI-FSFD AUC = 0.65 ± 0.00 (p=0.000, -0.134 drop)
- Fino1 8B (SMD&A text only): Classic FSFD AUC = 0.95 ± 0.0178 vs CI-FSFD AUC = 0.74 ± 0.03 (top performer, reference)
- Fino1 8B (financial only): Classic FSFD AUC = 0.90 ± 0.02 vs CI-FSFD AUC = 0.69 ± 0.04
- Fino1 8B (combined FIN+SMD&A): Classic FSFD AUC = 0.94 ± 0.009 vs CI-FSFD AUC = 0.72 ± 0.01
- Llama-3.1 8B (SMD&A text only): Classic FSFD AUC = 0.96 ± 0.018 vs CI-FSFD AUC = 0.68 ± 0.04
Figures from the paper
Figures are reproduced from the source paper for academic discussion. Original copyright: the paper authors. See arXiv:2607.19259.
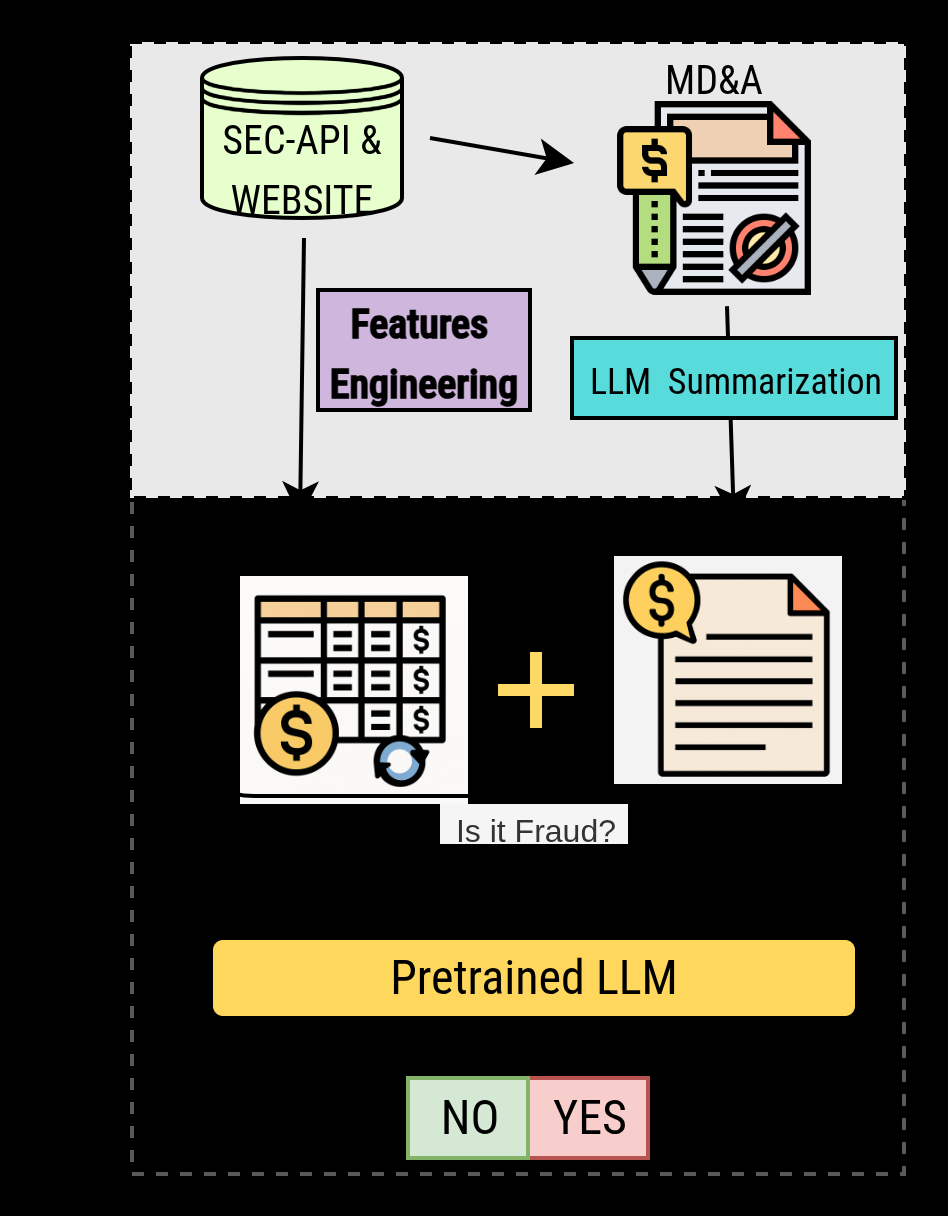
Fig 1: Financial Statement Fraud Classification.
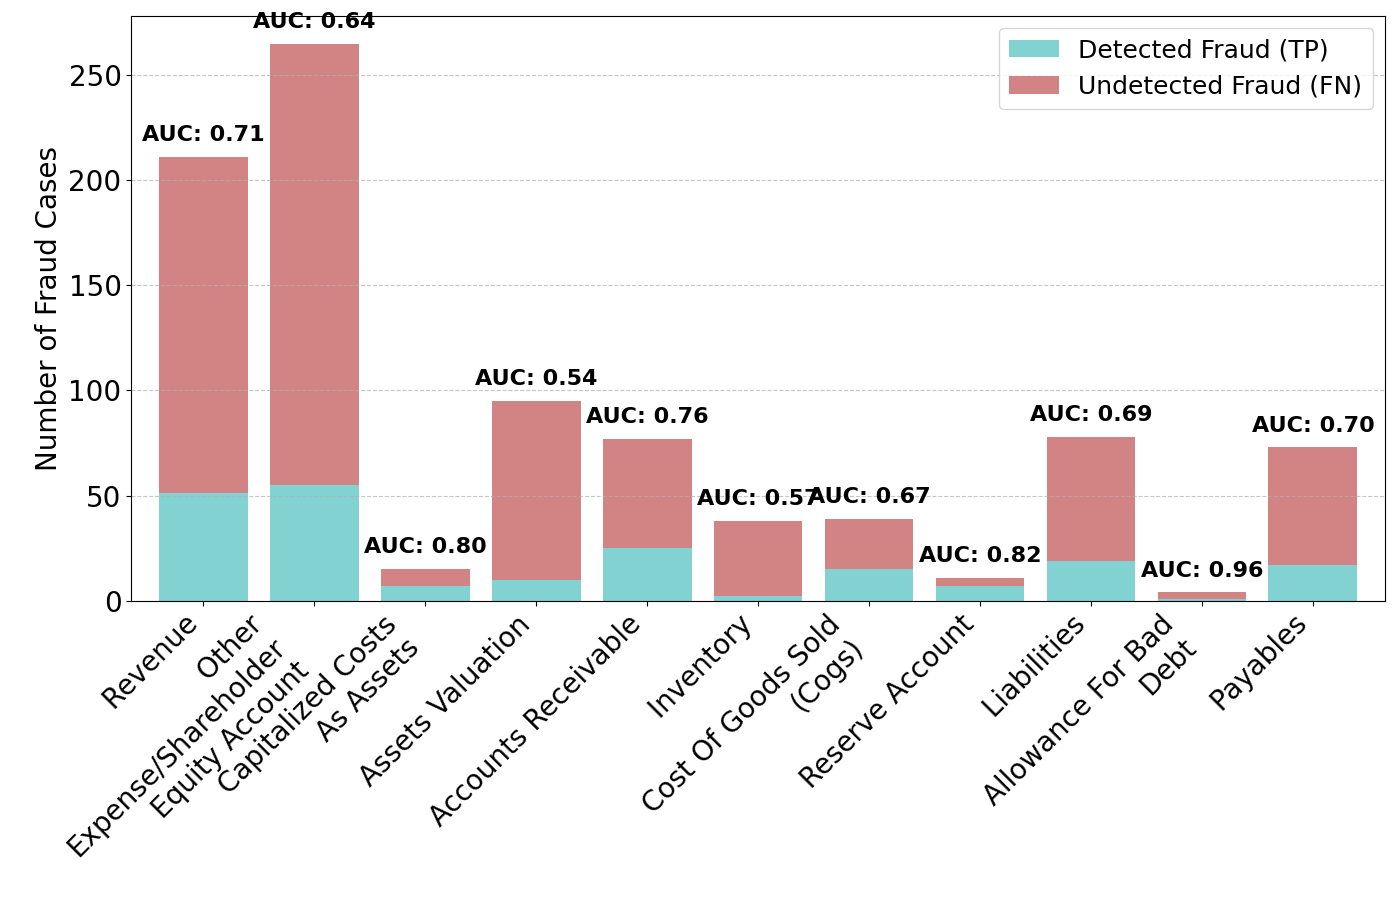
Fig 2: Detection Performance per Misstatement type on the CI-
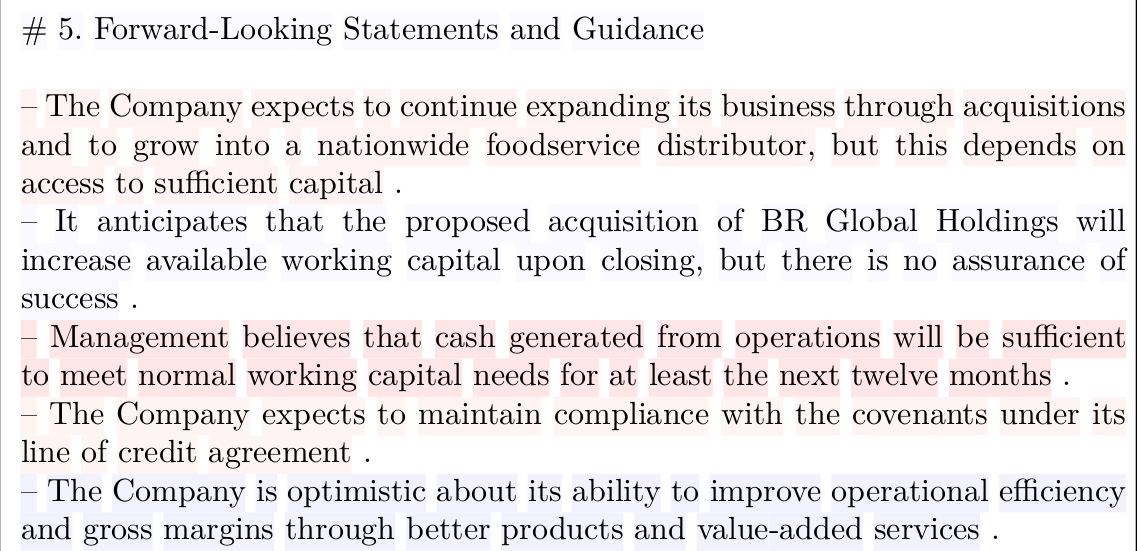
Fig 3: Attn-LRP sentence-level relevancy. Red highlights mean
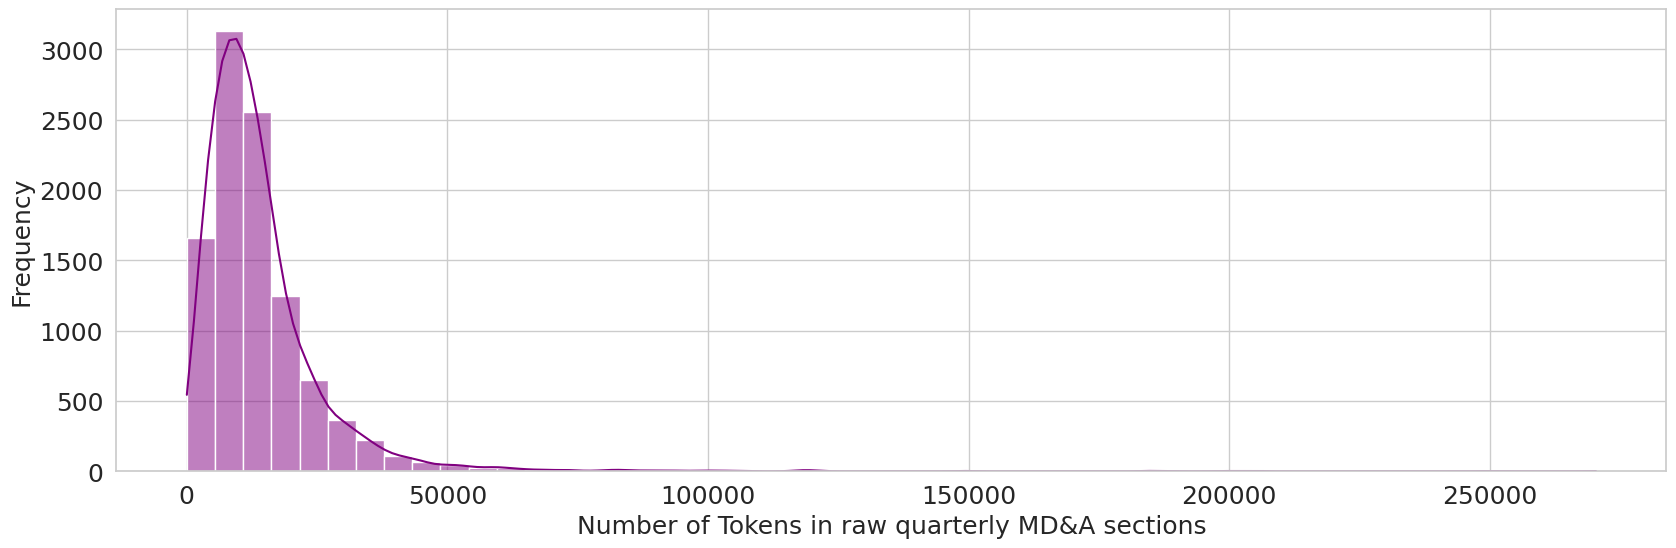
Fig 5: Distribution of token counts in raw quarterly MD&A sections. The x-axis represents the number of tokens, and the y-axis represents
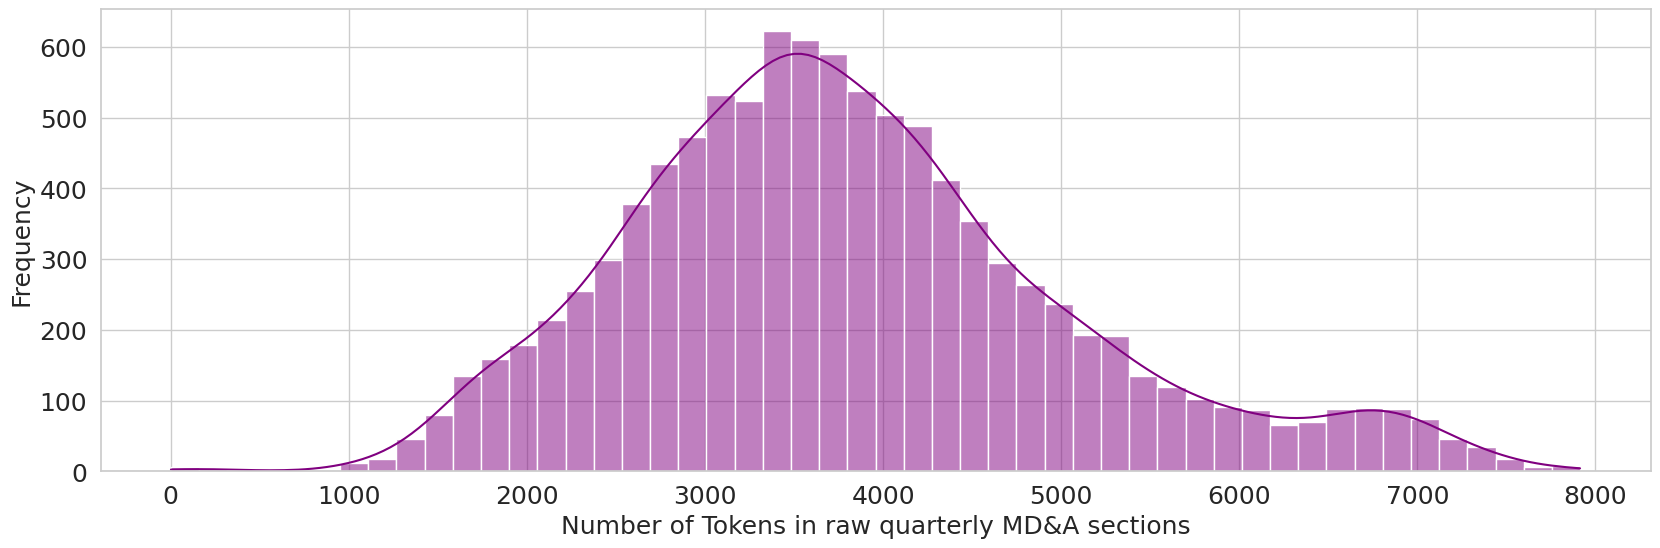
Fig 6: illustrates the token count distribution for the SMD&A sections. As intended, these summaries are substantially shorter
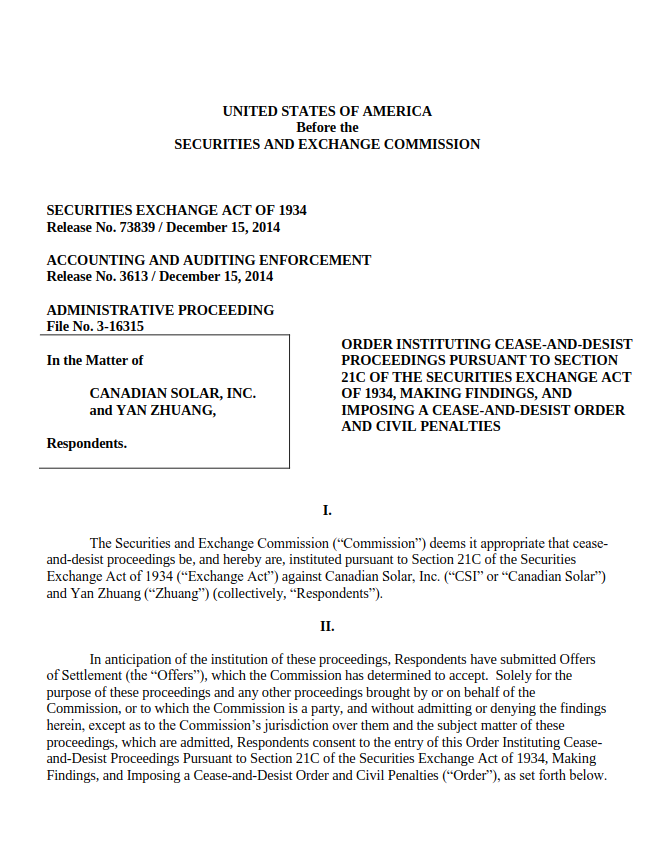
Fig 7: Example first page of a primary document linked from an AAER release.
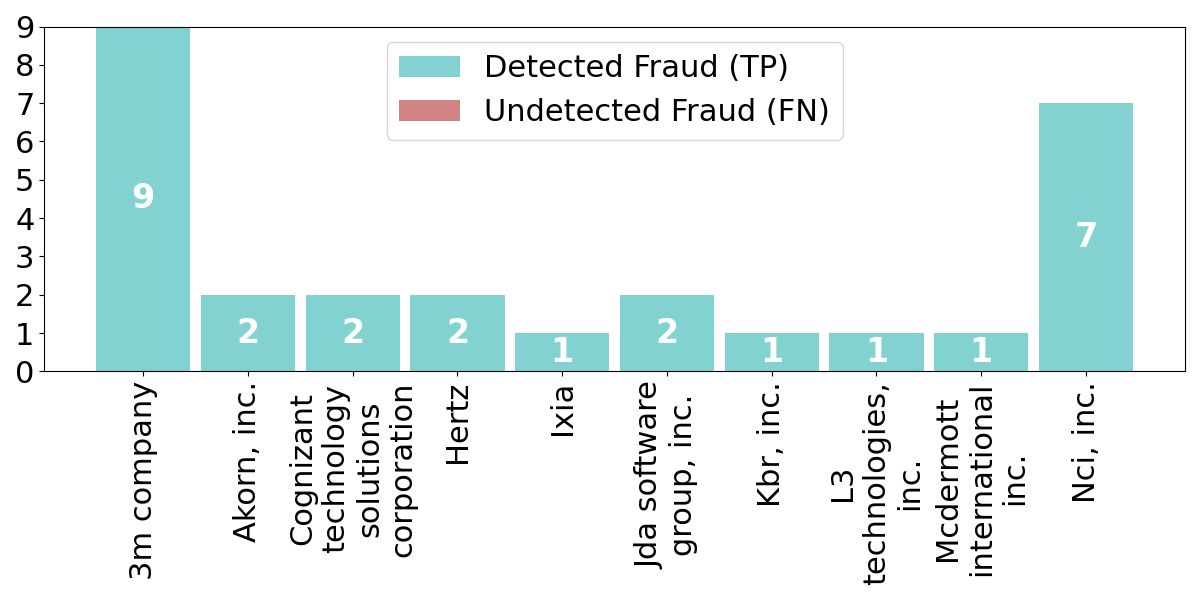
Fig 10: Plot: Top 10 companies by number of correctly detected fraudulent quarters (True Positives vs False Negatives) in the CI-FSFD
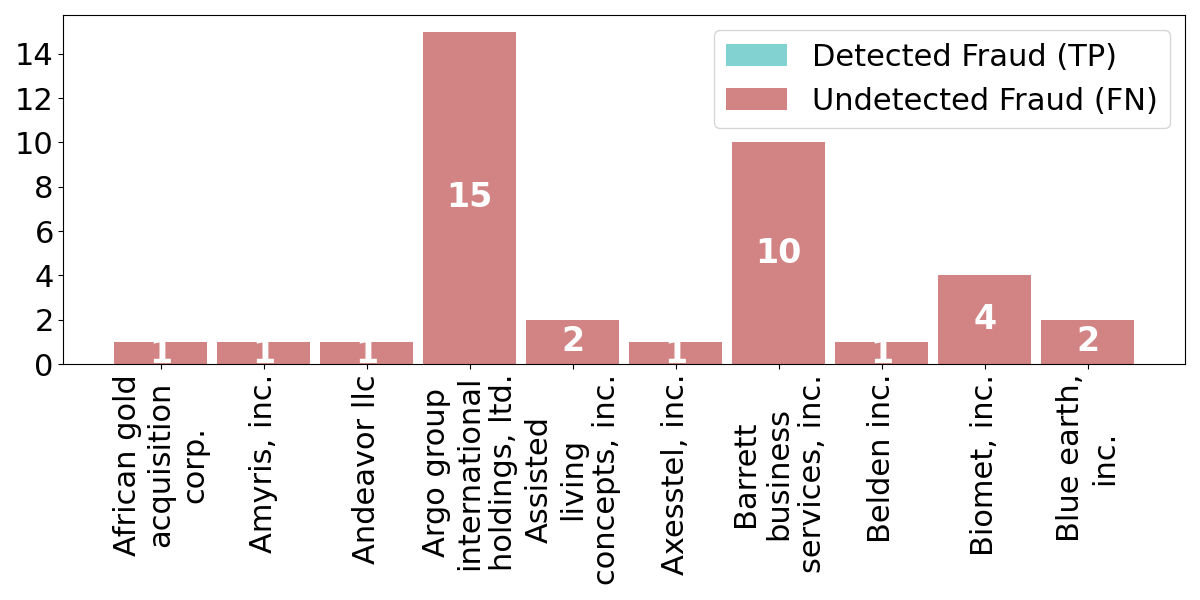
Fig 11: Plot: Top 10 companies by number of undetected fraudulent quarters (True Positives vs False Negatives) in the CI-FSFD task.
Limitations
- The best CI-FSFD model achieves a low F1 score (~0.18), reflecting the extreme difficulty of cross-company generalization in fraud detection beyond identity leakage.
- CI-FSFD enforces company-based partitioning but does not strictly impose chronological (rolling window) splits to prevent temporal leakage, which would better simulate true forward-looking deployment.
- The study focuses exclusively on U.S. SEC data; external validation on international or multi-jurisdictional datasets (e.g., China’s CSMARD) is needed for global generalizability.
- Summarizing MD&A texts may filter out subtle linguistic or stylistic fraud signals, relying principally on factual disclosures; hybrid models that incorporate original raw text could capture a broader fraud signal spectrum.
- The fusion method for combining numeric and text features is a simple serial concatenation; more advanced multimodal fusion mechanisms might mitigate the identified textual noise bottleneck and improve combined input results.
- Zero-shot LLM performance is very poor, so effectiveness depends critically on fine-tuning which requires labeled fraud data and computational resources.
Open questions / follow-ons
- How can multimodal fusion architectures be improved beyond naive concatenation to better integrate structured financial data and textual narratives?
- What are effective methods to incorporate stylistic and linguistic fraud signals potentially lost during MD&A text summarization?
- How does enforcing both company isolation and strict temporal/future-forward splits impact model generalization and prevent all types of information leakage?
- Can the approach and benchmarks generalize to international financial regulations and datasets with different reporting structures and fraud definitions?
Why it matters for bot defense
From a bot-defense or CAPTCHAs perspective, this paper’s insights into robust evaluation under strict identity isolation provide a cautionary example of preventing learned overfitting and data leakage. Similar to how random splits overestimate generalization in FSFD, heuristic or naive CAPTCHAs might be vulnerable if adversaries can exploit identity or session patterns. The work also illustrates the power of leveraging multimodal, rich data (numerical plus free-text narratives) and advanced large language models for subtle anomaly detection tasks, which parallels efforts in bot detection using behavioral and textual cues. Moreover, their pipeline for precise label alignment and manual verification highlights the critical need for high-quality, verified ground truth in adversarial detection benchmarks. Practitioners should consider analogous principles when designing robust CAPTCHA challenges that require generalization to unseen users or attack styles and that integrate diverse behavioral signals beyond simplistic token puzzles.
Cite
@article{arxiv2607_19259,
  title={ Benchmarking Generalization in Financial Statement Fraud Detection: robust evaluation and novel tasks },
  author={ Guy Stephane Waffo Dzuyo and Gaël Guibon and Christophe Cerisara and Luis Belmar-Letelier },
  journal={arXiv preprint arXiv:2607.19259},
  year={ 2026 },
  url={https://arxiv.org/abs/2607.19259}
}