
Practical Framework for Power System Strength
Source: arXiv:2607.13970 · Published 2026-07-15 · By Ignacio Ponce, Federico Milano
TL;DR
This paper addresses practical challenges in applying a recently proposed unified analytical framework for assessing power system strength, which quantifies the ability of the system to resist voltage and frequency changes. The original theoretical formulation provided exact analytical solutions but was computationally complex and dependent on detailed post-disturbance system information, limiting practical use. The authors develop simplified, approximate expressions for network-wide bus-level strength metrics that depend only on pre-disturbance operating points, reducing computational burden and data requirements. They also introduce normalized device-level strength metrics to enable equipment-specific strength comparisons across different systems and conditions. Further, a novel dynamic strength source model is proposed to systematically vary strength conditions and study device behavior under different strength scenarios. The framework is validated on a detailed dynamic model of the All-Island Irish power system, illustrating the spatial distribution of strength metrics across 2080 buses, analyzing device-level strength ratios, and demonstrating a strength-based hosting capacity assessment. Dynamic simulations confirm that devices’ dynamic performance degrades below identified strength thresholds, validating the practical utility of the metrics for real-world engineering applications.
Key findings
- Simplified strength metrics (eqs. 17-20) remove dependency on post-disturbance variables, enabling practical computation from pre-disturbance states.
- Zero-, first-, and second-order strength indicators collectively quantify bus voltage sensitivity to current injections, capturing magnitude, phase, frequency, and rate-of-change dynamics.
- All first-order strength metrics were zero in the All-Island Irish system, indicating continuous complex frequency behavior due to no devices with non-null a' component present.
- Zero-order bus-level strength metrics ranged broadly from 0.01 to 2.0 pu−1 (base 100 MVA), with higher voltage buses generally stronger.
- Second-order strength metrics exhibited narrower ranges and more spatial homogeneity across voltage levels.
- Device-level strength ratios normalize bus-level metrics by device rated currents, revealing wind farms have lowest zero-order strength ratios (e.g., minimum SRvıq = 6.32), and some synchronous units have low second-order strength ratios (e.g., SRγıp = 0.17).
- Dynamic simulations show converter performance rapidly degrades below strength ratio ~2.0, with fault ride-through failure at SRvıq=1.80 for WF Knockacummer wind farm (Fig. 11).
- Strength-based hosting capacity assessment predicts maximum deployable device sizes per bus; e.g., certain HV substations show hosting capacities ranging up to 640 MVA for a tested converter (Fig. 12).
- Spatial strength metric maps highlight weaker areas in low-meshed or high renewable penetration regions, consistent with known grid characteristics.
Threat model
n/a — This work is focused on power system dynamic analysis and strength assessment under physical disturbances, not security or adversarial threat modeling.
Methodology — deep read
Threat Model & Assumptions: The adversary model is not security-focused, rather the framework assumes normal grid operating conditions with disturbances modeled as current injection perturbations at buses. No adversarial actions are considered, but it addresses system behavior under sudden perturbations (three-phase faults).
Data: The study uses a large-scale dynamic model of the All-Island Irish power system (2080 buses, 1176 lines), with summer peak demand scenario (5,740 MW) and 32% non-synchronous penetration. Dynamic device models are adopted from PSS/E libraries, with synchronous generators, loads, and grid-following converters represented. The model and scenario replicate realistic topology and operating conditions, though the results are illustrative, not operational assessments.
Architecture / Algorithm: The core analytical framework defines twelve power system strength metrics per bus spanning three dynamical orders (zero-, first-, and second-order) related to sensitivity of voltage magnitude, phase angle, frequency, and RoCoF to changes in current injections. These metrics are mathematically derived using the complex frequency concept and represented as matrices dependent on network impedance and device-specific strength components (a, a', a'', b', b'', c''). Device contributions are modeled as current injections with perturbations linked to voltage and its derivatives via these strength components. Exact solutions require pre-and post-disturbance values, but practical implementations approximate post-disturbance variables as equal to pre-disturbance. A novel dynamic "strength source" model—an external equivalent network parameterized by the twelve strength metrics—is introduced as a second-order linear system to emulate arbitrary strength conditions for device-testing.
Training Regime: Not applicable; the framework is analytical and model-based rather than learned.
Evaluation Protocol: Metrics are computed across the entire Irish system. Bus-level strength distributions are analyzed by voltage level. Dynamic time-domain simulations test device response (e.g., grid-following converter models based on WECC/EPRI renewable energy models) to short-circuit faults under varied strength ratios imposed by the strength source, evaluating terminal voltage, injected power, and frequency trajectories. Hosting capacity is estimated by combining device minimum acceptable strength ratios with bus strength metrics.
Reproducibility: The method is described in detail with explicit equations and examples. The Irish system model is publicly referenced but customized for this study. Software implementation is done in Dome (Python-based). No explicit code release or frozen weights are mentioned, implying reproduction would require reimplementation based on documented formulations and public models.
Technical innovations
- Derivation of simplified power system strength metrics that remove reliance on unknown post-disturbance variables, enabling computationally efficient and practical strength assessment.
- Definition of novel normalized, ratio-like device-level strength metrics that allow comparison of strength across different devices, systems, and operating conditions.
- Introduction of a dynamic strength source model—a second-order linear dynamic system—that can emulate any prescribed set of zero-, first-, and second-order strength conditions at a bus, enabling controlled strength variation for device testing.
- Unified framework integrating voltage magnitude and frequency strength metrics within a single mathematical formulation based on complex frequency, capturing coupled dynamics traditionally assessed separately.
Datasets
- All-Island Irish Power System model — 2080 buses, 1176 lines — adapted from Irish TSOs All-Island Transmission Forecast Statement 2022
Baselines vs proposed
- Baseline: Exact analytical solutions requiring post-disturbance variables; Simplified solution (this work): approximates post-disturbance values by pre-disturbance values, greatly reducing complexity and data requirements with minor under/overestimation in strength metrics.
- WECC/EPRI Grid-Following Converter model performance at strength ratio SRvıq=6.50 (nominal) vs deteriorated SRvıq=1.20: system voltage and frequency stability degraded; at SRvıq=1.80 device collapses during fault ride-through (Fig. 11).
- Bus-level zero-order strength range for HV buses: baseline short-circuit level metric approximately 0.01 pu−1 to 0.3 pu−1, comparable to proposed strength metric Svıq range from 0.01 to 0.3 pu−1 (Fig. 4,6).
- Device-level strength ratio SRvıq for WF Knockacummer: minimum observed 6.32 vs device stability degrading below ~2.0 threshold.
Figures from the paper
Figures are reproduced from the source paper for academic discussion. Original copyright: the paper authors. See arXiv:2607.13970.
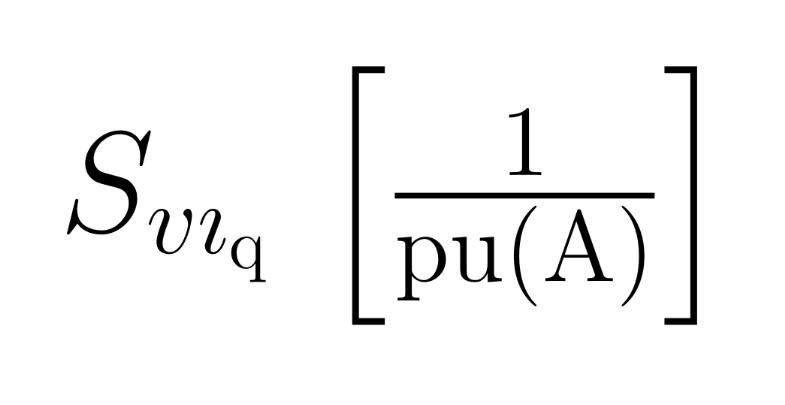
Fig 5: Second-order strength metric results.

Fig 6: depicts the results for the zero-order metric Svıq.
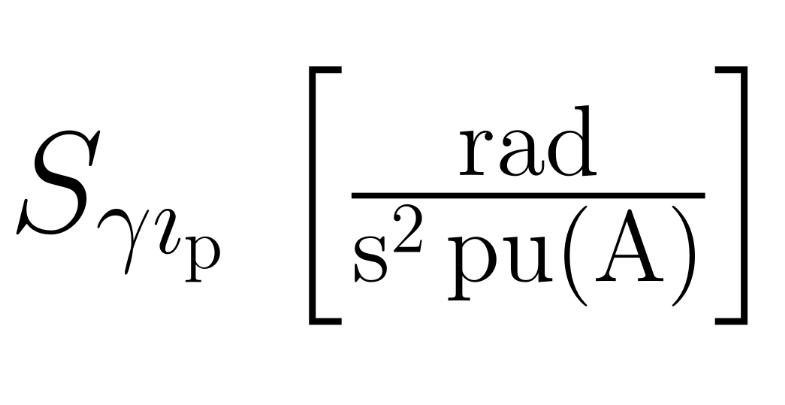
Fig 7: depicts the results for the second-order metric Sγıp.
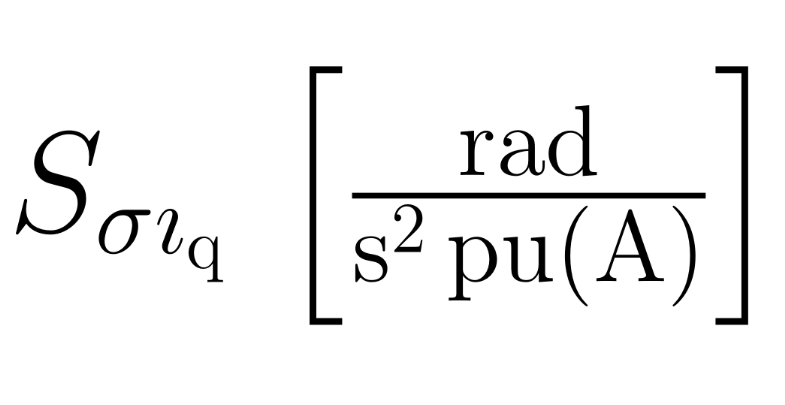
Fig 8: All-Island Irish power system results for strength metric Sσıq.

Fig 11: Trajectories of the terminal voltage (left panel) and active power
Limitations
- The assumption that post-disturbance variables equal pre-disturbance (x+ ≈ x−) introduces approximation errors, potentially under- or over-estimating strength especially during large disturbances.
- The Irish system model and operating scenario represent a single snapshot (summer peak) and do not capture seasonal, operational, or structural variability.
- Device strength components require accurate modeling of underlying device DAEs, which may be complex or unavailable for some modern power electronics.
- First-order strength metrics are zero throughout the Irish system due to lack of devices with non-null a′ component; thus, framework’s capability to assess such dynamics awaits validation in future systems with other device types.
- Dynamic strength assessments are limited to linearized second-order models and three-phase faults; nonlinearities, long-term dynamic phenomena, and other fault types remain to be explored.
- This framework does not incorporate explicit stability margin quantification or probabilistic risk assessment; strength is related but not equivalent to stability.
Open questions / follow-ons
- How do strength metrics and device-level strength requirements evolve under extreme contingencies, varying renewables penetration, and high inverter-based resource scenarios?
- Can the strength source model be extended to encompass nonlinear or more detailed device behaviors to better emulate real power system dynamics?
- What is the relationship between strength metrics and real stability margins in different grid topologies and with emerging grid-forming inverter technologies?
- How can strength metrics be incorporated into real-time monitoring and control systems for adaptive grid operation and protection?
Why it matters for bot defense
While this paper is not directly related to bot defense or CAPTCHA technology, it presents a rigorous framework for quantifying power system strength that could be analogous to robustness metrics in other domains. For bot-defense engineers, the paper models a complex system's resilience to perturbations using multi-order metrics and normalized device-level ratios. This layered approach to defining and measuring system strength may inspire analogous multi-scale, normalized metrics in defense systems against automated attacks. Moreover, the introduction of a "strength source" model to systematically vary environmental conditions for device testing parallels the idea of creating controlled adversarial environments in security research. However, electrical grid strength assessment uses domain-specific physical models and assumptions distinct from CAPTCHA challenges or bot detection. Still, the general methodology of developing simplified, interpretable metrics to characterize system vulnerability and performance under attack-like disturbances is a conceptual takeaway. Bot-defense practitioners might appreciate the structured, analytical approach to defining strength, the use of normalized ratios to relate intrinsic system properties to device-level requirements, and the emphasis on practical implementability rather than purely theoretical constructs.
Cite
@article{arxiv2607_13970,
  title={ Practical Framework for Power System Strength },
  author={ Ignacio Ponce and Federico Milano },
  journal={arXiv preprint arXiv:2607.13970},
  year={ 2026 },
  url={https://arxiv.org/abs/2607.13970}
}