
Q-Learning Lab: Teaching Reinforcement Learning Through Learner-Generated Trace Analysis
Source: arXiv:2607.10802 · Published 2026-07-12 · By Ekkachai Jueng
TL;DR
This paper presents Q-Learning Lab, a browser-based, bilingual (Thai/English) educational tool designed to teach tabular Q-learning through detailed, step-by-step numeric exposure and learner-driven data analysis. Unlike existing gridworld visualizers that display only the resulting policy or value functions, the tool reveals the full Bellman update substitutions live at each step and logs every transition with the complete Q-table row and exploration/exploitation provenance. Learners run experiments, export their agent’s transition traces as CSV files, and then analyze them to produce learning curves, value heatmaps, and visitation maps, fostering active, reflective discovery instead of passive observation. The authors validate their implementation without student subjects by demonstrating algorithmic correctness against value iteration, reproducibility of pedagogical claims via hyperparameter sweeps, and diagnostic clarity through reward editing that separates exploration failure from reward misspecification. The single HTML file requires no install, runs offline, and includes a 50-minute lesson plan embedding the tool in experiential learning theory.
Key findings
- The Q-learning implementation matches the value-iteration ground truth with 98.5% greedy policy agreement and max absolute value function error of 0.34 after 50,000 episodes.
- Hyperparameter sweeps reproduce all pedagogical lessons: e.g., γ=0 fails to solve the task (final return −6.1), ε=1 still converges more slowly, and α values trade off speed and variance in learning.
- Editable reward experiments reveal two distinct failure modes: a pit reward +5 leads to suboptimal pit-seeking due to exploration failure (agent under-optimized), while pit reward +20 induces genuine reward misspecification where the pit becomes optimal behavior.
- The tool’s live Bellman substitution panel exposes numeric updates at each step, clarifying TD errors and bootstrapping effects, which are otherwise abstract in RL teaching.
- The exported CSV trace captures 14 fields per step, including the full pre-action Q-row, exploration flags, and TD targets/errors, enabling learner-side replay buffer analysis.
- The tool runs entirely offline in a single HTML file (~600 lines) with no external dependencies, lowering barriers to use in diverse classrooms.
- The bilingual interface enables seamless switching between Thai and English, supporting students in non-English language environments.
- Learning curves, visitation heatmaps, and value heatmaps produced from learner-generated traces illustrate policy improvement, exploration shifts, and value propagation visibly.
Threat model
n/a — This is a pedagogical tool with no explicit security or adversary model. The context assumes a benign classroom environment focused on transparent reinforcement learning mechanics rather than threat resistance.
Methodology — deep read
Threat model & assumptions: The tool assumes a deterministic, fully observable single-agent gridworld environment (5x5 cells) with fixed starting position, terminal states (goal and pits), and walls. The agent uses tabular Q-learning with ε-greedy exploration and standard Bellman updates; the environment and agent behavior are fully known and transparent to learner and instructor. No adversarial model is relevant as this is a pedagogy-focused system.
Data: The environment includes 25 states and 4 actions per state, totaling 100 Q-values. Each training run consists of episodes where the agent navigates from start to terminal states under given hyperparameters (α, γ, ε). The tool logs up to 500 recent transitions on-screen plus exports complete CSV traces capturing full Q-row, action choice provenance (greedy vs random), TD target, TD error, and state details. Datasets are generated interactively by learners.
Architecture/algorithm: The agent runs standard tabular Q-learning following the equation Q(s,a) ← Q(s,a) + α[r + γ max_{a'} Q(s',a') - Q(s,a)]. The tool uniquely implements a live Bellman-substitution panel that dynamically replaces each term with actual numeric values observed at every step, making the update fully inspectable. The agent’s decision logic tracks whether the action was greedy or exploratory under ε-greedy selection. Wall collisions and terminal transitions are explicitly annotated.
Training regime: Training modes include step-by-step execution for slow demonstration, continuous play with adjustable speed for intermediate exploration, and accelerated training over 100 episodes for convergence demonstration. Experiments run 600 or 50,000 episodes with controlled hyperparameter sweeps over α (0.05, 0.3, 0.9), γ (0, 0.5, 0.95), and ε (0.05, 0.3, 1.0). Each run is repeated over 10 seeds with fixed random seeds for reproducibility.
Evaluation protocol: Three primary evaluation questions are posed without human-subject data: (i) correctness vs value iteration ground truth with tight numeric tolerance (10^−12) and action-set comparisons; (ii) reproducibility of pedagogical claims via systematic hyperparameter sweeps and measurement of undiscounted returns per episode; (iii) reward editing experiments where pit rewards are varied to produce either exploration failures or genuine reward misspecification, verified by comparing learned policies to Bellman-optimal policies on edited MDPs. Metrics include greedy-policy return, state visitation frequency, TD errors, and policy agreement rates.
Reproducibility: The entire tool (qlearning_lab.html), lesson plan, and Python reference implementation are publicly released on GitHub. The single-file HTML is self-contained with no dependencies and runs offline ensuring easy access. Experiment scripts for all evaluation studies and CSV export formats are documented and available for learner analysis.
End-to-end example: A learner loads the tool in a browser, sets default parameters (α=0.3, γ=0.95, ε=0.3), and steps through the initial training episode observing the Bellman panel updating numeric values live after each action. They export the trace CSV and generate a learning curve showing cumulative episode return increasing towards the optimum (~9.3). They then increase pit reward to +20 in the rewards card, retrain, and export a second trace, observing the greedy policy now opts for pits reflecting reward misspecification rather than exploration failure. Throughout, the learner interrogates logged Q-values and TD errors to understand the algorithm’s behavior in fine detail.
Technical innovations
- Live Bellman substitution panel showing every numeric term of the Q-learning update per action step to make value-function learning transparent at a mechanistic level.
- Decision-complete trace logging capturing entire pre-action Q-value rows, greedy/random action provenance, TD targets/errors, and environmental annotations exportable as CSV for learner-driven analysis.
- Learn–export–analyze workflow that transforms RL teaching from passive visualization to active data generation and reflective inquiry grounded in constructionist pedagogy.
- Bilingual (Thai/English) single-file browser implementation with no installation or external dependencies, substantially lowering barriers to RL experimentation in diverse classrooms.
Datasets
- Learner-generated Q-learning traces (CSV): variable size per training run, includes full Q-row per step, action provenance, TD errors; generated interactively in-browser.
Baselines vs proposed
- Value iteration ground truth: V*(s0) = 6.38 (γ=0.95) vs Q-learning learned maxa Q(s,a) with max absolute error 0.34 after 50,000 episodes.
- Exploration sweep (ε): ε=0.3 final greedy-policy return ≈ 9.3 vs ε=1.0 slower convergence but also reaching ≈9.3, ε=0.05 slower still.
- Learning rate sweep (α): α=0.3 faster convergence with moderate noise vs α=0.05 slower convergence; α=0.9 noisy initial learning but rapid policy formation.
- Discount factor sweep (γ): γ=0.95 and γ=0.5 reach optimum return near 9.3; γ=0 fails (−6.1 final return) as agent cannot propagate reward information.
Figures from the paper
Figures are reproduced from the source paper for academic discussion. Original copyright: the paper authors. See arXiv:2607.10802.
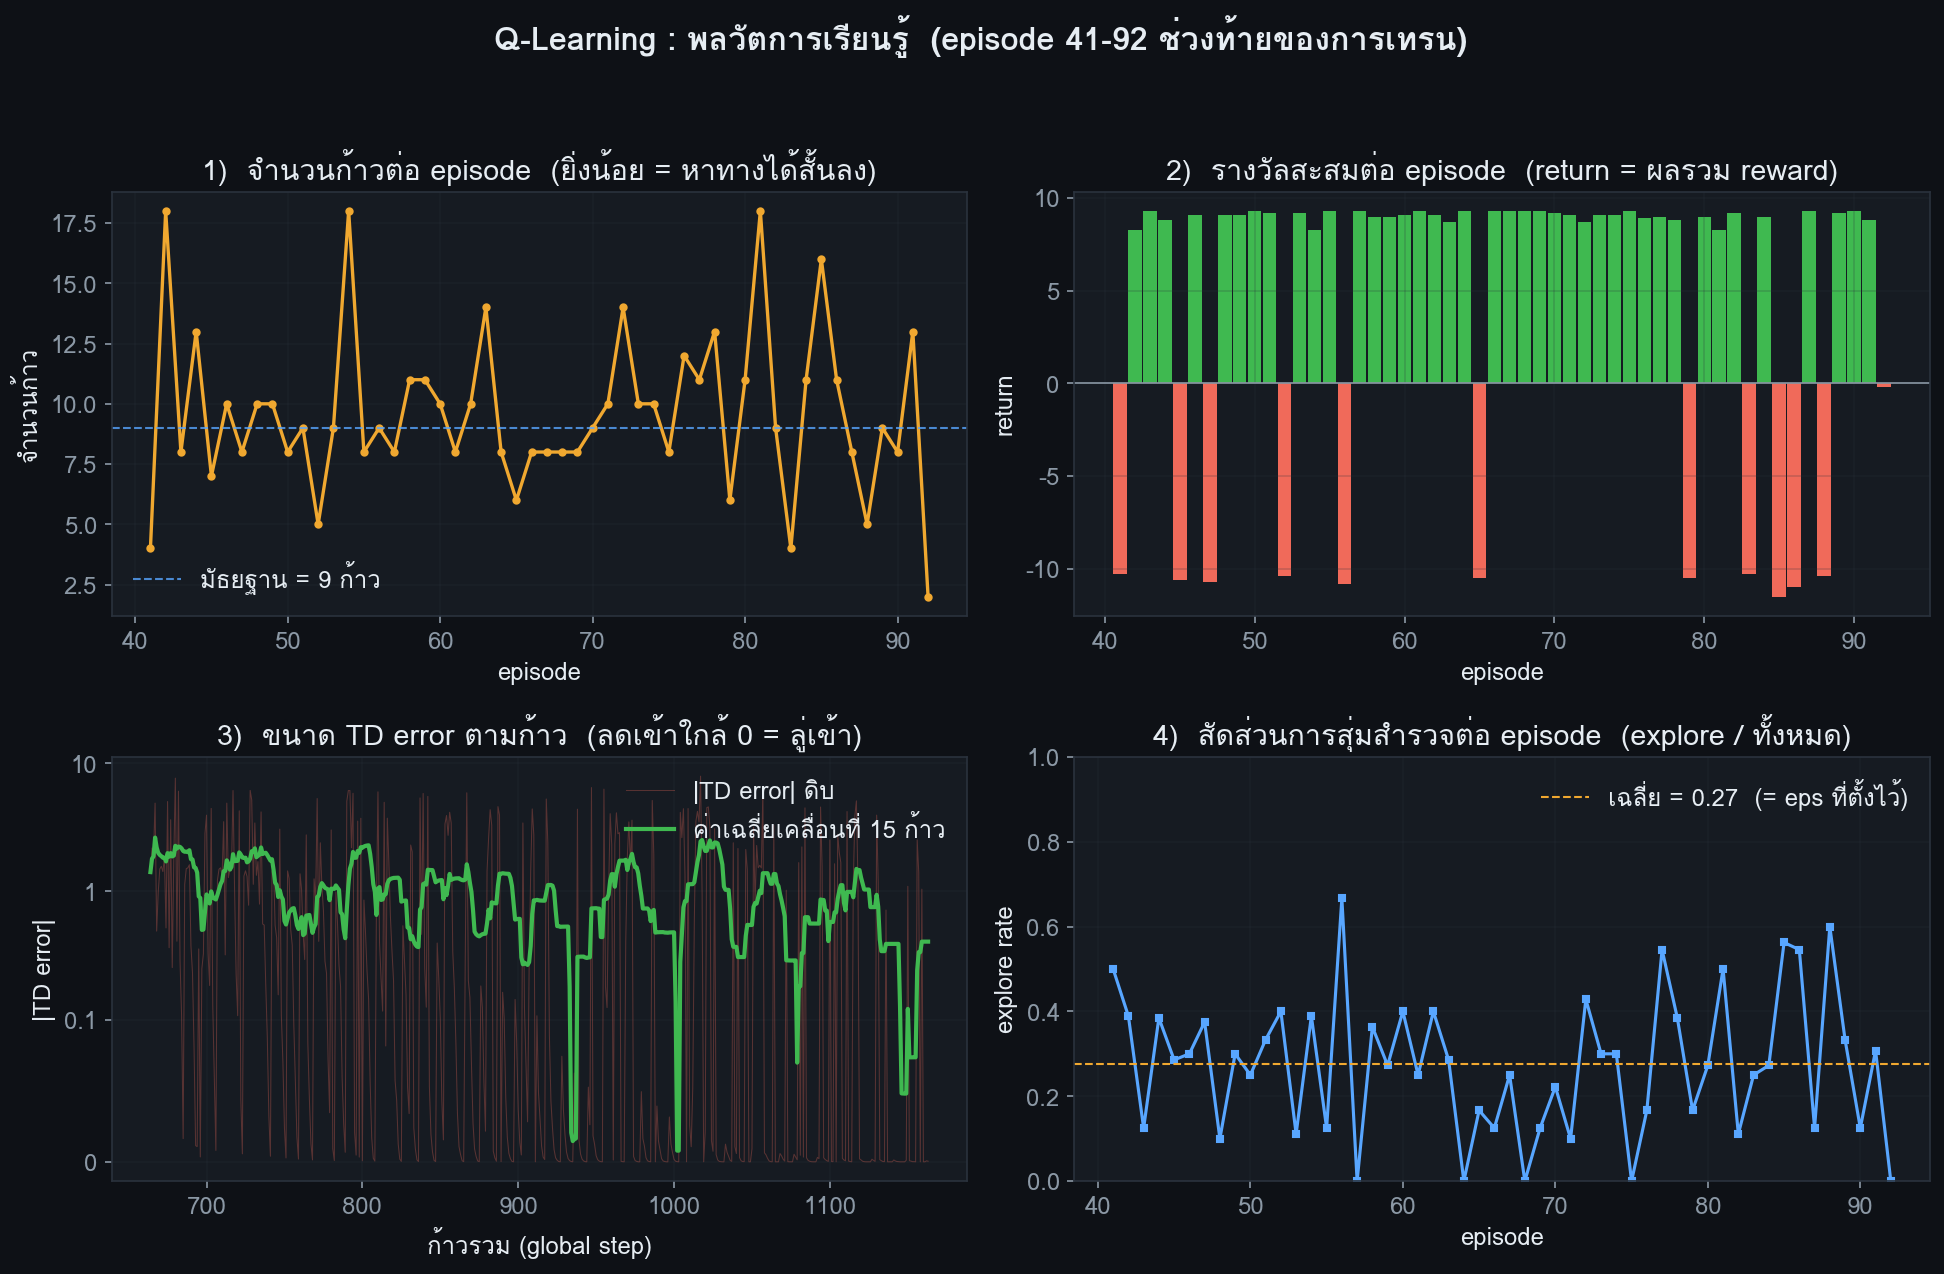
Fig 2: Learner-side analysis of a trace exported from the tool (learning dynamics, left; value function
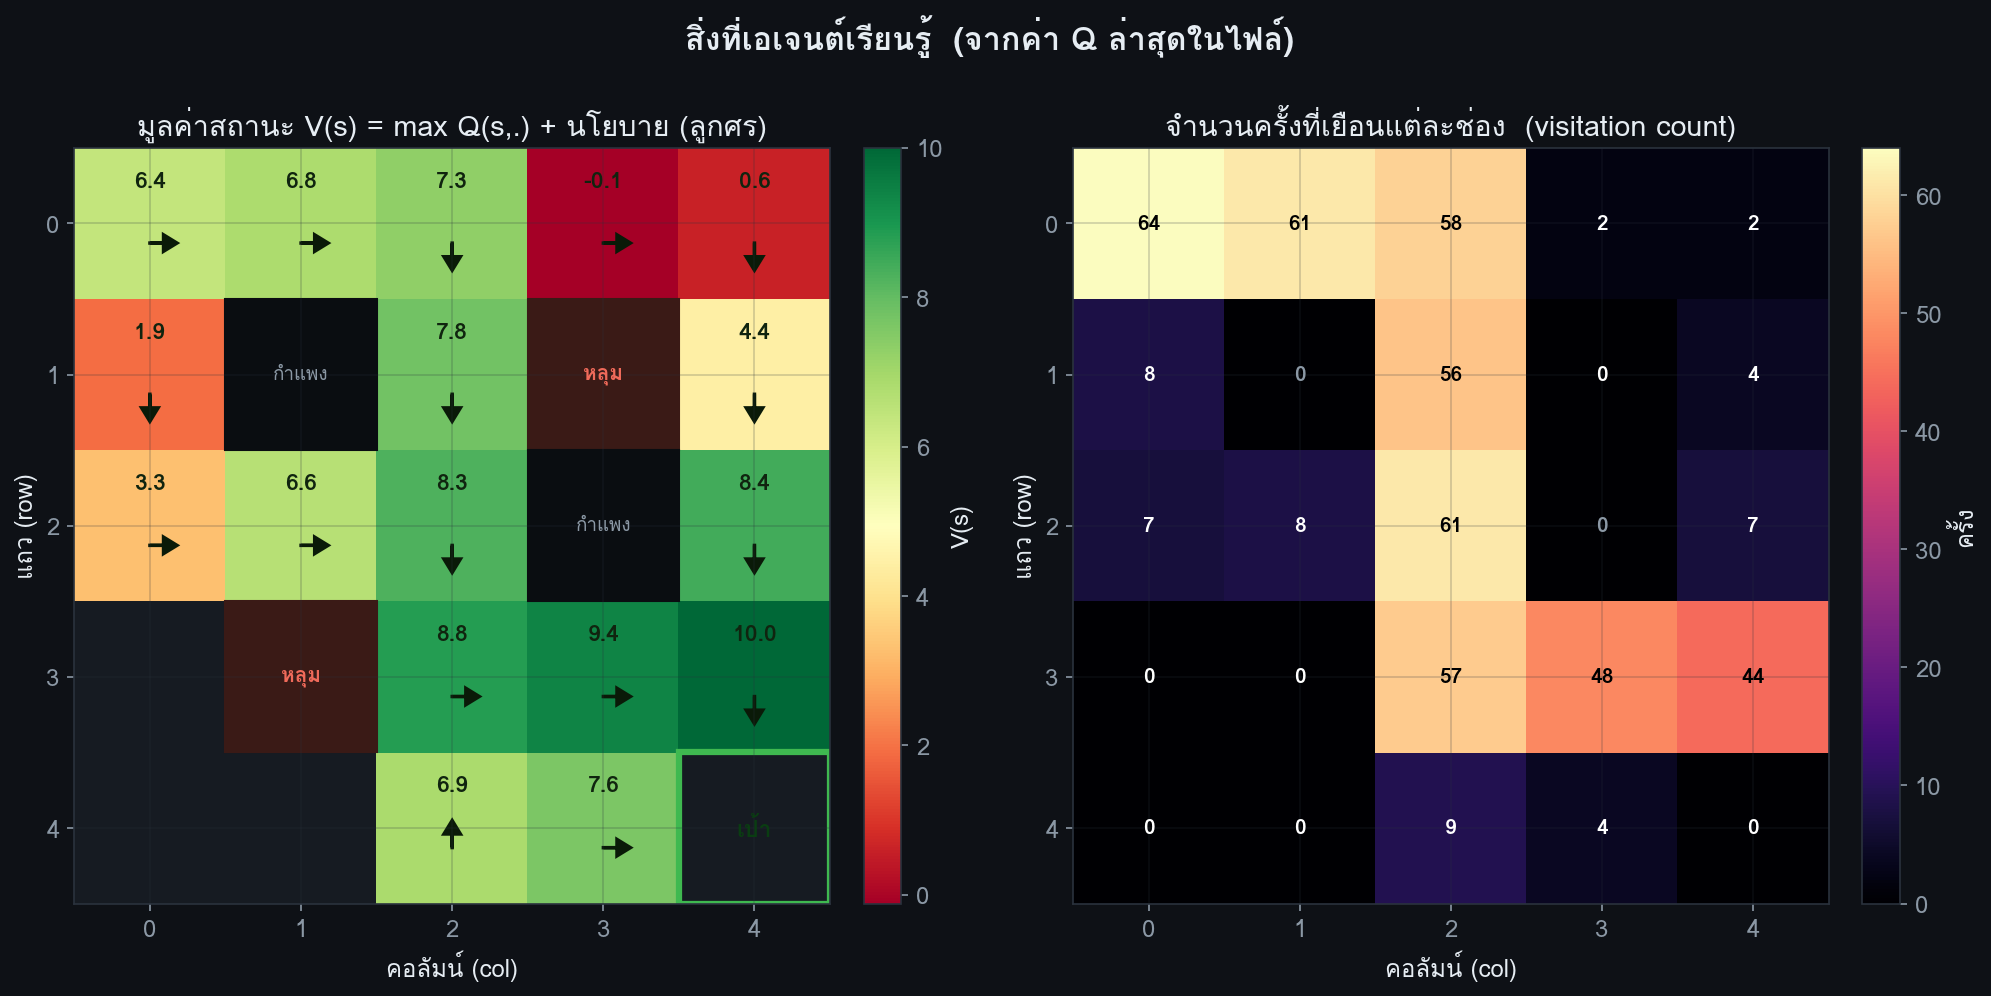
Fig 1: The environment. S = start, G = goal (+10, terminal), P = pit (−10, terminal), W = wall

Fig 3: Correctness of the tool’s algorithm. Left: V ∗and optimal policy from value iteration. Center:

Fig 4: Greedy-policy return during training for the sweeps in lesson moment (4): exploration ε (left),

Fig 5 (page 8).
Limitations
- No human-subject evaluation yet; pedagogical effectiveness and learning gains remain untested.
- Environment limited to a deterministic small 5×5 gridworld; does not cover stochastic transitions, continuous state/action spaces, function approximation, or multi-agent RL.
- Trace logging limited to recent 500 steps onscreen; fast training modes skip logging to maintain interactivity—long runs may have partial traces.
- Hyperparameter effects compressed by small MDP size—most settings converge eventually, limiting contrasts except in extreme cases (e.g., γ=0).
- Single-agent tabular Q-learning only; extensions to neural RL or multi-agent settings are out of scope and left to future work.
- Analysis relies on learner initiative and external spreadsheet or coding environment; no integrated analysis within the tool.
Open questions / follow-ons
- How effective is the learn–export–analyze loop in improving conceptual understanding and retention in actual classroom settings?
- Can the core transparency and trace analysis principles be extended to stochastic, continuous, or multi-agent RL environments while retaining pedagogical clarity?
- How might integration of automatic trace analysis or in-tool diagnostics reduce the workload on learners while preserving reflective insight?
- What are effective ways to scale the tool or similar approaches toward deep RL and function approximation teaching given the complexity of neural networks?
Why it matters for bot defense
While not directly related to bot defense or CAPTCHA design, the paper’s core contribution—making complex RL algorithms transparent and generating detailed learner-side data traces—offers useful insights for CAPTCHA labs deploying RL or adaptive challenge systems. Practitioners working on RL-based bot detection or adaptive puzzles can draw inspiration from the Q-Learning Lab’s emphasis on mechanistic traceability and interactive data export to better understand, debug, and teach the behavior of RL agents embedded in security systems. The ability to export and analyze complete decision traces with exploration provenance can inform root cause analysis of agent failures or undesired behaviors in bot-detection RL contexts. Moreover, the pedagogical approach of turning passive demonstration into active data analysis is relevant for training security engineers on RL-based detection methods, improving their ability to diagnose reward specification errors versus exploration deficiencies that commonly complicate real-world adaptive defenses.
Cite
@article{arxiv2607_10802,
  title={ Q-Learning Lab: Teaching Reinforcement Learning Through Learner-Generated Trace Analysis },
  author={ Ekkachai Jueng },
  journal={arXiv preprint arXiv:2607.10802},
  year={ 2026 },
  url={https://arxiv.org/abs/2607.10802}
}