
GeoXplain: On-the-Fly Visual Explanations for Weather Foundation Models
Source: arXiv:2607.05655 · Published 2026-07-06 · By Clemens Walter Koprolin, Leonardo Trentini, Benedikt Soja, Mennatallah El-Assady, Christina Humer
TL;DR
GeoXplain addresses the challenge of interpreting high-dimensional, spatially and temporally complex forecasts produced by modern weather and climate foundation models like Microsoft Aurora. These models generate multi-variable outputs across spatial grids, vertical atmospheric pressure levels, and forecast lead times, making static visualizations inadequate to fully explore learned relationships and explanations. GeoXplain is a Python-based interactive visualization toolkit that enables on-the-fly rendering and exploration of geospatial attribution maps, facilitating comparative inspection across variables, pressure levels, and time frames. It supports multiple attribution methods (gradient saliency, Integrated Gradients, RISE, ViT-CX) integrated into a unified viewer that runs in Jupyter notebooks or browsers. The toolkit separates visualization from model-specific computation via a backend adapter API, exemplified by the Aurora adapter which runs explanation methods locally or remotely on GPUs or HPC clusters, returning standardized result bundles for visualization. This design enables uninterrupted, flexible, domain-contextual, and interactive visual analysis workflows for atmospheric scientists.
The key innovation lies in combining interactive maps and linked timeline control with support for multiple physical overlay fields, supporting detailed meteorological inspection of attributions in proper geophysical context. The Aurora adapter customizes and adapts the attribution methods to the Aurora model’s data and architecture while providing efficient execution modes (local GPU, remote SLURM). Verification includes sanity checks on attribution completeness and parameter randomization. GeoXplain’s modular, model-agnostic design facilitates reuse for other weather and climate models beyond Aurora. Overall, GeoXplain provides an advance in explainable AI tooling tailored for foundation models in earth system science, enabling scientists to generate hypotheses about model behavior and sensitivities in an interactive visual environment.
Key findings
- GeoXplain supports gradient saliency, Integrated Gradients, RISE, and ViT-CX attribution methods adapted to the Aurora earth system foundation model.
- Attributions are available as dense latitude-longitude grids over multiple atmospheric pressure levels and forecast lead times, rendered with selectable heatmaps or contour lines.
- The Aurora adapter computes explanations remotely in GPU or SLURM environments while maintaining a consistent Python API in notebooks, facilitating smooth analyst workflow.
- Verification tests show Integrated Gradients attributions with sub-percent to 1% completeness residuals and that model-parameter randomization removes meaningful learned attribution structures, increasing confidence in explanation quality.
- The toolkit’s self-describing result bundles decouple visualization from computation, enabling reuse for other weather and climate models with WeatherBench-style data.
- Multi-step autoregressive rollouts reveal attribution shifts over forecast lead times that correspond to plausible meteorological patterns (e.g., upstream influences from western France and northern Spain on humidity over Zurich).
- Physical field overlays (e.g., temperature, humidity, wind components) can be simultaneously rendered to provide meteorological context for interpreting attribution maps.
- The visual interface maintains meteorological context by linking attribution with physical forecast variables, pressure layers, target locations, and forecast times within a seamless notebook or browser environment.
Methodology — deep read
The paper follows these methodological steps:
Threat Model and Assumptions: Not a security paper; adversaries are not modeled. The focus is on enabling domain scientists to interpret model explanations of complex weather forecasts.
Data: Uses WeatherBench-style datasets and Microsoft Aurora foundation model inputs and outputs. These include multi-variable atmospheric fields over a global latitude-longitude grid with multiple vertical pressure levels and time steps. Targets specify forecast variables at specific pressure levels and locations (points or boxes). Data are handled as batches compatible with Aurora.
Architecture/Algorithm: The core design separates visualization from model-specific computation. The GeoXplain viewer is model-agnostic and renders attribution grids with metadata. The Aurora adapter is the first backend that transforms user targets into scalar outputs, loads matching data cases, runs explanation methods adapted to Aurora's inputs, and outputs GeoXplain-standardized result bundles.
Attribution Methods Adapted: Saliency maps compute gradients of scalar model outputs w.r.t. inputs at the current forecast time step. Integrated Gradients integrate these gradients along a path from a smoothed baseline (Gaussian-smoothed input fields) to observed input. RISE estimates attribution by perturbing input fields with random masks and measuring output changes, using a centered regression estimator adapted for atmospheric variables. ViT-CX explains Vision Transformer internal features by clustering spatial token embeddings to generate perturbation masks. All methods export attribution maps per input variable, pressure level, and time step.
Training Regime: Not applicable; no model training described, only explanation computation. Aurora weights are public and fixed.
Evaluation Protocol: Verification consists of numerical diagnostics measuring completeness residuals (for IG), model parameter randomization checks removing attribution patterns (sanity tests), and visual parity tests comparing rendering to Matplotlib references. No user studies reported yet.
Reproducibility: GeoXplain and Aurora adapter are open source on GitHub; the code, documentation, examples, and PyPI packages are publicly available. The public Aurora weights and WeatherBench data are used. The standardized self-describing result bundle format enables reproducibility and decouples viewer from backend implementations.
Example End-to-End: An analyst defines a forecast target (e.g., 850 hPa humidity over Zurich on a specific date/time). The Aurora adapter loads matching Aurora input data, constructs a scalar target from model output grids, and runs Integrated Gradients on selected input variables. The results return attribution grids accessible as GeoXplain result bundles. The analyst loads these into the notebook widget, enabling interactive exploration of attributions across variables, pressure levels, and lead times, overlaying physical variables such as temperature or wind to contextualize patterns. This workflow exemplifies smooth integration of explanation computation with interactive visual analysis.
Technical innovations
- Design of GeoXplain separation between a model-agnostic interactive geospatial visualization and model-specific adapters computing explanations on demand, supporting flexible execution backends including local GPU and HPC SLURM clusters.
- Adaptation and customization of multiple attribution methods (gradient saliency, Integrated Gradients, RISE, ViT-CX) to the high-dimensional, multi-variable Aurora foundation model inputs and outputs with specific baseline and perturbation strategies.
- Introduction of a self-describing, standardized attribution result bundle format that encapsulates attribution grids and comprehensive metadata (variable, pressure level, time, coordinate system) enabling seamless reuse across notebook widgets, standalone viewers, and remote backends.
- Interactive notebook-integrated visualization combining linked timelines, multi-pressure level controls, signed attribution heatmaps and contour rendering, and overlays of physical meteorological fields, preserving meteorological interpretation context.
- Numerical verification techniques combining completeness residual metrics and sanity checks based on model-parameter randomization to validate that computed attributions correspond to learned model behavior rather than artifacts.
Datasets
- WeatherBench-style historic atmospheric data — used for Aurora input and output cases — public and standardized benchmark dataset.
Baselines vs proposed
- Integrated Gradients completeness residual: typically sub-percent to about 1% residual indicating near-complete attribution.
- Model randomization test: parameter randomization removes coherent attribution structures, confirming explanation sensitivity to learned model parameters.
- Visual parity tests: GeoXplain rendering matches standard Matplotlib references for color maps and opacity rendering.
Figures from the paper
Figures are reproduced from the source paper for academic discussion. Original copyright: the paper authors. See arXiv:2607.05655.
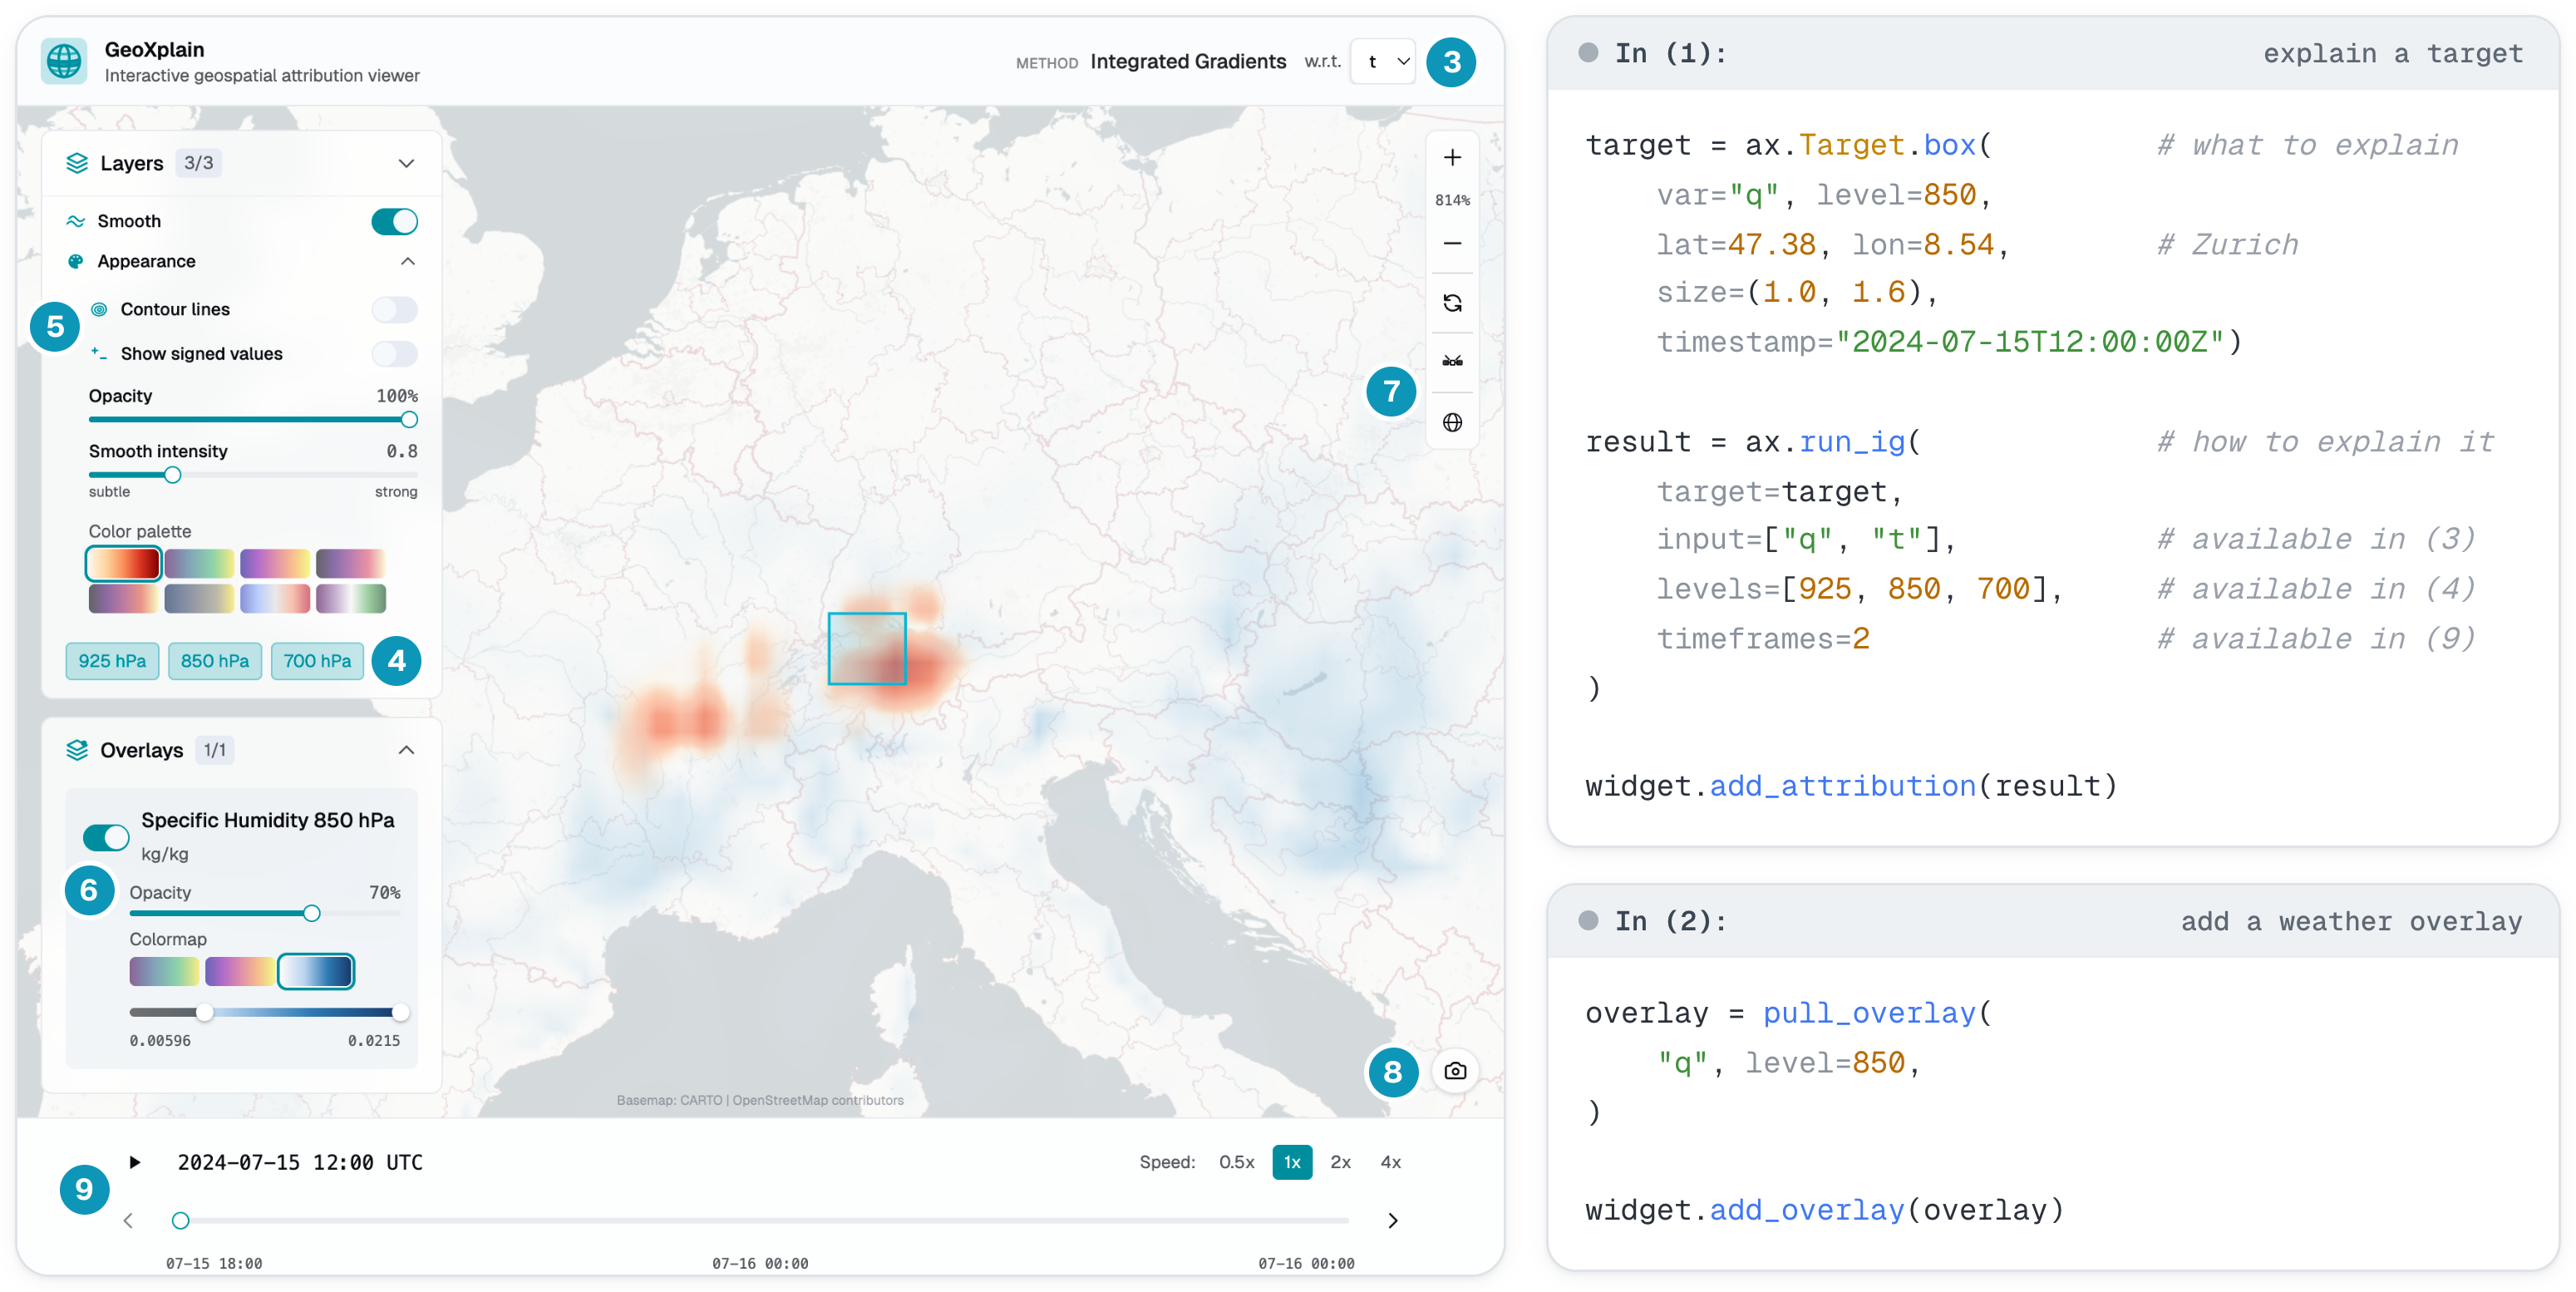
Fig 1: Example of GeoXplain notebook for explaining a humidity forecast at 850 hPa over Zurich, Switzerland with Integrated Gradients.
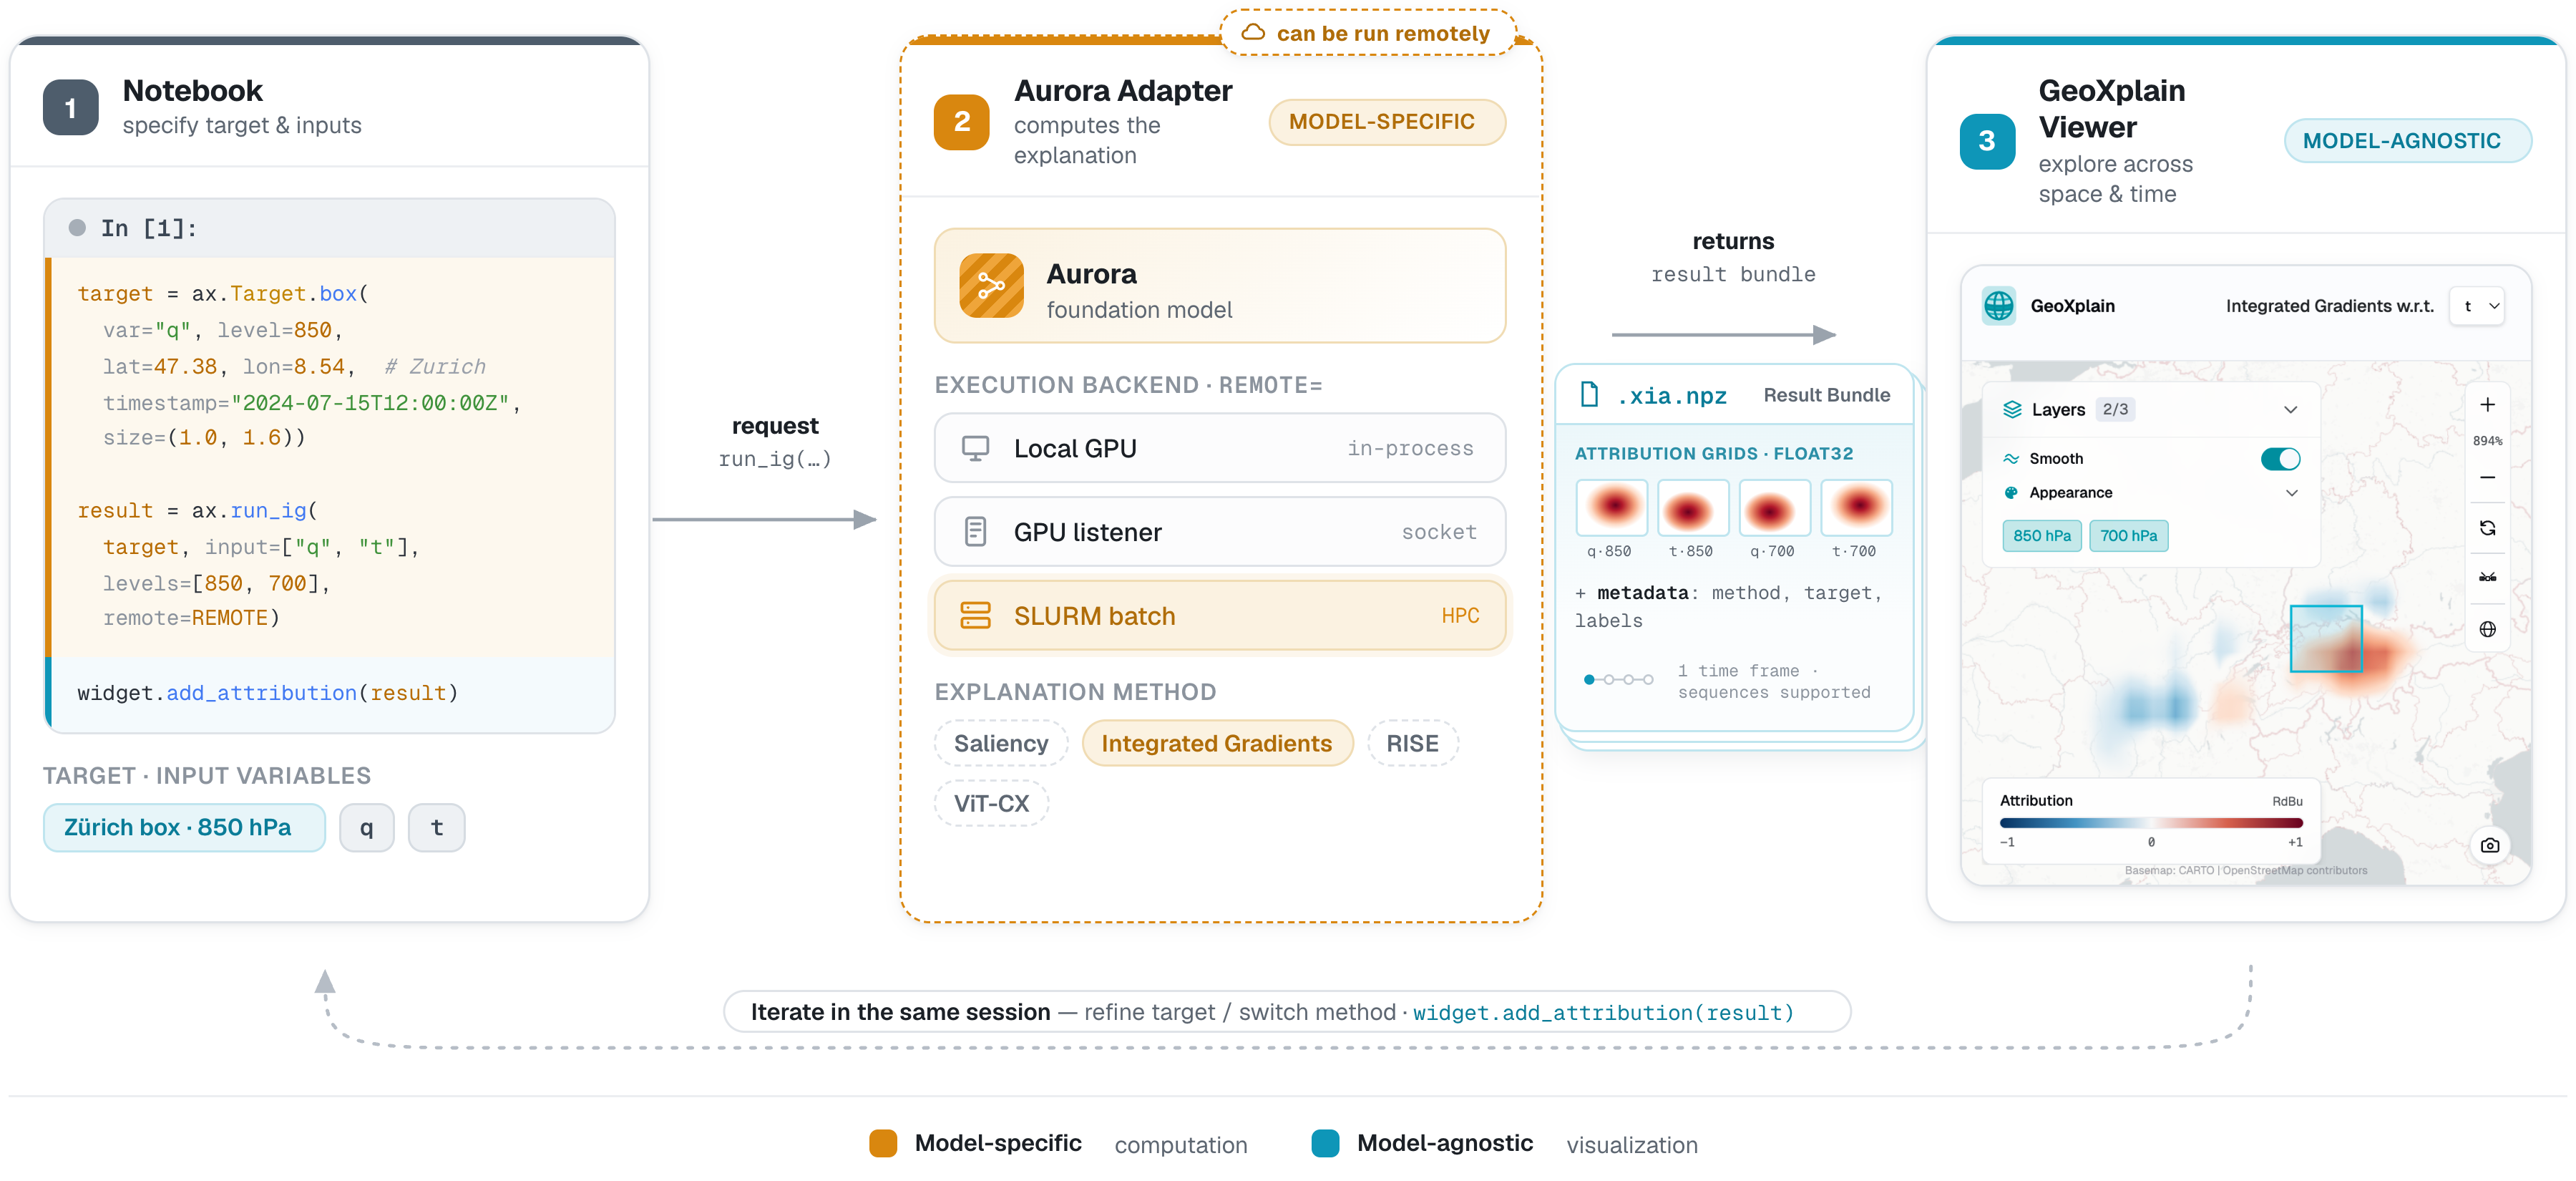
Fig 2: GeoXplain separates interactive visual analysis from model-specific computation. In the notebook (1), the analyst specifies the target and
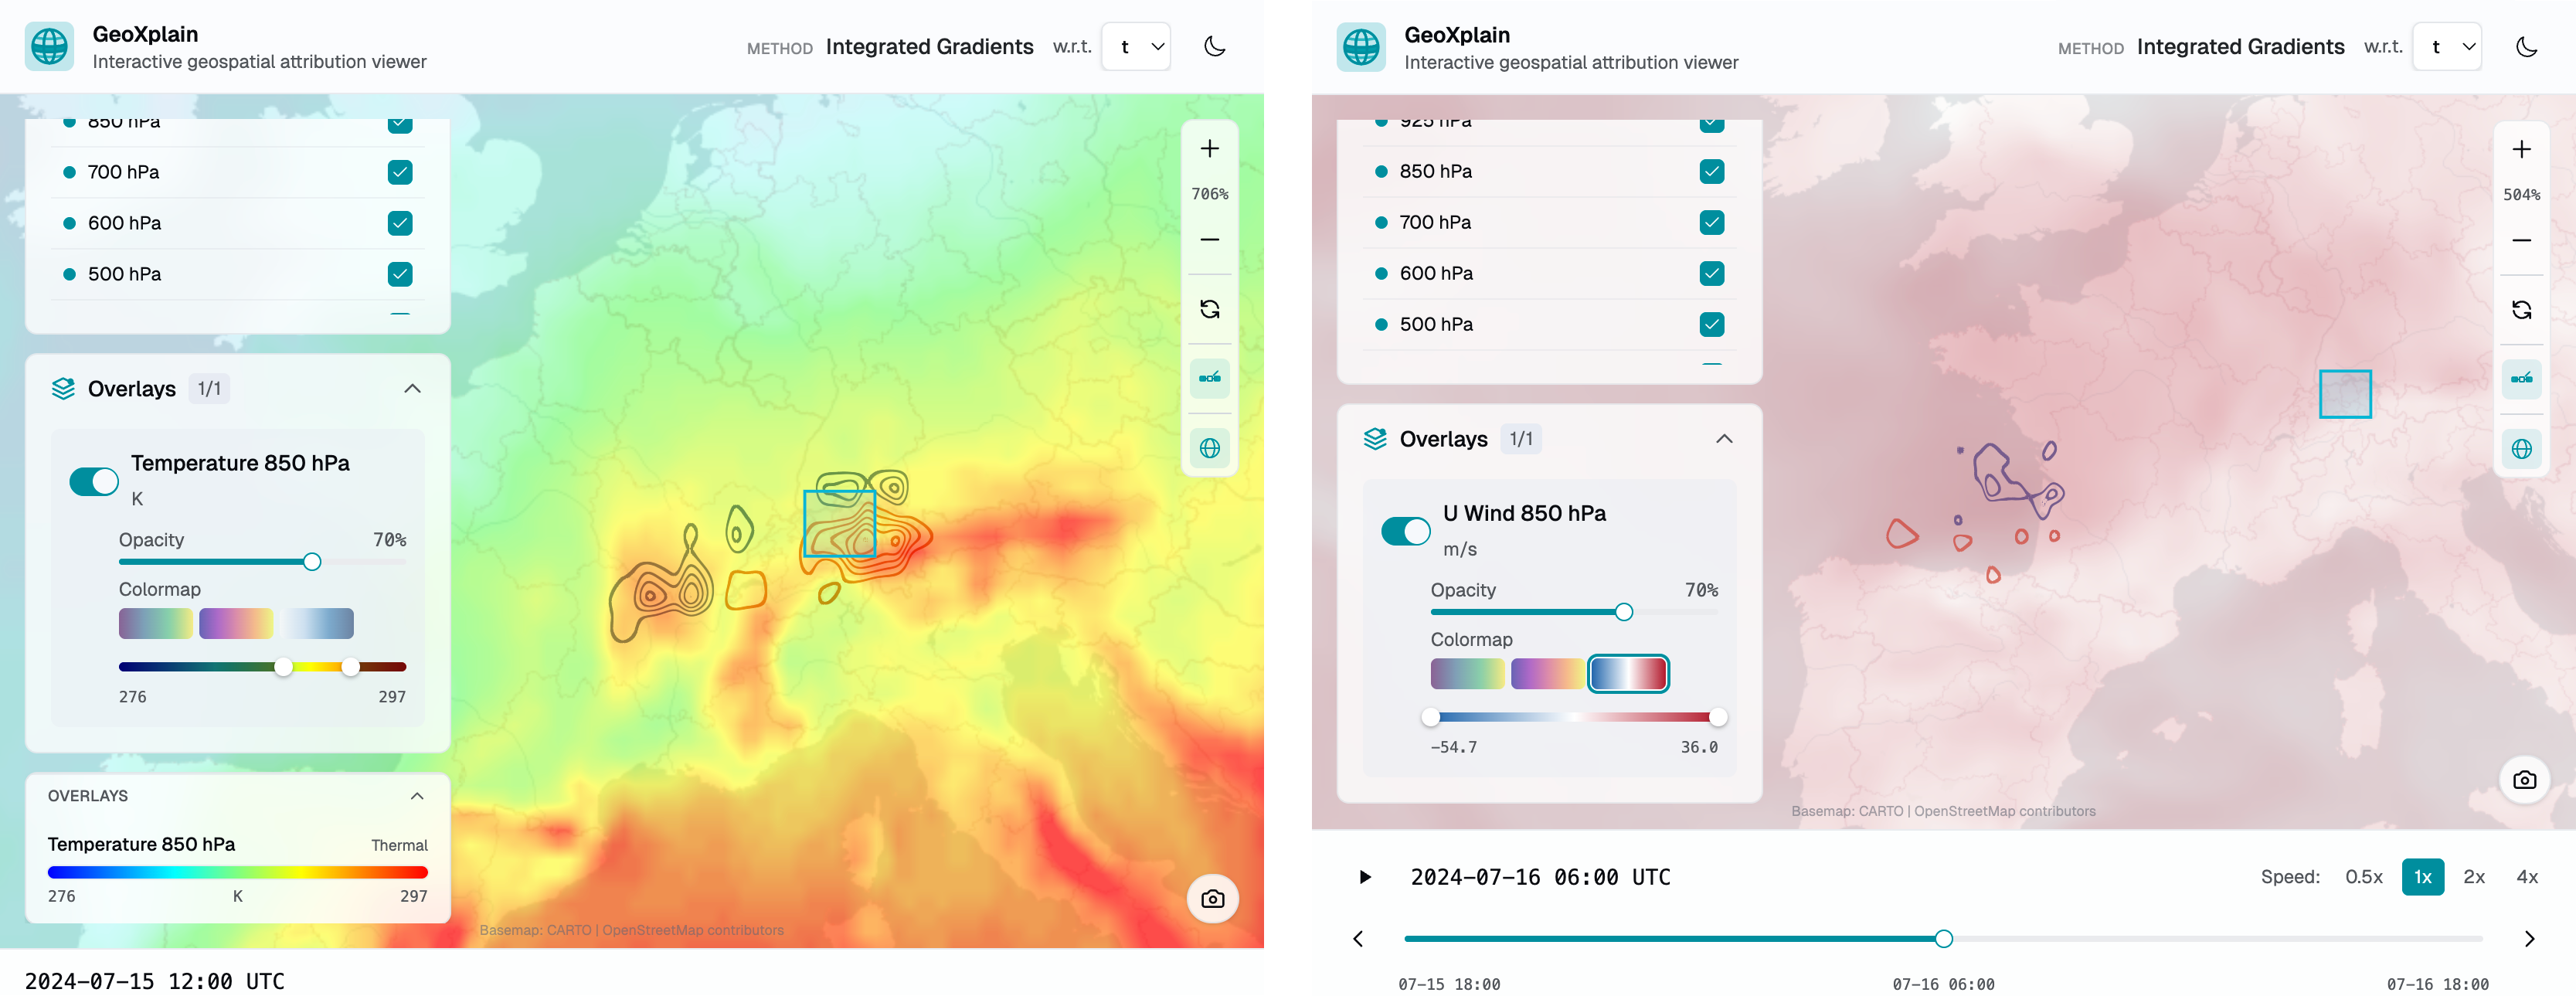
Fig 3: The left image shows IG attributions for the 850 hPa humidity forecast over Zurich with an 850 hPa temperature overlay. The right image
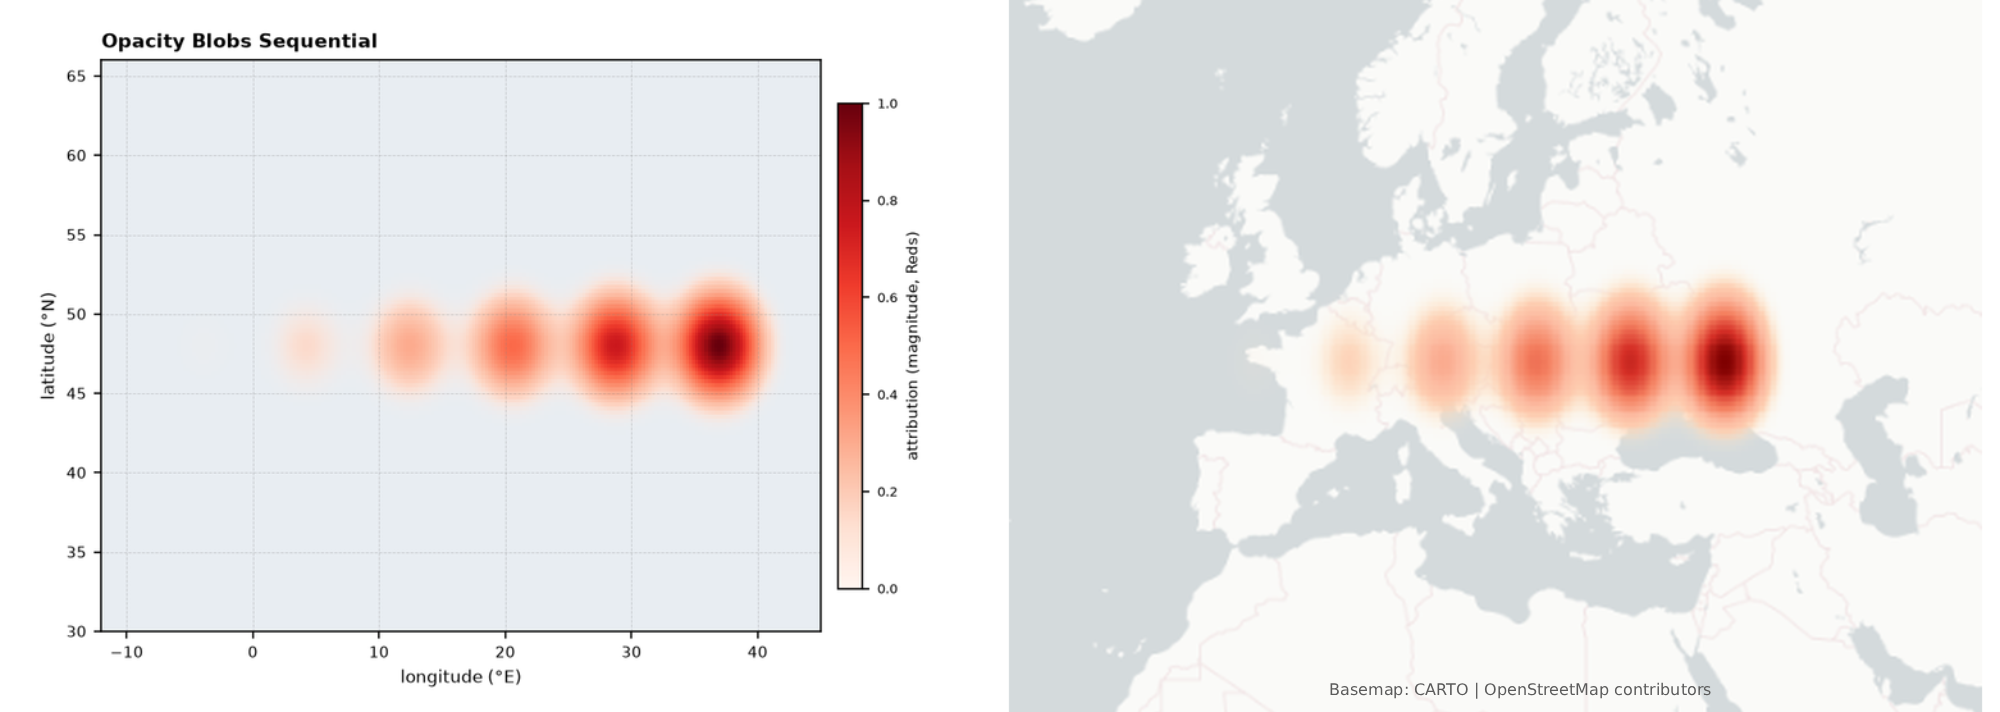
Fig 4: Example output from the viewer visual parity suite. The left panel is the independent Matplotlib reference for the sequential opacity-blob case,
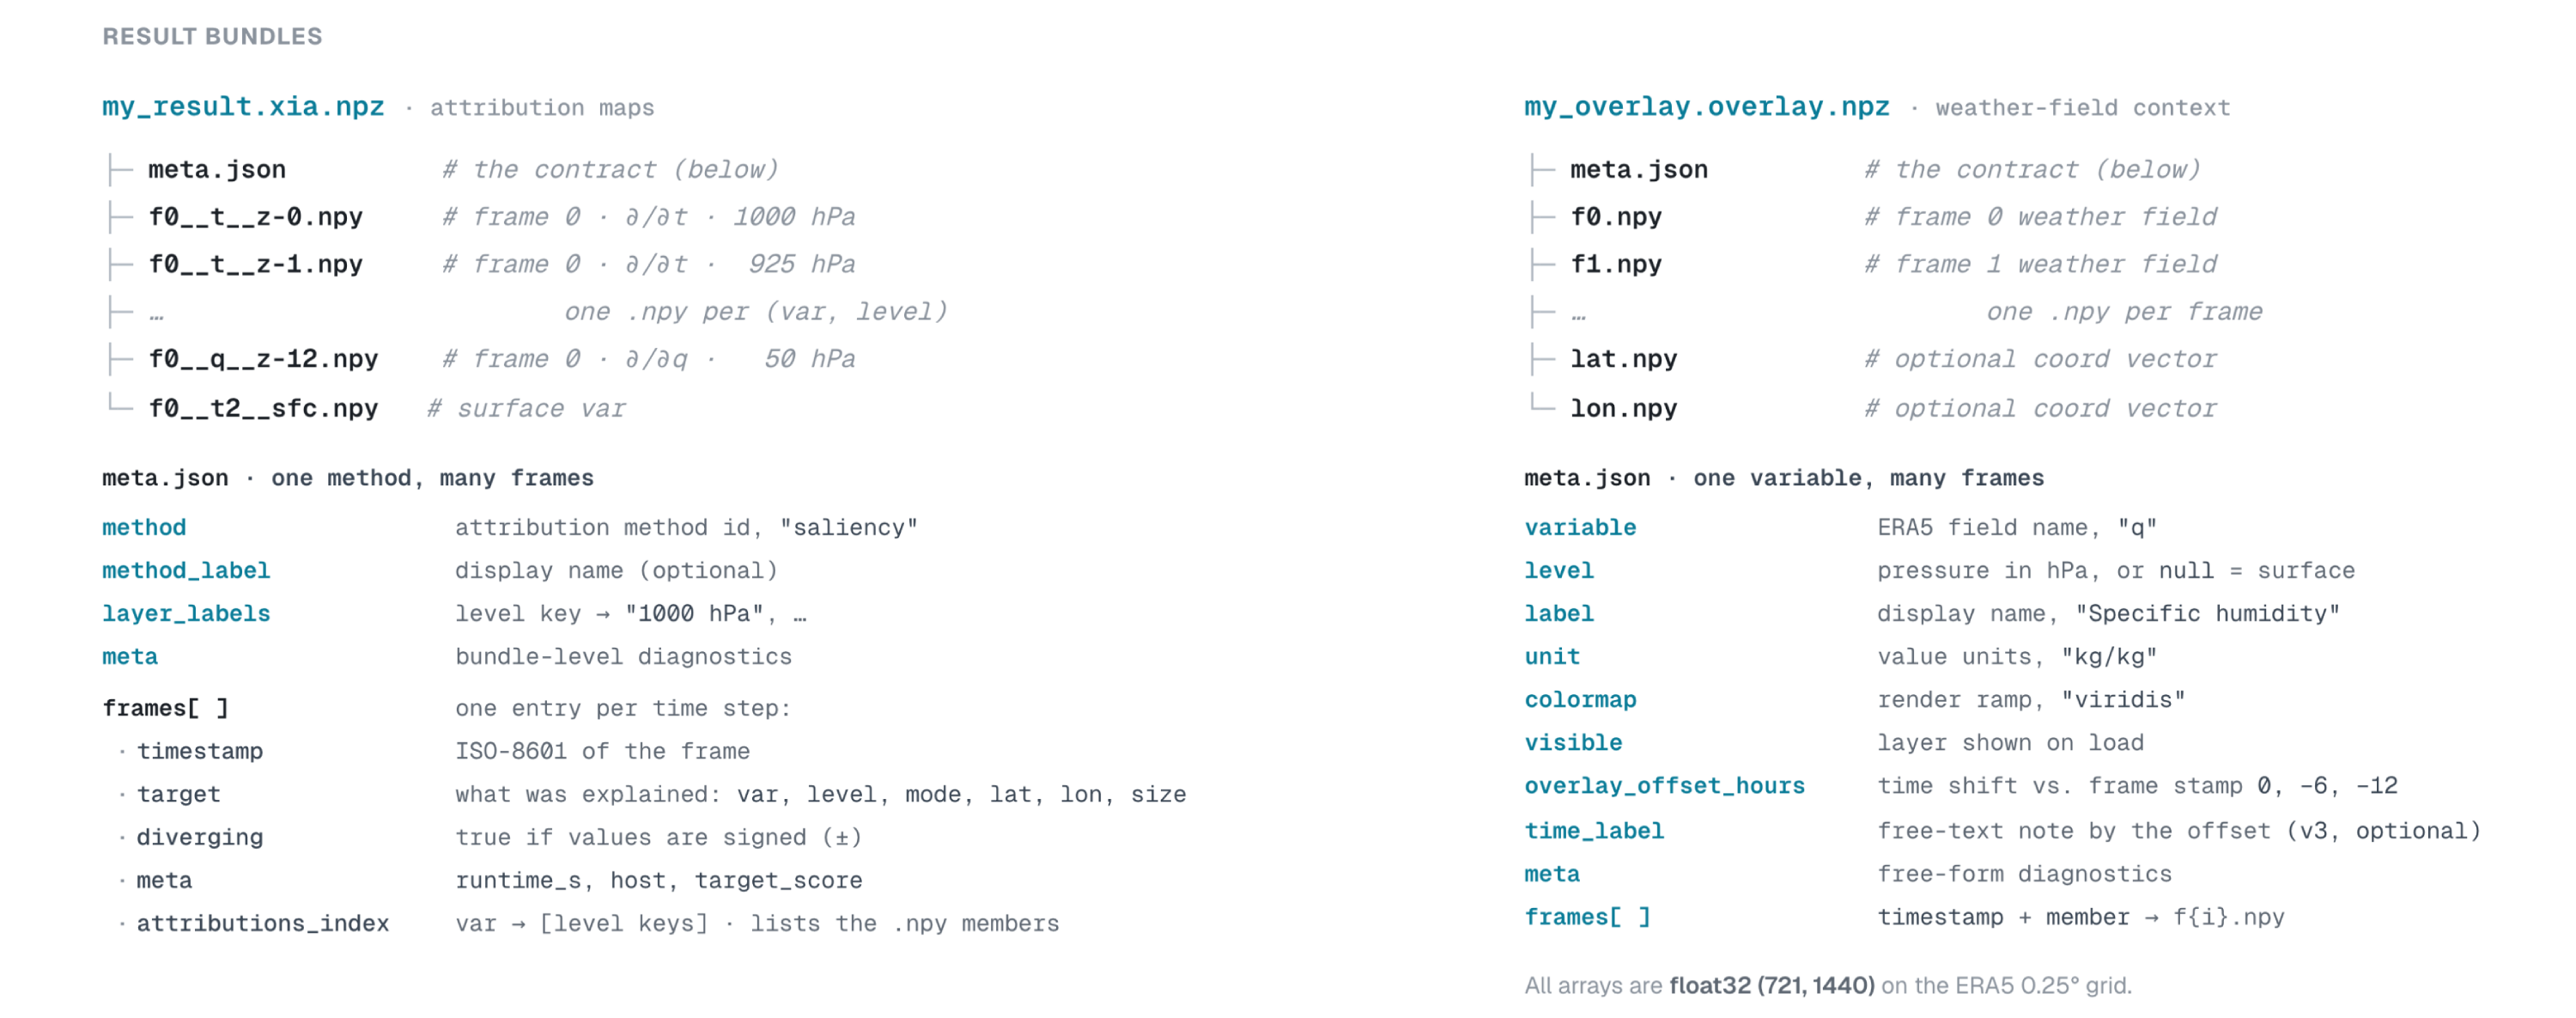
Fig 5: GeoXplain result bundles. Attribution bundles store a manifest plus one array per frame, input variable, and layer. Overlay bundles store one
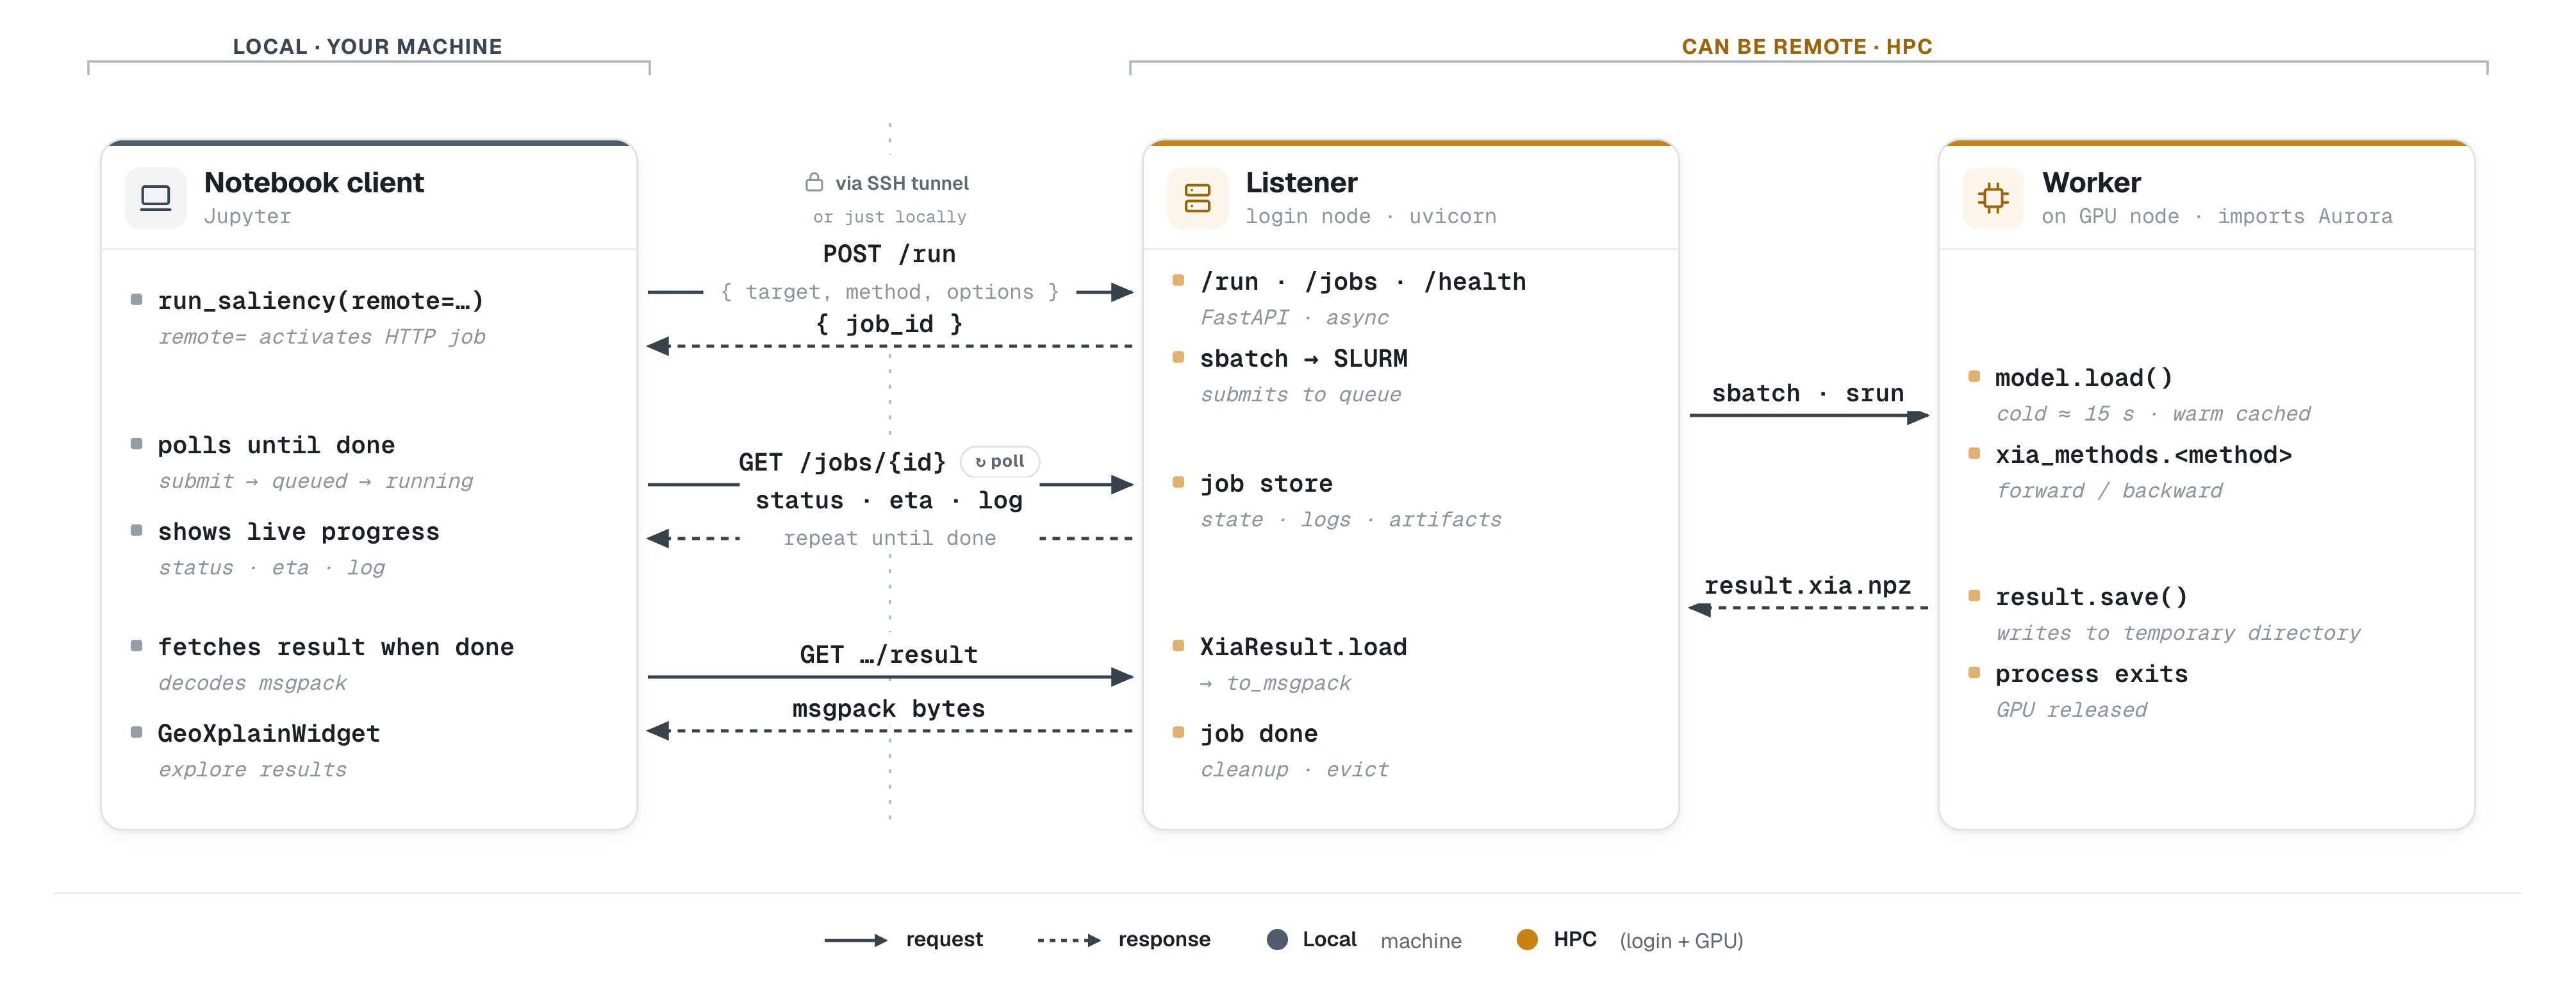
Fig 6: Remote execution in the Aurora adapter. A notebook client submits an HTTP job, polls the listener for progress and logs, and fetches packed
Limitations
- No formal user evaluation or field study with domain experts has been performed to validate usability and interpretability improvements.
- The current backend and protocol support only dense regular latitude-longitude grids; future extensions are needed for unstructured meshes, station data, ensembles, uncertainty, and nested regional models.
- Computationally expensive explanation methods (e.g., ViT-CX, long autoregressive rollouts) can cause substantial waiting times impacting interactive analysis experience.
- Sanity checks are necessary but not sufficient; full diagnostic analysis and adversarial robustness of explanations remain open.
- The attribution methods and baselines used (such as Gaussian smoothing in IG) may influence results and interpretation, requiring further sensitivity analysis.
- Overlays currently support limited physical fields; additional meteorological layers or derived quantities could improve context.
Open questions / follow-ons
- How do different baseline choices and integration paths in Integrated Gradients affect attribution interpretability for weather models?
- Can the GeoXplain framework be extended to support irregular spatial grids, ensemble forecasts, and uncertainty quantification in attribution maps?
- What impact do large computation latencies have on analyst workflow, and what strategies can minimize disruption during interactive explanation exploration?
- How effective is GeoXplain’s visualization design in supporting domain scientist hypotheses and decision-making in operational or research meteorology?
Why it matters for bot defense
Although GeoXplain focuses on explainable AI for weather foundation models rather than bot detection, it presents valuable lessons for bot-defense and CAPTCHA practitioners in designing interactive, multi-dimensional explanation and visualization tools. Key ideas include modular separation of visualization from back-end explanation computation to enable smooth analyst workflows despite costly model evaluations, and use of standardized self-describing result bundles to decouple front-end viewers from changing model implementations or execution environments. The emphasis on preserving domain context—here meteorological variables, spatial coordinates, temporal forecasts—highlights the importance of embedding explanations within natural problem semantics to aid interpretation. For bot defense or CAPTCHA analysis involving complex spatiotemporal features or multi-modal data, similar tool architecture may facilitate iterative hypothesis exploration and validation. Finally, GeoXplain’s integration with computational notebooks as an uninterrupted research environment models how ML explanation tooling can be embedded within practitioner workflows to accelerate iteration without switching contexts.
Cite
@article{arxiv2607_05655,
  title={ GeoXplain: On-the-Fly Visual Explanations for Weather Foundation Models },
  author={ Clemens Walter Koprolin and Leonardo Trentini and Benedikt Soja and Mennatallah El-Assady and Christina Humer },
  journal={arXiv preprint arXiv:2607.05655},
  year={ 2026 },
  url={https://arxiv.org/abs/2607.05655}
}