
MOAR Planner: Multi-Objective and Adaptive Risk-Aware Path Planning for Infrastructure Inspection with a UAV
Source: arXiv:2606.30575 · Published 2026-06-29 · By Louis Petit, Alexis Lussier Desbiens
TL;DR
This paper addresses the challenging problem of autonomous UAV navigation for infrastructure inspection, where missions demand safe, energy-efficient, and time-conscious trajectories in dynamically risky environments. The key novelty is the MOAR (Multi-Objective and Adaptive Risk-aware) path planner, which integrates evolving mission risks such as weather, battery status, and communication reliability into a unified, adaptive cost function. This function simultaneously optimizes safety, travel time, and energy consumption, enabling real-time recalculation of trajectories with speed adaptability based on obstacle proximity and flight direction. MOAR employs precomputed 2D cost maps combined with a discrete graph search using motion primitives and A* to find an optimal path in the SE(2) configuration space.
The method is rigorously evaluated via simulations on realistic power line inspection scenarios and validated in real flight tests with the Hydro-Quebec LineDrone. Results demonstrate the planner's ability to generate trajectories covering approximately 90% of the desirable trade-off range between speed and safety metrics compared to classical baselines like A*, Voronoi, and envelope methods. The risk-adaptive coefficient adjustment enables smooth and dynamic transition between navigation modes based on real-time risk indices. The framework's generality, computational efficiency (around 9ms per update onboard a Jetson Xavier), and incorporation of new cost concepts like damage and insertion cost represent significant advances for inspection UAV autonomy in obstacle-dense environments.
Key findings
- MOAR planner runtime is approximately 9ms per replan on a Jetson Xavier NX for a 30x20m environment with 0.3m grid resolution and 20k graph nodes.
- Simulated trajectories cover about 90% of the trade-off range for path length and obstacle clearance metrics compared to benchmarks (A*, Voronoi, envelope).
- Adjusting cost function coefficients enables smooth interpolation from shortest (A*-like) to safest (envelope-like) paths, with kS,0 = kT,0 = kE,0 = 0.33 yielding balanced performance.
- Risk adaptability experiments show MOAR switches behavior dynamically: above a threshold (~0.5 wind risk), path shifts from shortest to safer behavior increasing obstacle clearance.
- In real-world flight tests, the LineDrone followed a planned 17.7m path in 36.2s with minimum obstacle clearance maintained at 1.8m and an average of 3.7m, closely matching simulation.
- The safety cost function uniquely combines collision cost, hull-distance cost, and a new damage cost penalizing positions at risk of severe fall damage (e.g., above a 45° slope).
- Velocity planning adapts speed by flight direction and obstacle distance using a variable speed map allowing faster flight in safer, horizontal conditions and slower near obstacles.
- The graph search discrete state space includes 9 possible motion primitives from each node, enabling comprehensive and efficient exploration of the SE(2) space.
Threat model
Adversaries are environmental and operational risks that threaten mission success: wind gusts causing instability, communication loss, GPS localization failure, and battery depletion. The planner must dynamically adapt trajectories to mitigate these risks in real time. The model does not consider malicious attackers actively interfering with UAV controls but focuses on adapting to evolving mission uncertainties and failures.
Methodology — deep read
Threat Model & Assumptions: The system assumes an adversary that manifests as environmental and mission risks (wind, communication, localization failures, battery limits) dynamically affecting UAV navigation safety and autonomy. The UAV operates primarily in a simplified 2D vertical plane for power line inspection but the method generalizes to 3D. The planner must adapt in real-time to changing risk factors and physical constraints to avoid crashes and mission failures.
Data: Simulated environments are reconstructed from official Hydro-Quebec power line data representing typical 120kV and 315kV configurations. Three main mission types (inspection, exit, evacuation) are modeled, with 36 total simulation runs varying line and drone positions. Data also includes LiDAR point clouds segmented using RANSAC to detect obstacles and generate 2D maps. Real flight tests employ the LineDrone platform running onboard computations.
Architecture/Algorithm: MOAR constructs a discrete graph in SE(2) with nodes representing (x,y) positions and flight directions θ (nine possible motion primitives: N, NE, E, SE, S, SW, W, NW, 0). Each node stores precomputed costs: safety cost (collision, convex hull distance, damage), time cost (distance divided by velocity adapted to flight direction and clearance), and energy cost (normalized velocity changes). The cost function J combines these objectives with weights kS, kT, kE.
The safety cost is novel with three components: (a) collision cost enforcing minimum distance dmin from obstacles with a potential field profile, (b) insertion cost penalizing proximity to obstacle convex hull to encourage staying outside structure boundaries, and (c) damage cost penalizing positions above obstacles where a fall would cause damage, computed only if above a 45° slope. The time cost uses a directional velocity function capped by obstacle-dependent saturation speeds, allowing different speeds horizontally vs. vertically and near vs. far from obstacles. Energy cost is proportional to normalized velocity acceleration.
The planner uses A* search with a heuristic estimating minimum travel time plus stopping energy cost, leveraging precomputed cost maps for efficiency. Exit and evacuation paths use Dijkstra without heuristic. Coefficients kS, kT, kE are dynamically adapted using a real-time linear model combining risk factors WR (wind), CR (communication), LR (localization), and BR (battery) to adjust trade-offs between safety, time, and energy during the mission.
Training Regime: N/A (not a learned model). Parameters and coefficients are chosen via sensitivity analysis with step increments of 0.05, and risk indices varied in increments of 0.2.
Evaluation Protocol: Evaluation includes metrics: path length, path duration, average obstacle clearance, and total velocity changes. Comparisons are made against three baselines: A* (shortest path), Voronoi (max clearance), and envelope (outer boundary path). Sensitivity analyses vary cost weights to map trajectory behavior landscapes. Real-time risk adaptability is tested by incrementally increasing risk scores and observing resultant paths. Flight tests validate the approach on a scaled power line model.
Reproducibility: Simulations are performed on standard hardware (Intel i7 2.3GHz 8-core CPU), with results and an online demo available at the author's website (edu.louispetit.be). Code release status unclear. The real-world test uses the LineDrone UAV with computations on Jetson Xavier NX embedded board.
Example End-to-End Flow: Given LiDAR segmented obstacle data, the system constructs a 2D safety cost grid combining collision, hull, and damage costs. The planner constructs a 3D graph over (x,y,θ) states, attaches precomputed costs and velocities to edges, and runs A* to find a path minimizing the weighted sum J. Risk indices are updated in real time from sensory data (wind speed, GPS satellites), which dynamically adjust weights kS, kT, kE, modulating the planner's preference for safer or faster trajectories. The path is recomputed at ~50Hz enabling responsive trajectory adaptation for the UAV inspection mission.
Technical innovations
- Introduction of a novel risk-aware cost function integrating new damage and insertion costs reflecting potential crash severity and proximity inside obstacle zones.
- Adaptive speed planning framework that modulates UAV velocity based on flight direction and obstacle clearance for realistic energy and time modeling.
- Dynamic adjustment of multi-objective cost function weights in real time according to mission-specific risk indices (wind, communication, localization, battery) enabling smooth trade-off transitions.
- Discrete graph representation with motion primitives that facilitates efficient A* search over the SE(2) configuration space combining position and flight direction.
- Use of precomputed safety and velocity cost maps to enable near real-time trajectory replanning even on embedded hardware.
Datasets
- Hydro-Quebec power line inspection environments — 3 simulated environments representing 120kV and 315kV line configurations — reconstructed from official measurements, not public
- LineDrone flight test data — single real-world inspection mission on power line model — collected in-lab, proprietary
Baselines vs proposed
- A* (shortest path): path length normalized in range [min, max] baseline, coverage ~100%; MOAR: covers approx. 150% max path length range allowing safer paths
- Voronoi (max clearance path): average obstacle clearance ranked highest baselines; MOAR coverage about 90% of clearance range
- Envelope (outer boundary path): highest safety but longest path; MOAR trajectories smoothly interpolate between envelope and A* behaviors through coefficient tuning
Figures from the paper
Figures are reproduced from the source paper for academic discussion. Original copyright: the paper authors. See arXiv:2606.30575.
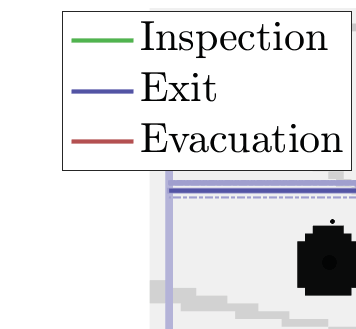
Fig 1: Example of a power line inspection mission: (a)
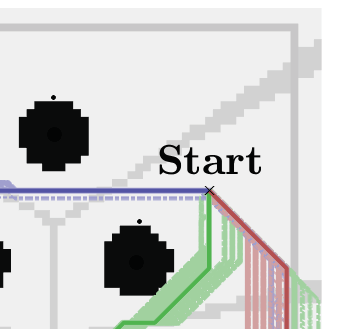
Fig 2: Safety cost grids with dmin = 1.2m and dmax = 3m.
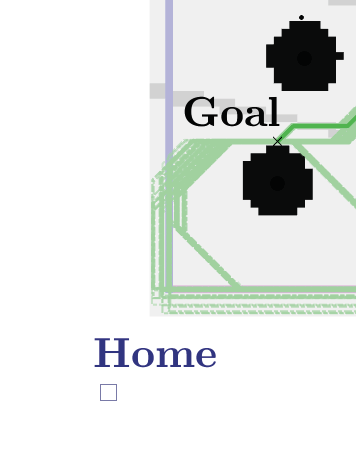
Fig 3: Assembled safety cost
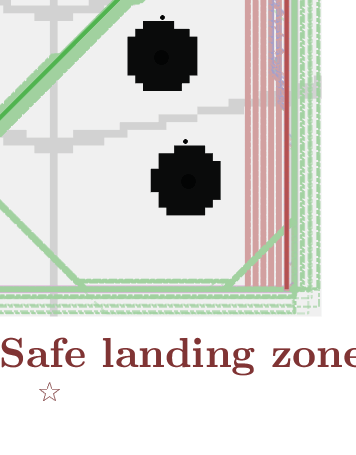
Fig 4: Variable speed grid
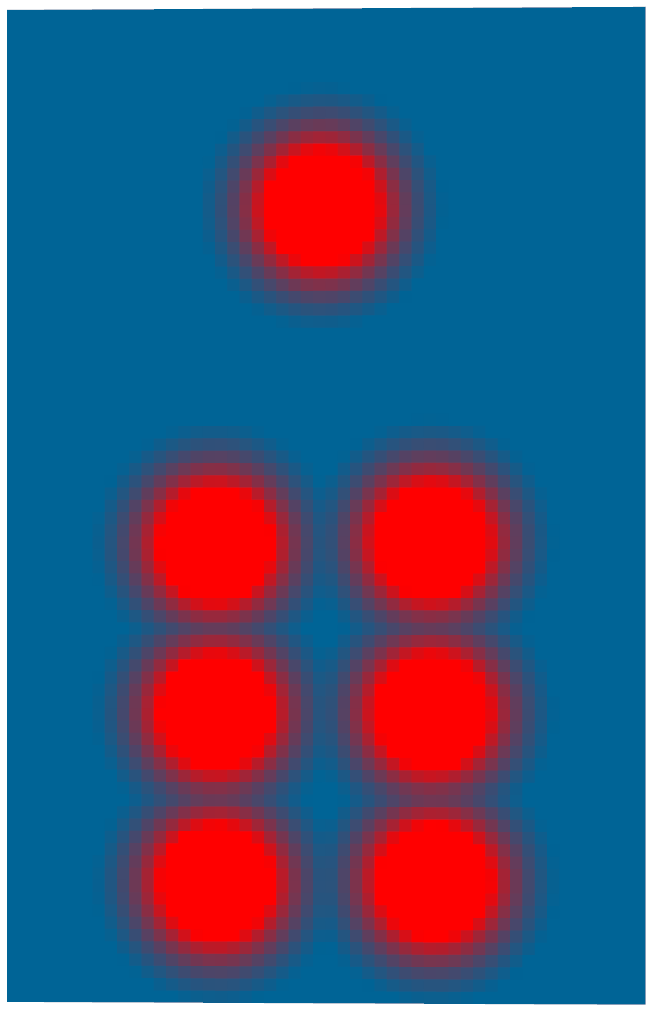
Fig 5: Representation of the graph with (a) the 9 possible
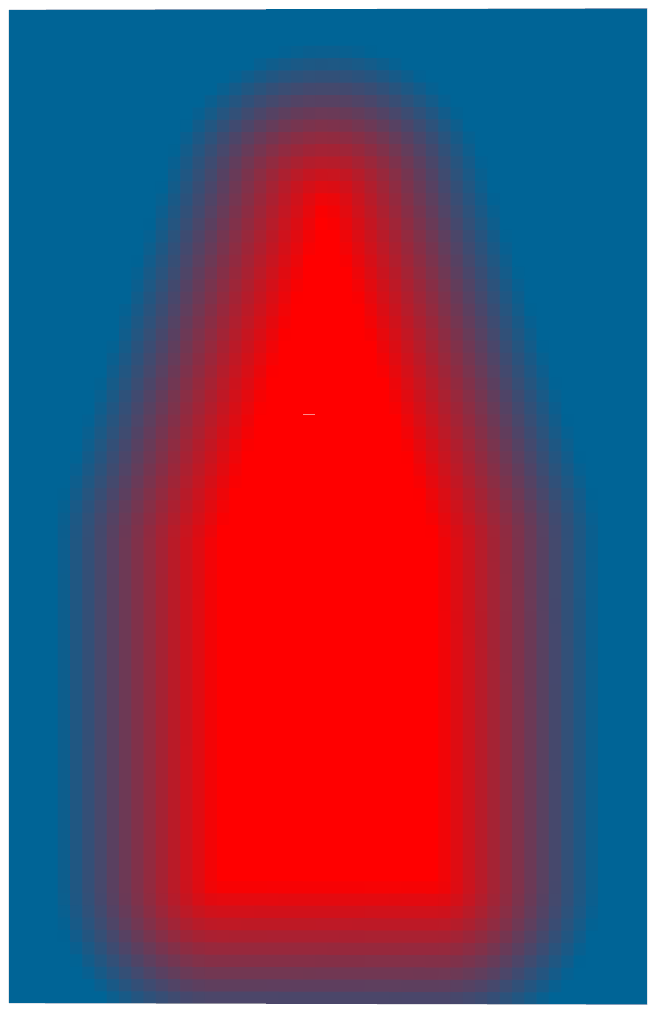
Fig 6: Path comparison and sensitivity analysis. The oc-

Fig 7: Trajectory metrics comparison in Env. 2.
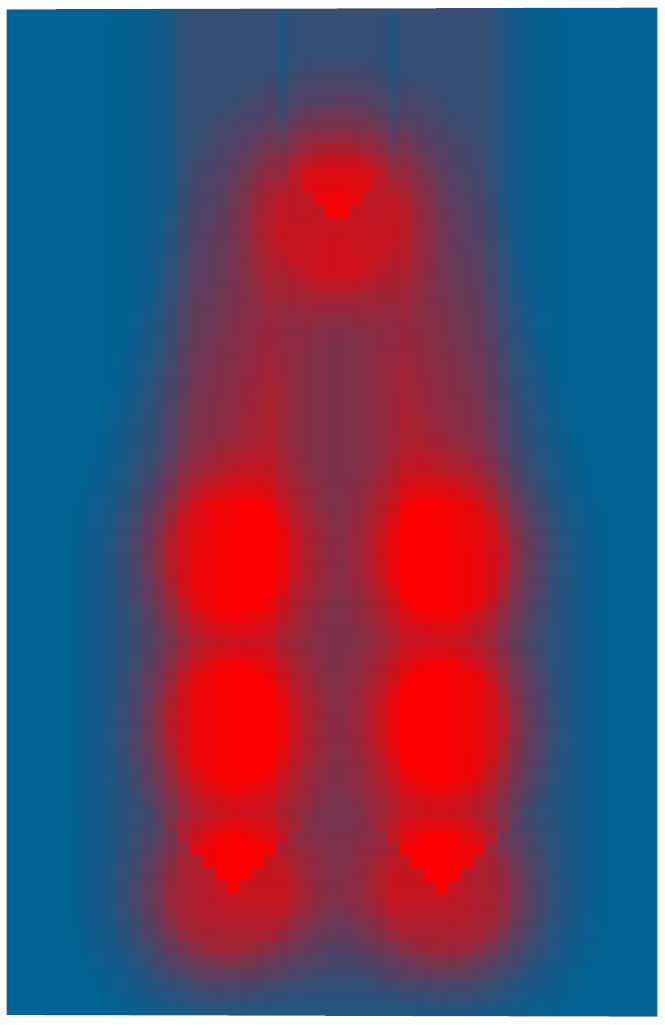
Fig 8 (page 3).
Limitations
- Simplifies environment to 2D vertical plane for planning, which may limit applicability in fully 3D scenarios with complex dynamics.
- Energy consumption model approximates steady-state consumption and acceleration cost, lacking detailed physics or learned energy predictors.
- Risk indices are empirically defined and linearized, potentially limiting precision in highly nonlinear operational conditions.
- No explicit adversarial or adversarial robustness evaluation; dynamic risks represent environmental uncertainty rather than intelligent attackers.
- Graph-based discrete search may struggle to scale to very large 3D environments or continuous trajectory spaces without further optimization.
- Flight tests limited to scaled models in controlled environments; generalization to real large-scale infrastructure inspections remains to be demonstrated.
Open questions / follow-ons
- How to extend the planner to fully 3D environments and incorporate dynamic UAV motion/acceleration constraints?
- Can data-driven or physics-based energy consumption models improve the accuracy of the energy cost and lead to more efficient trajectories?
- How would the planner perform under adversarial perturbations or spoofing attacks on GPS/communication channels?
- What continuous path representations (e.g., NURBS) and alternative solvers could be integrated to overcome limitations due to discretization and improve scalability?
Why it matters for bot defense
For bot-defense and CAPTCHA practitioners, this paper showcases how adaptive multi-objective optimization can leverage real-time risk assessment to modulate navigation strategies dynamically. Although focused on UAV inspection, the underlying principles of integrating heterogeneous risk factors into a tunable cost function and supporting real-time replanning with precomputed risk maps parallel challenges in bot detection frameworks that must adapt defenses based on changing threat levels. The discrete graph and motion primitive approach also highlight strategies to balance computational demands with responsiveness, relevant when deploying adaptive CAPTCHA schemes under diverse attack conditions. Additionally, the concept of damage cost and insertion cost could inspire analogous metrics measuring bot impact or success probability, suggesting avenues for multi-objective balance between user friction, security, and operational efficiency.
Cite
@article{arxiv2606_30575,
  title={ MOAR Planner: Multi-Objective and Adaptive Risk-Aware Path Planning for Infrastructure Inspection with a UAV },
  author={ Louis Petit and Alexis Lussier Desbiens },
  journal={arXiv preprint arXiv:2606.30575},
  year={ 2026 },
  url={https://arxiv.org/abs/2606.30575}
}