
Impact of Anomalous Microwave Emission (AME) on Radio Spectral Energy Distributions: SKA Observations of Galaxies Near and Far
Source: arXiv:2606.25830 · Published 2026-06-24 · By Ilsang Yoon, Eric Murphy, Caroline Bot, Lucie Correia
TL;DR
This work addresses the potential contamination of thermal free-free radio continuum emission, a key tracer of star formation rate (SFR) in galaxies, by anomalous microwave emission (AME) in the frequency range relevant to SKA-Mid observations (around 10 GHz). AME, thought to originate from electric dipole radiation due to spinning small dust grains, peaks around 30 GHz and can overlap with free-free emission frequencies, raising concerns about biasing SFR measurements at single frequencies. The authors model the flux densities of free-free emission and AME based on ISM physical conditions, galaxy redshift, observing beam size, and hydrogen column density, incorporating the increasing cosmic microwave background energy density at high redshift.
Using analytic relations to link gas surface density to free-free emission and applying a modified SpDust model for AME emissivity, they simulate radio spectral energy distributions (SEDs) for nearby and distant galaxies observed by SKA-Mid Band 5b. The model is validated by fitting data from a localized region in NGC 4725. Their results indicate AME's contribution to the total radio flux is generally negligible (<1%) for integrated observations of distant galaxies due to beam dilution and redshift dimming. However, for spatially resolved nearby galaxies observed at high angular resolution, the AME fraction can rise to several tens of percent, potentially biasing single-frequency SFR estimates.
Overall, the study concludes that while AME is usually a minor contaminant for SKA observations of distant galaxies, high-resolution observations of nearby systems resolving individual star-forming regions require multi-frequency approaches to disentangle AME and free-free emission. Detecting AME in distant galaxies at high redshift is challenging but may provide insights into the evolution of small dust grains.
Key findings
- For distant galaxies (z > 0.1), the AME fraction in total radio emission at SKA-Mid Band 5b frequencies (≈10–13 GHz) is <1%, making AME contribution negligible.
- Thermal free-free emission flux density scales roughly as N_H^1.4 (hydrogen column density), while AME scales as N_H^1, so AME fraction decreases with increasing column density (see Eq 6 vs Eq 9).
- For a 100 pc AME emitting region unresolved by 0.1–1.0 arcsec SKA beam, the AME fraction can reach a few ×10% at low redshift (z ≈ 0.01) in nearby galaxies, increasing with smaller beam size (Figure 5).
- The model SED fits well the observed radio continuum from a localized AME region in NGC 4725 with N_H ≈ 10^23 cm⁻2 and size ≈120 pc.
- Due to the (1+z)^4 dimming of flux and increase of CMB energy density, AME emissivity increases at high-z but flux still falls below SKA sensitivity limits for typical parameters beyond z ≈ 1 (Figures 2 and 3).
- At SKA-Mid Band 5b’s highest frequency (15 GHz), the peak of AME (~30 GHz rest-frame) lies outside the band, limiting its detectability from integrated galactic emission.
- High-angular resolution (<0.1 arcsec) and extreme sensitivity (~0.4 uJy/beam 3 sigma in 40h) would be needed to detect AME at z~1 from compact high-density regions (N_H ~ 10^23.8 cm⁻2).
Methodology — deep read
Threat Model & Assumptions: The adversary is not applicable as this is an astrophysical measurement study. The concern is measurement bias in star formation rate estimates when AME is present but not accounted for. Authors assume AME and thermal free-free emissions originate from regions with same hydrogen column density but note different spatial scales; free-free emission fills observing beam while AME region may be smaller.
Data: This is a modeling study with validation on sparse observational data from localized AME detections in two nearby galaxies (NGC 4725 and NGC 6946). The authors use literature values for gas surface density, hydrogen column density, and ISM phases, with observations from Murphy et al. (2018) among others.
Architecture/Algorithm: The authors derive an analytic model for free-free emission flux density as a function of star formation rate surface density and gas column density using Kennicutt (1998) and Murphy et al. (2011) relations. For AME, they use the SpDust code to compute emissivity per hydrogen atom accounting for ISM physical parameters (electron density, temperature, radiation field strength) and modify the radiation field energy density by including redshift-dependent CMB energy density (increasing with (1+z)^4).
Inputs: Observing frequency (1–100 GHz), redshift (z=0.01 to 2), hydrogen column density, ISM phase (cold neutral medium, warm neutral medium, warm ionized medium, photo-dissociation region), observing beam size (0.1–1 arcsec).
Outputs: Predicted flux densities of free-free emission and AME, combined SEDs, and AME fraction in total flux.
Training Regime: Not applicable as this is not a machine-learning model but an analytic and computational modeling approach. Computation involves running SpDust with modified inputs for radiation field energy density.
Evaluation Protocol: Model validation includes fitting the composite SED to multi-frequency radio data from NGC 4725's AME region (Murphy et al. 2018). Sensitivity limits and angular resolutions from SKA-Mid AA4 baseline design are used to interpret detection feasibility. AME fractions are analyzed as a function of redshift, beam size, ISM parameters. No explicit statistical tests or cross-validation. The study considers scenarios with and without AME region filling factor correction.
Reproducibility: The SpDust code is publicly available; authors mention a modified version for their radiation field treatment but do not specify code release. Data from published observations are referenced. Analysis is reproducible in principle by combining the analytic equations given with SpDust emissivity outputs.
A Concrete Example: For a local galaxy at z=0.001, thermal free-free emission filling a 1 arcsec beam and AME from a 100 pc region (N_H = 10^22 cm^-2) were modeled using SpDust under different ISM phases. The PDR phase shows strongest AME emission but is spatially very small, reducing its net contribution. Applying the model to NGC 4725 reproduces observed SED features, including the AME bump around 30 GHz, validating the parameter choices and approach.
Technical innovations
- Integration of redshift-dependent CMB energy density into the SpDust AME emissivity model to model AME fluxes at high redshift.
- Analytic framework combining gas surface density, star formation rate, and hydrogen column density to predict free-free emission flux density as a function of observing beam size and redshift.
- Quantitative modeling of the filling-factor mismatch between compact AME regions and larger thermal free-free emission regions within a given telescope beam to assess AME contamination.
- Use of combined SED models applied to extragalactic galaxies across redshift leveraging SKA-Mid instrumental parameters to provide observing strategy guidelines.
Datasets
- NGC 4725 localized AME region – observational radio continuum multi-band data from Murphy et al. (2018) – public archival VLA data
- NGC 6946 galaxy integrated AME measurements – from Murphy et al. (2015) – public archival data
Baselines vs proposed
- Integrated galaxy observation at z=0.1 with SKA-Mid Band 5b: AME fraction <1% vs total emission, indicating free-free dominates.
- Spatially resolved region in NGC 4725: model SED reproduces observed AME excess near 30 GHz with parameters N_H ~ 10^23 cm^-2 and region size 120 pc, supporting model accuracy.
- Different beam sizes (0.1, 0.3, 1 arcsec) for fixed 100 pc AME region lead to AME fractions ranging from <1% (1 arcsec) up to ~30% (0.1 arcsec) at z=0.01 (Figure 5), showing sensitivity to angular resolution.
Figures from the paper
Figures are reproduced from the source paper for academic discussion. Original copyright: the paper authors. See arXiv:2606.25830.

Fig 1 (page 1).
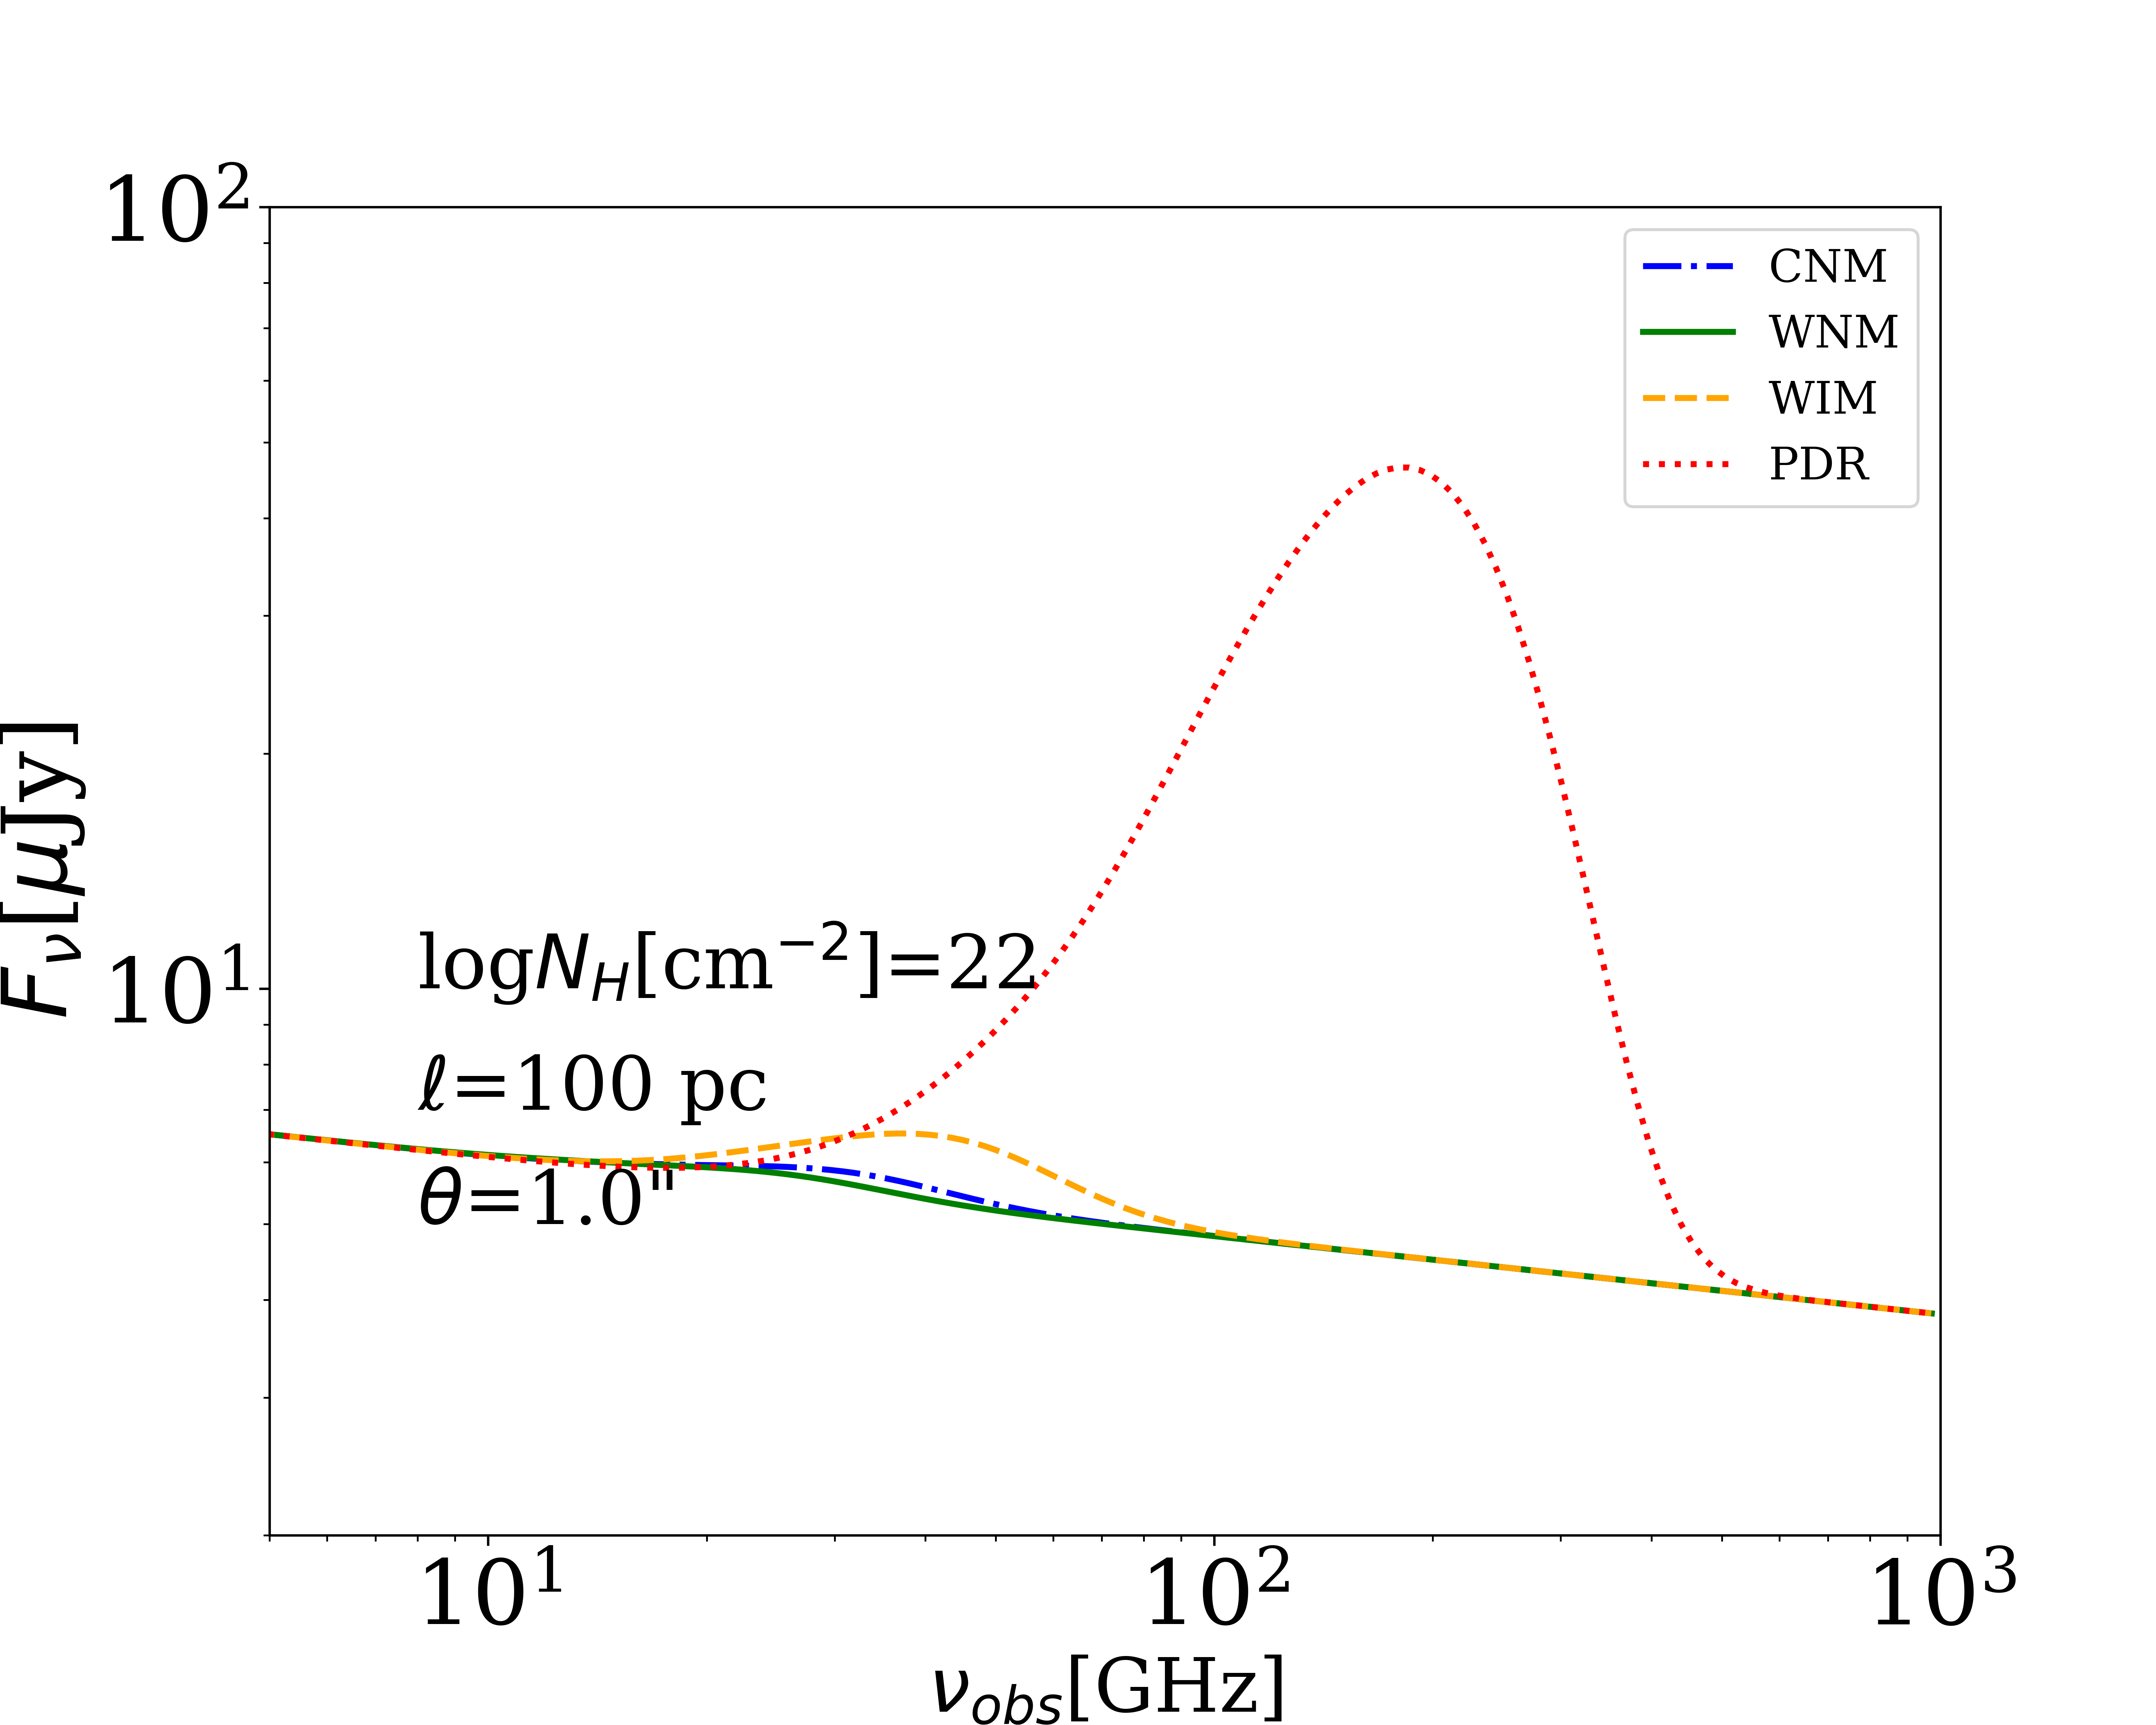
Fig 1: Left: Model radio continuum SED for a galaxy at 𝑧= 0.001 using different phases of the ISM for
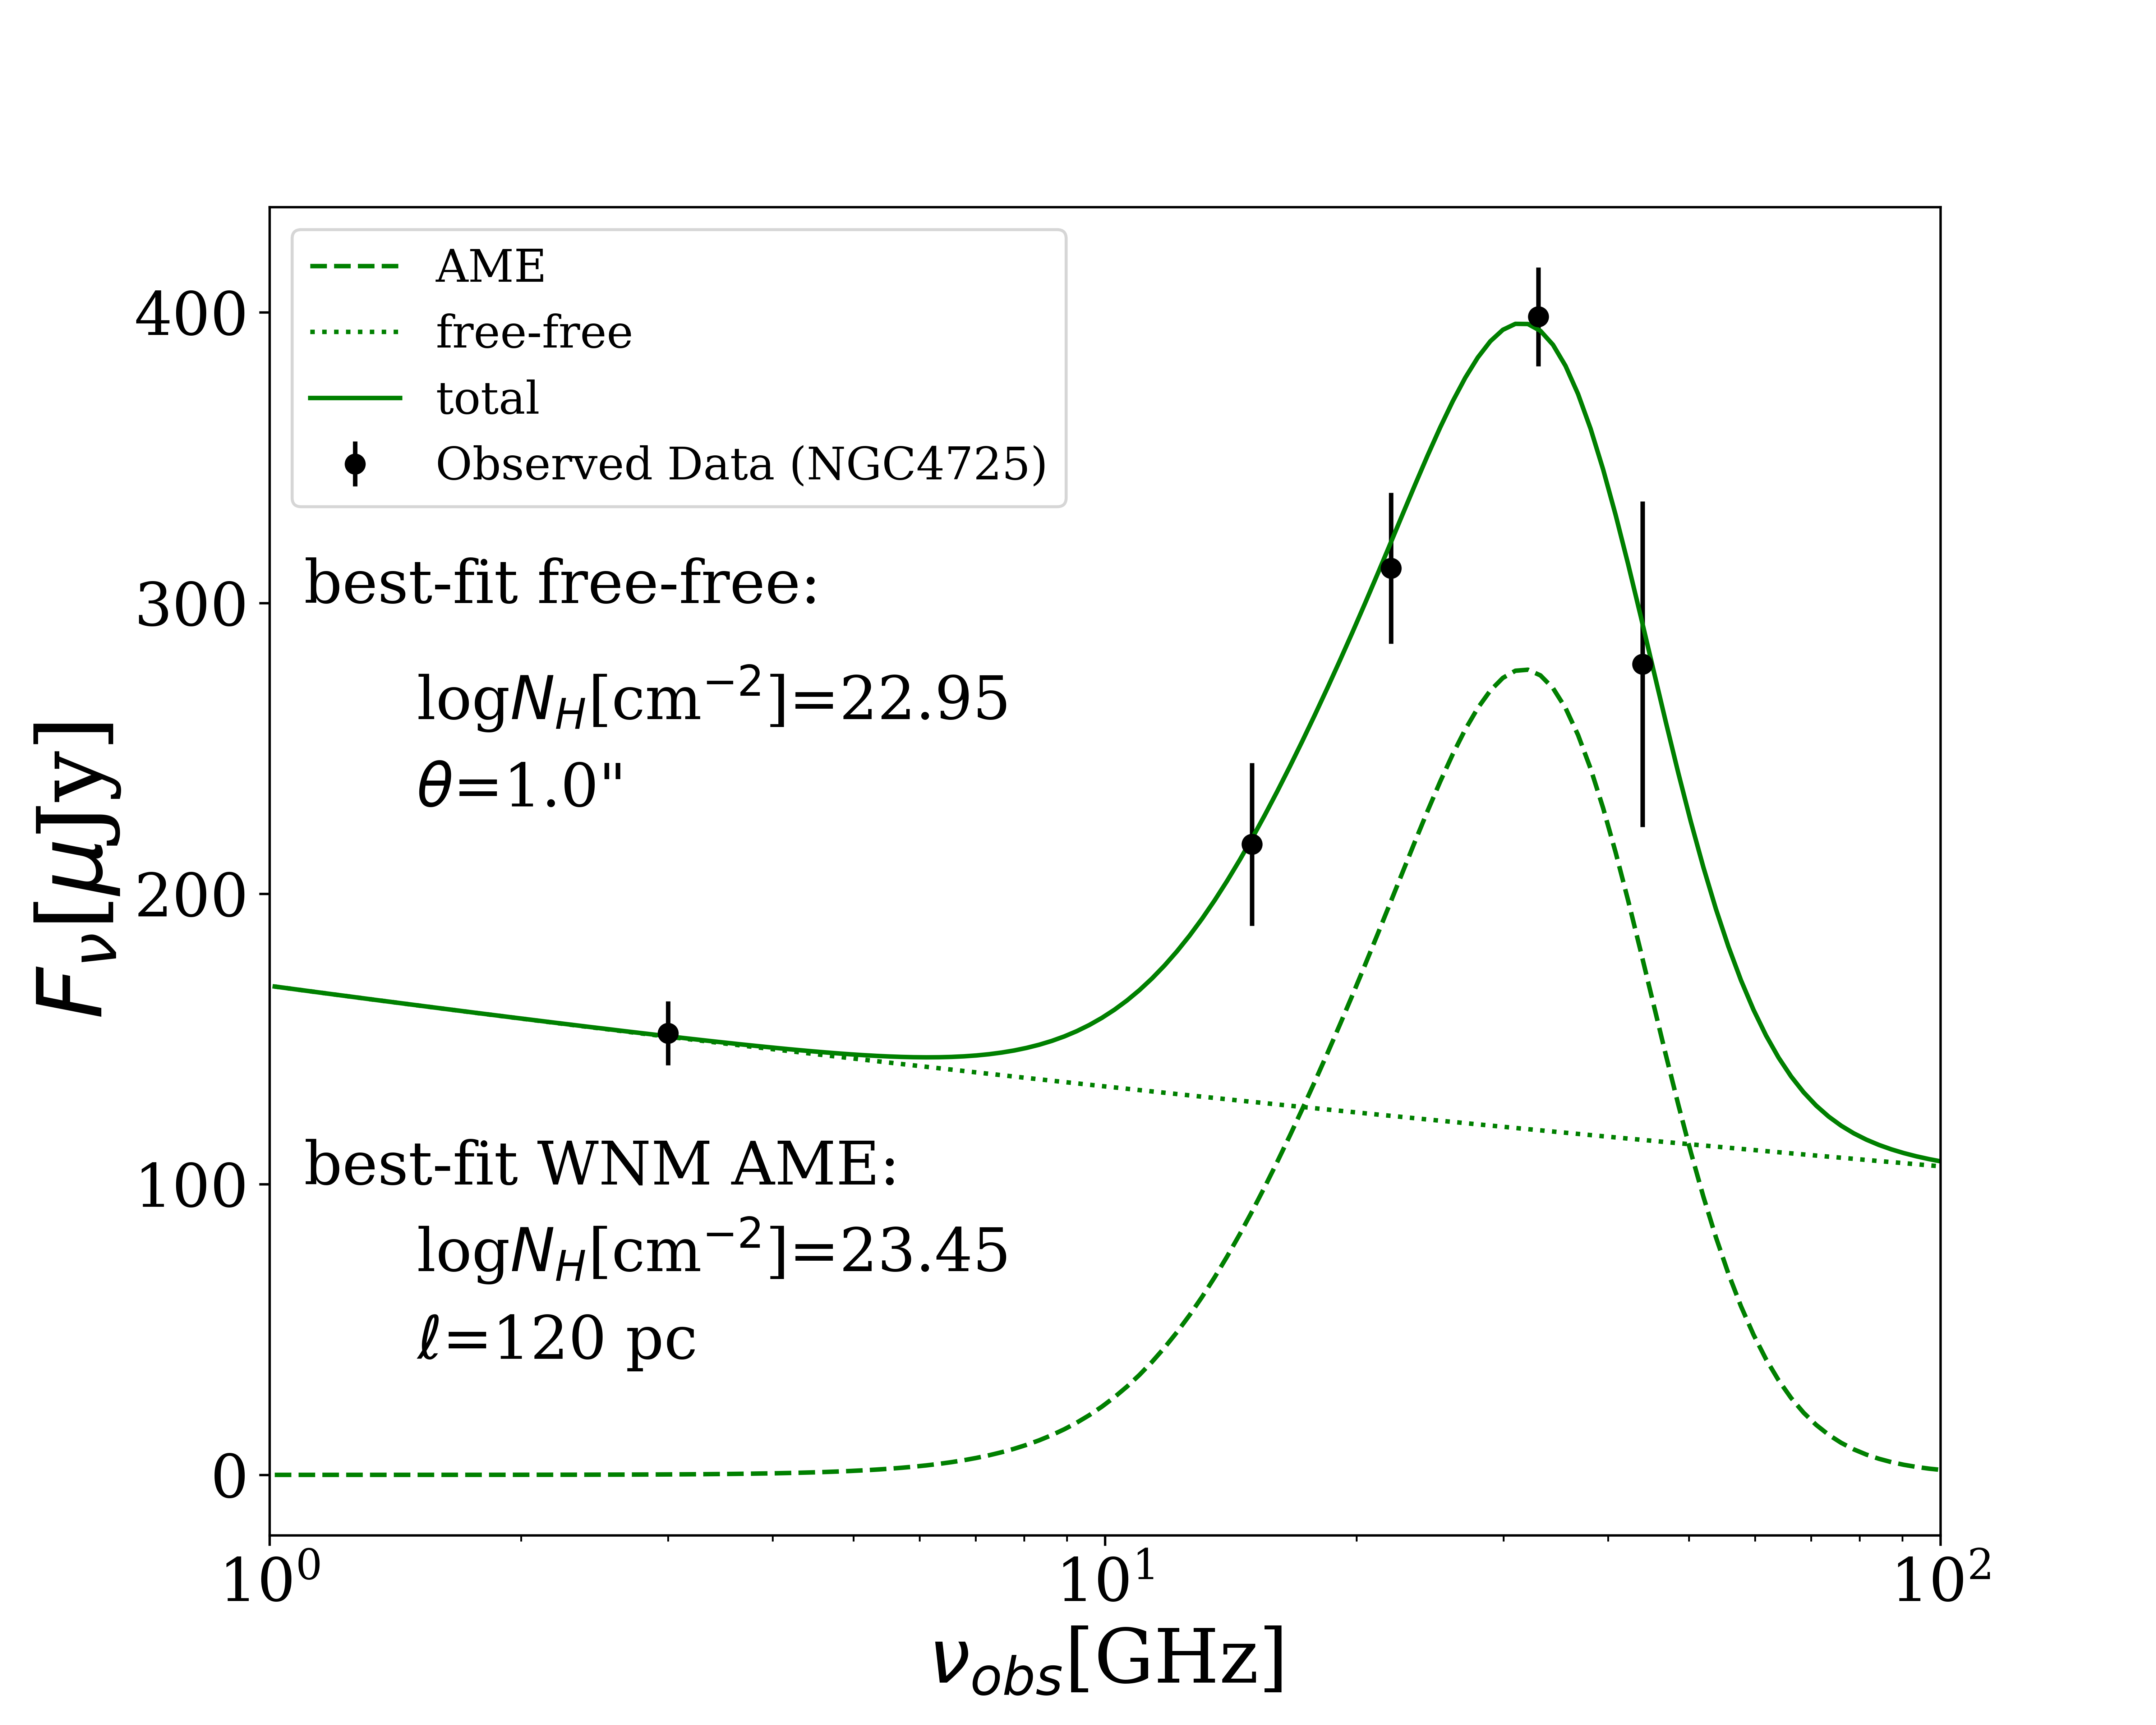
Fig 2: Left: Model SED observed with an 0.3′′ beam for 𝑧= 0.01, 0.1, 0.3, 1.0, 2.0 assuming AME from
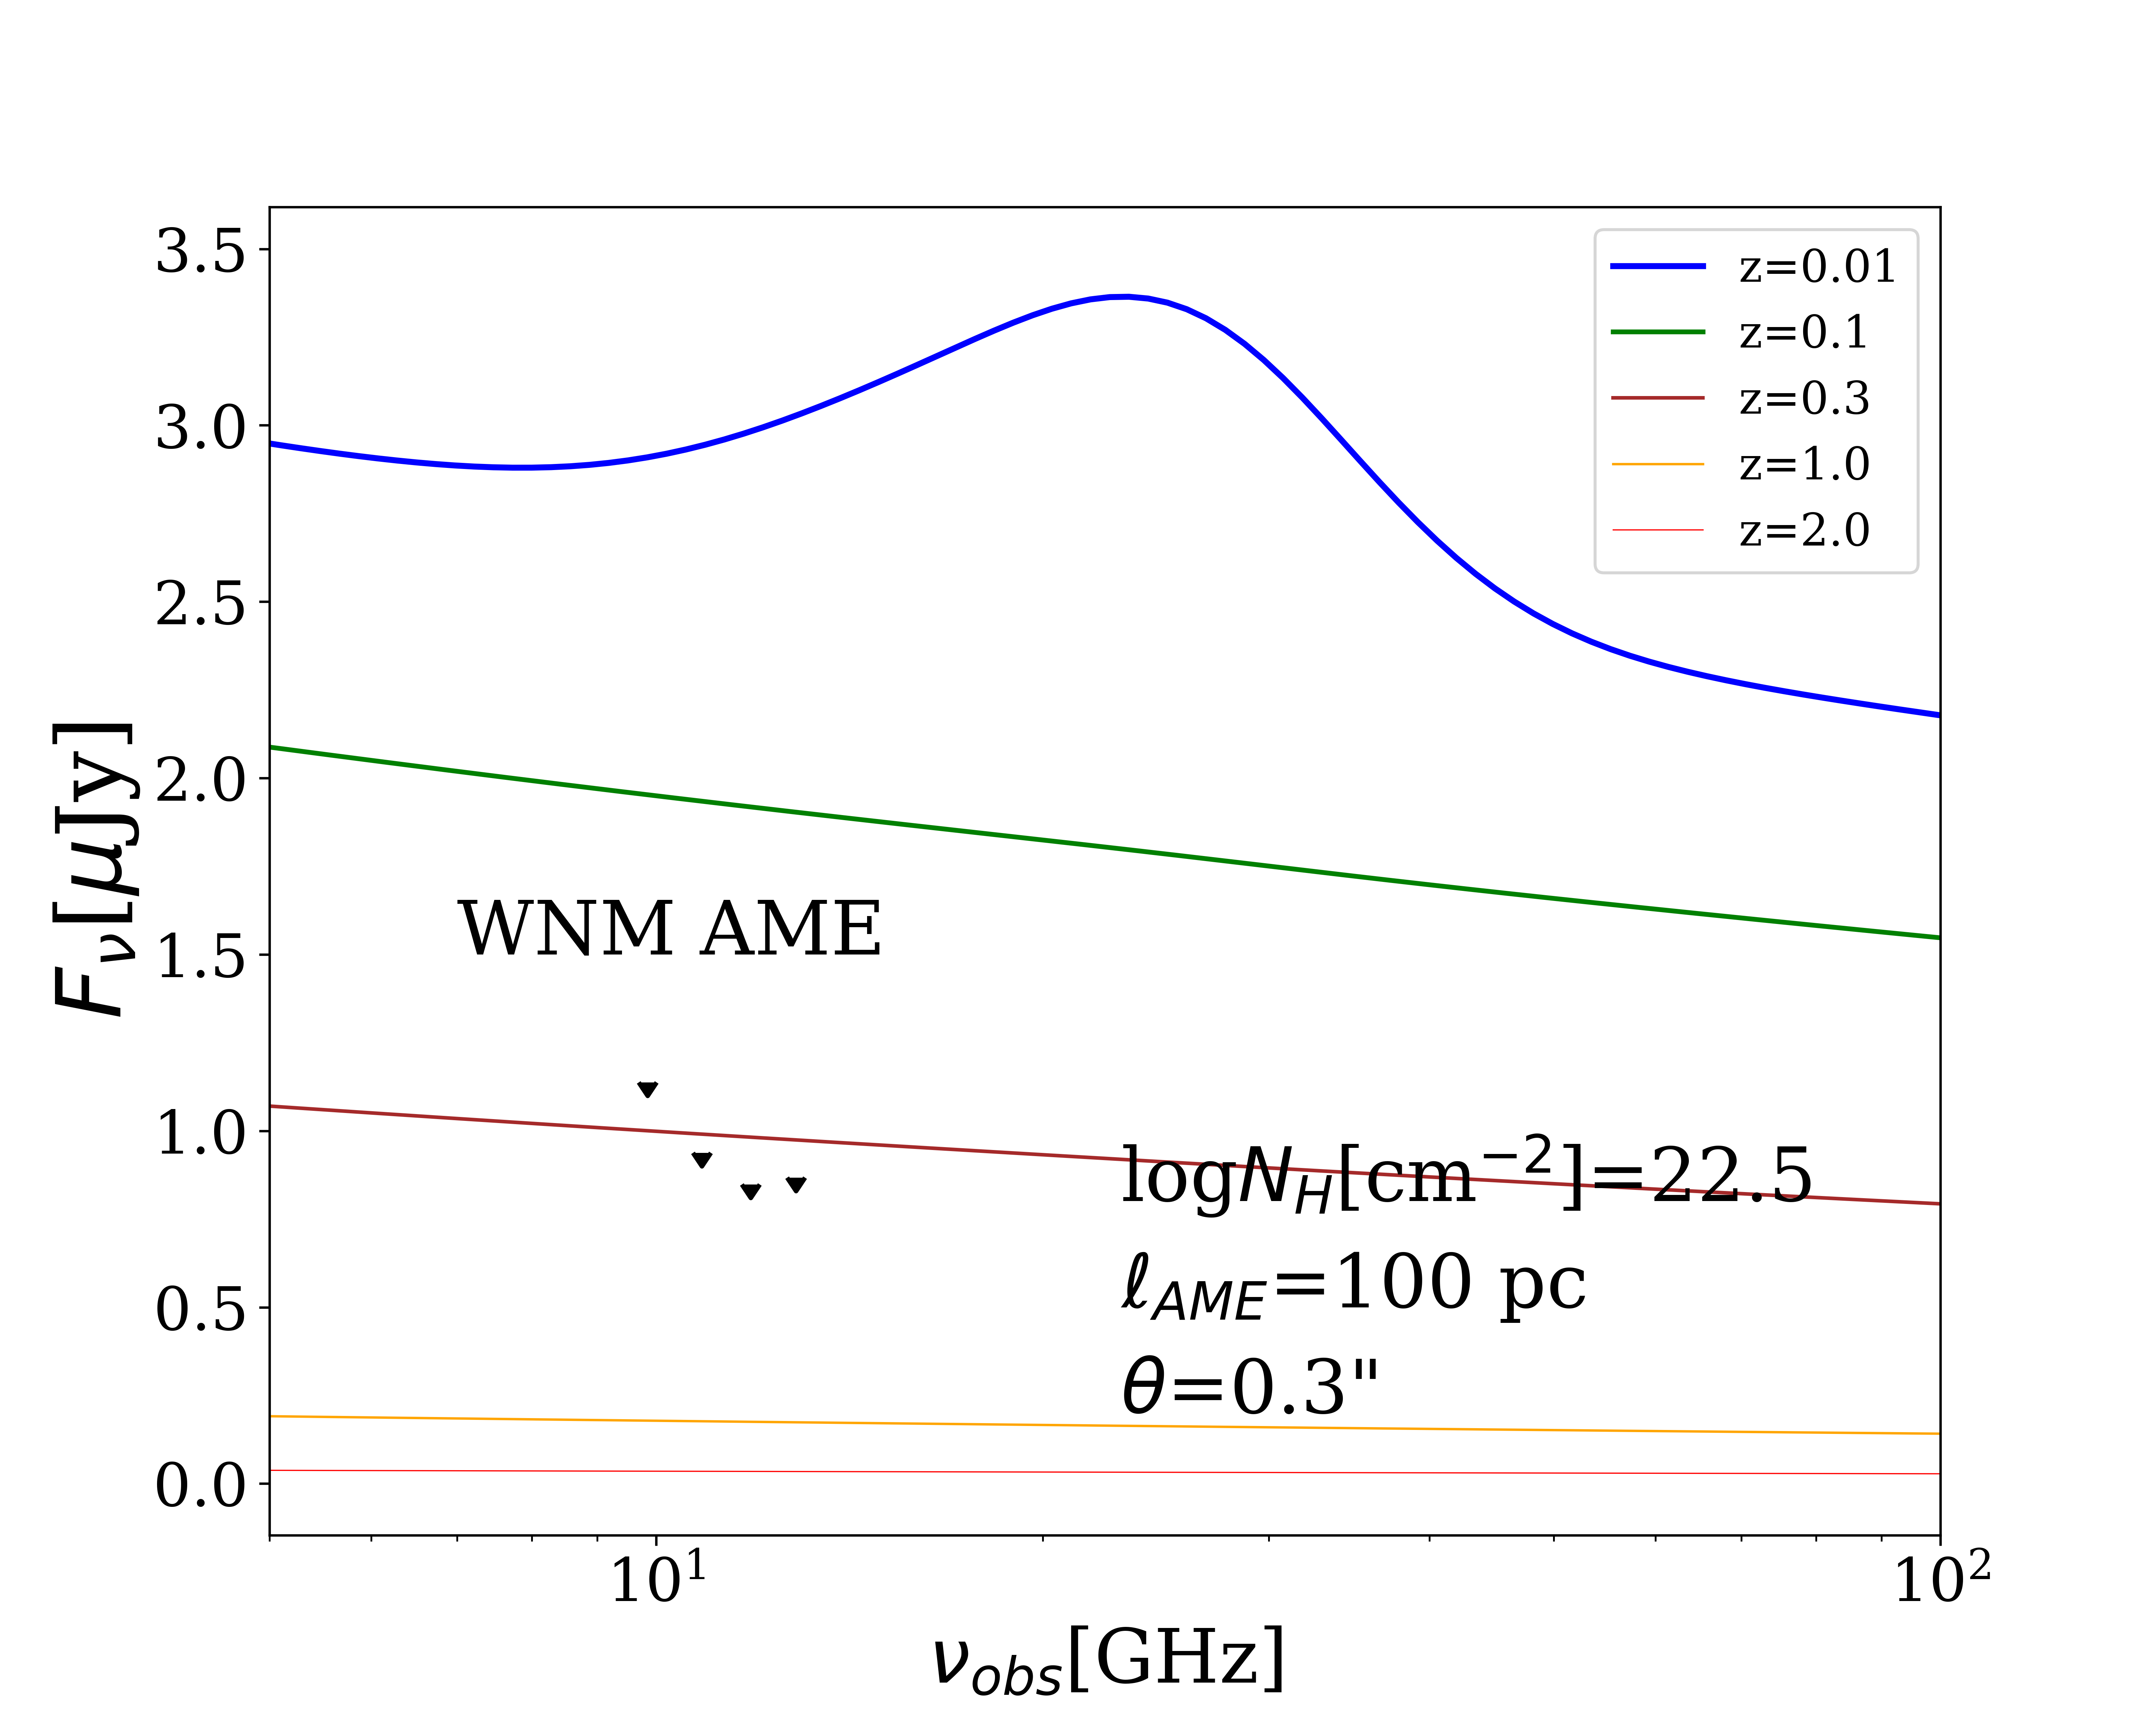
Fig 3: Left: Expected flux density of the model SED observed by 1′′ beam at the observing frequencies
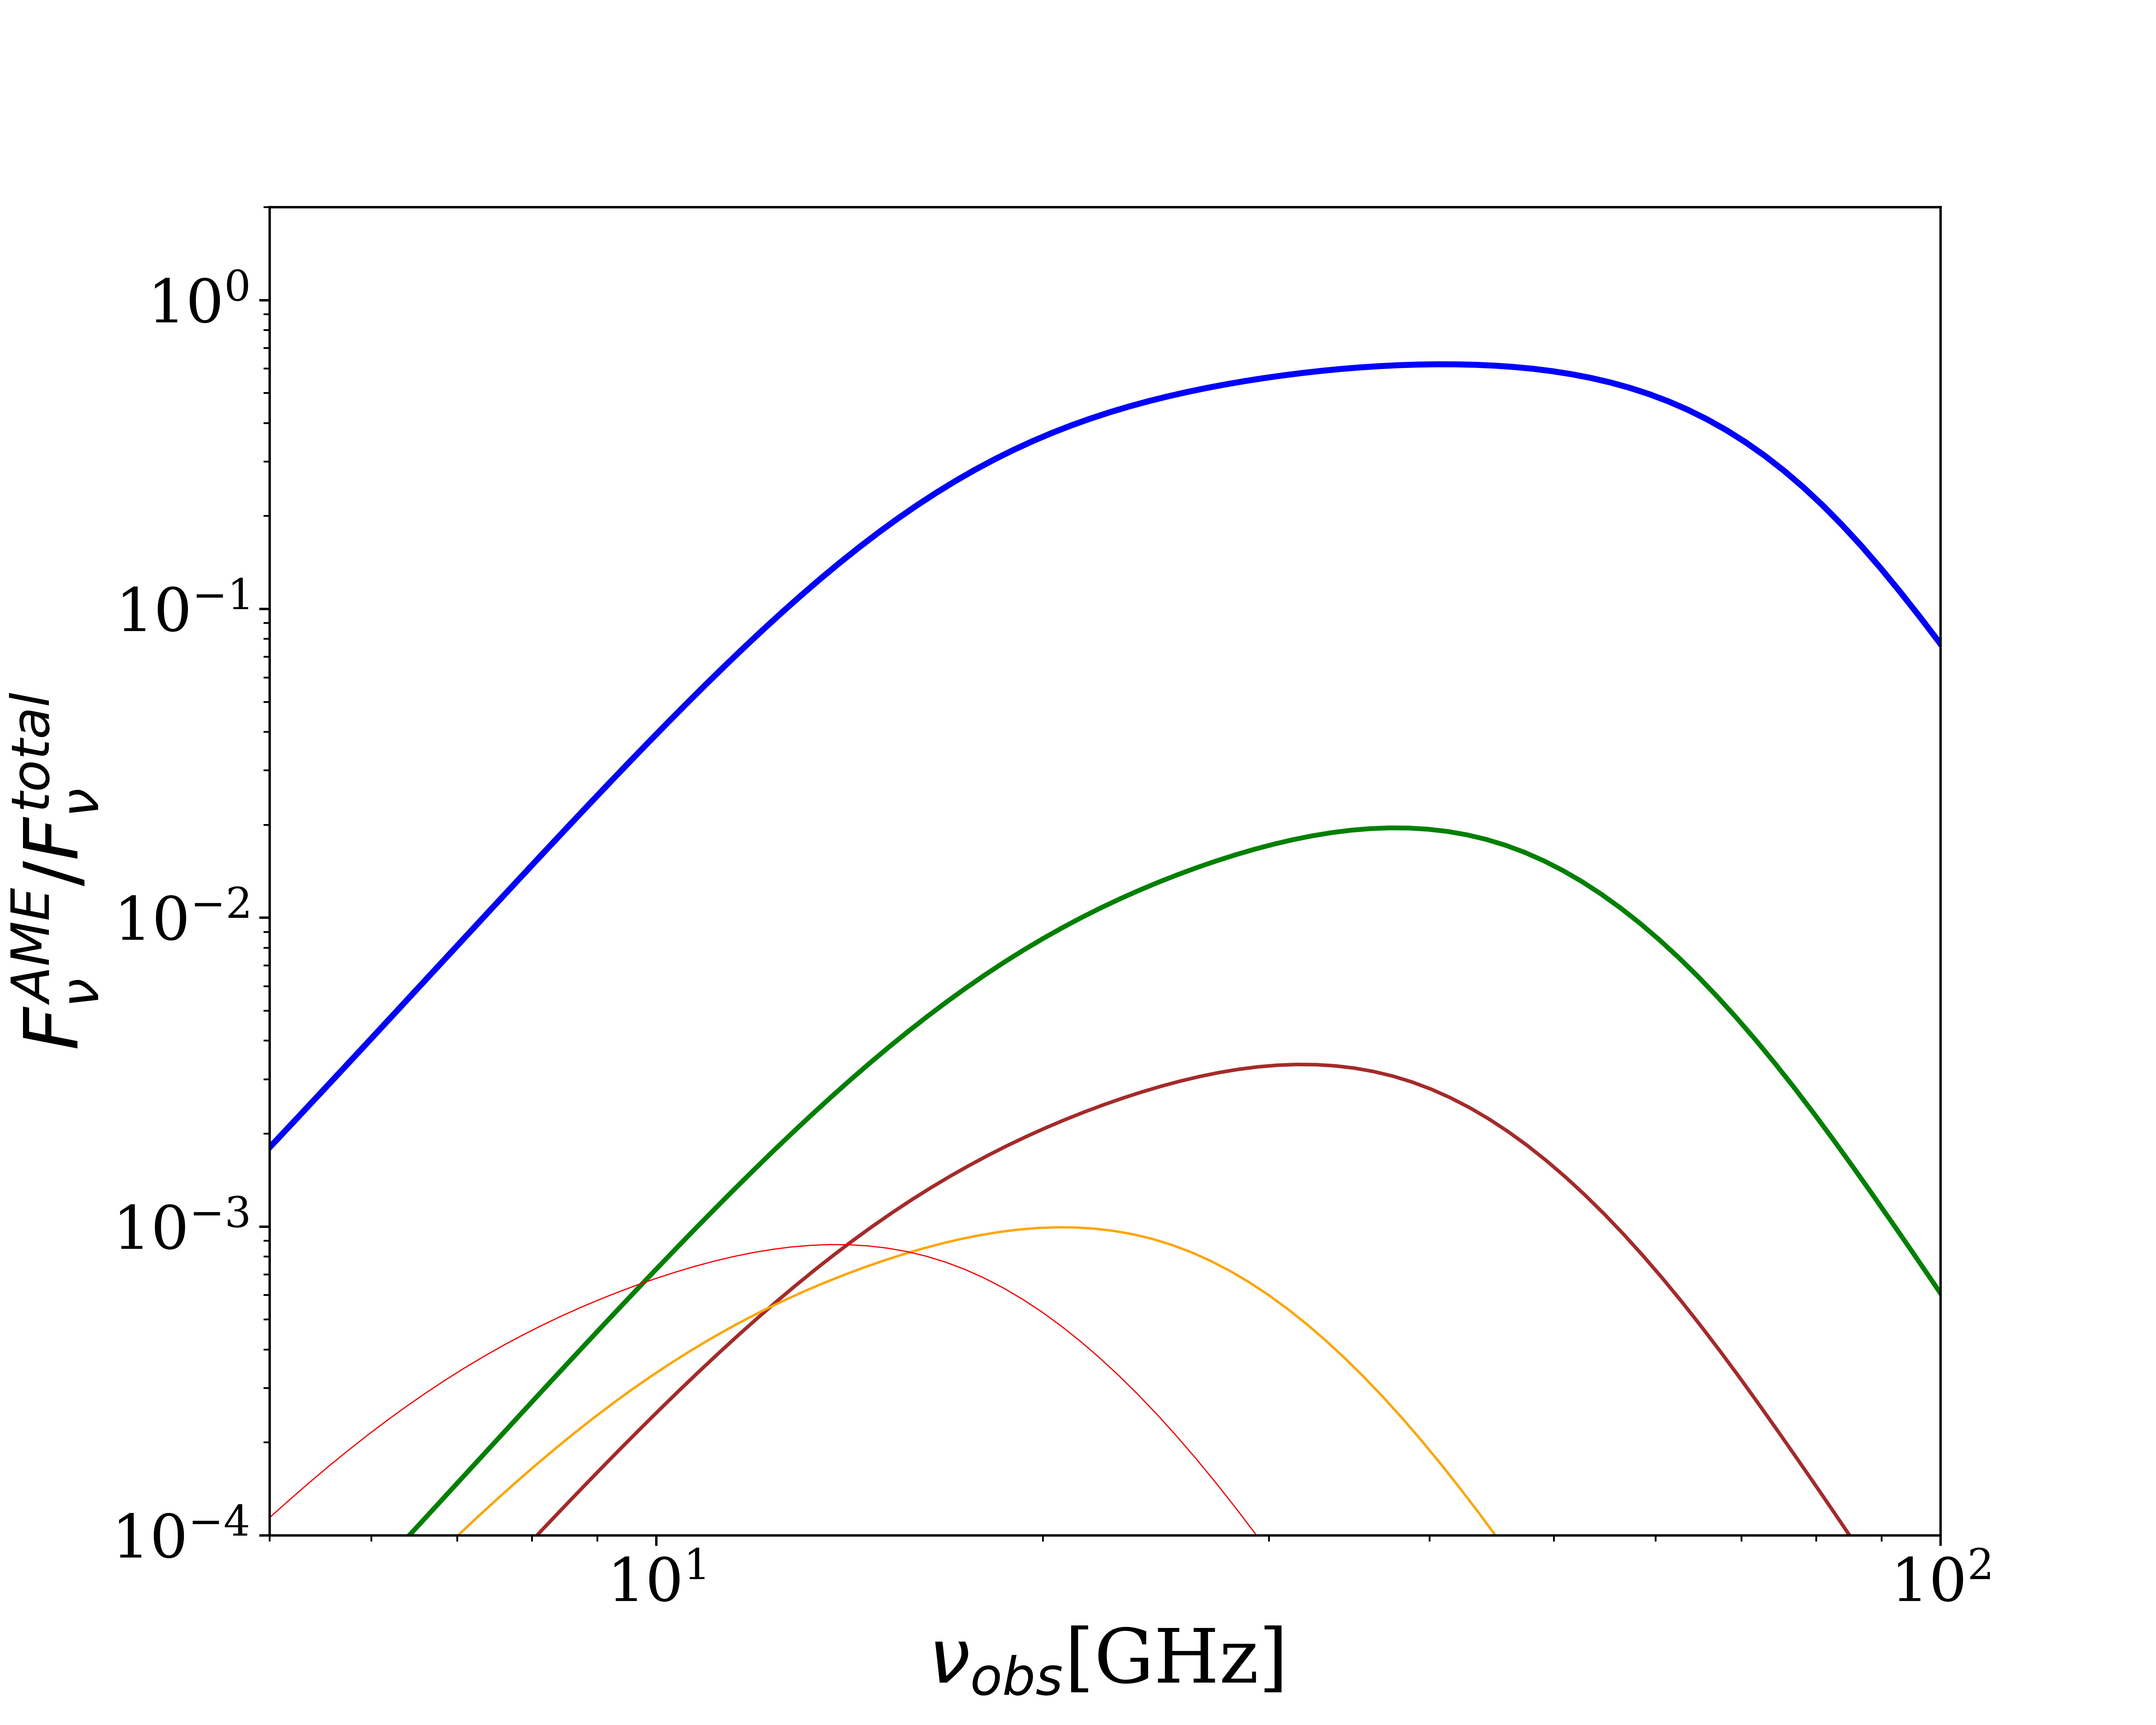
Fig 4: Expected flux density of the model SED observed with a 0.1 (left), 0.3 (middle), and, 1.0′′(right)
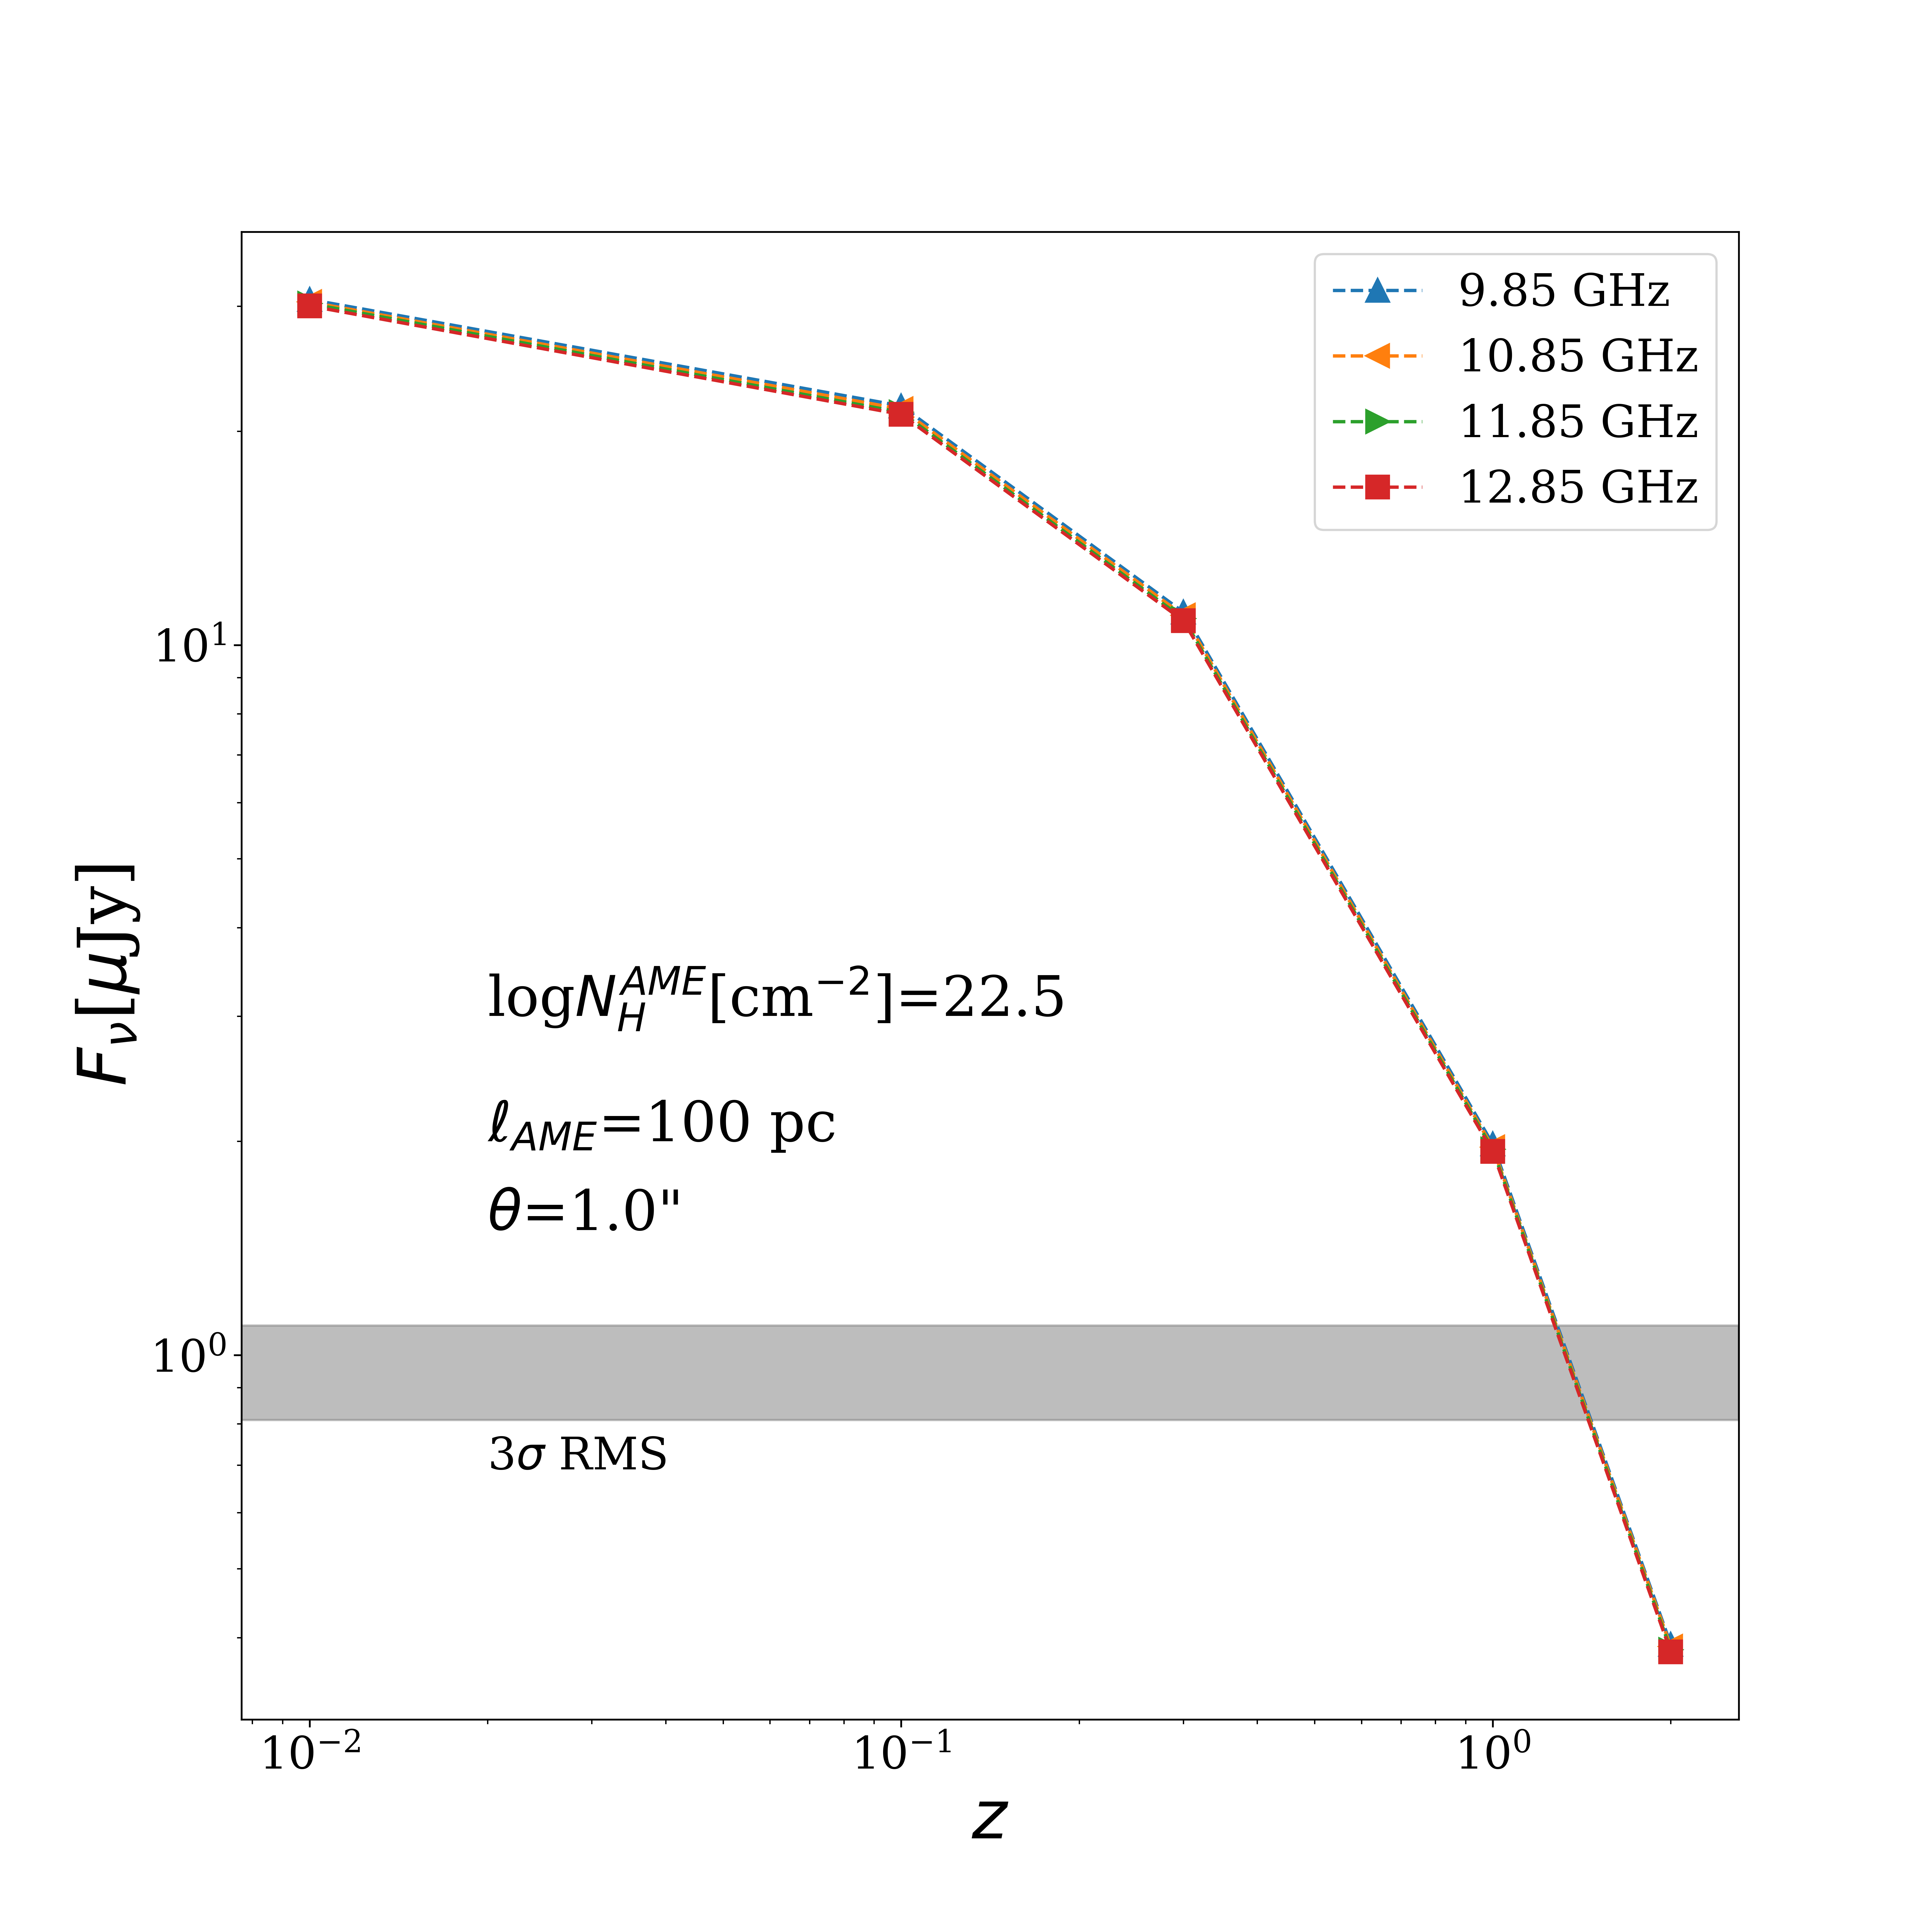
Fig 5: AME fraction for the same model SEDs used for Figure 4
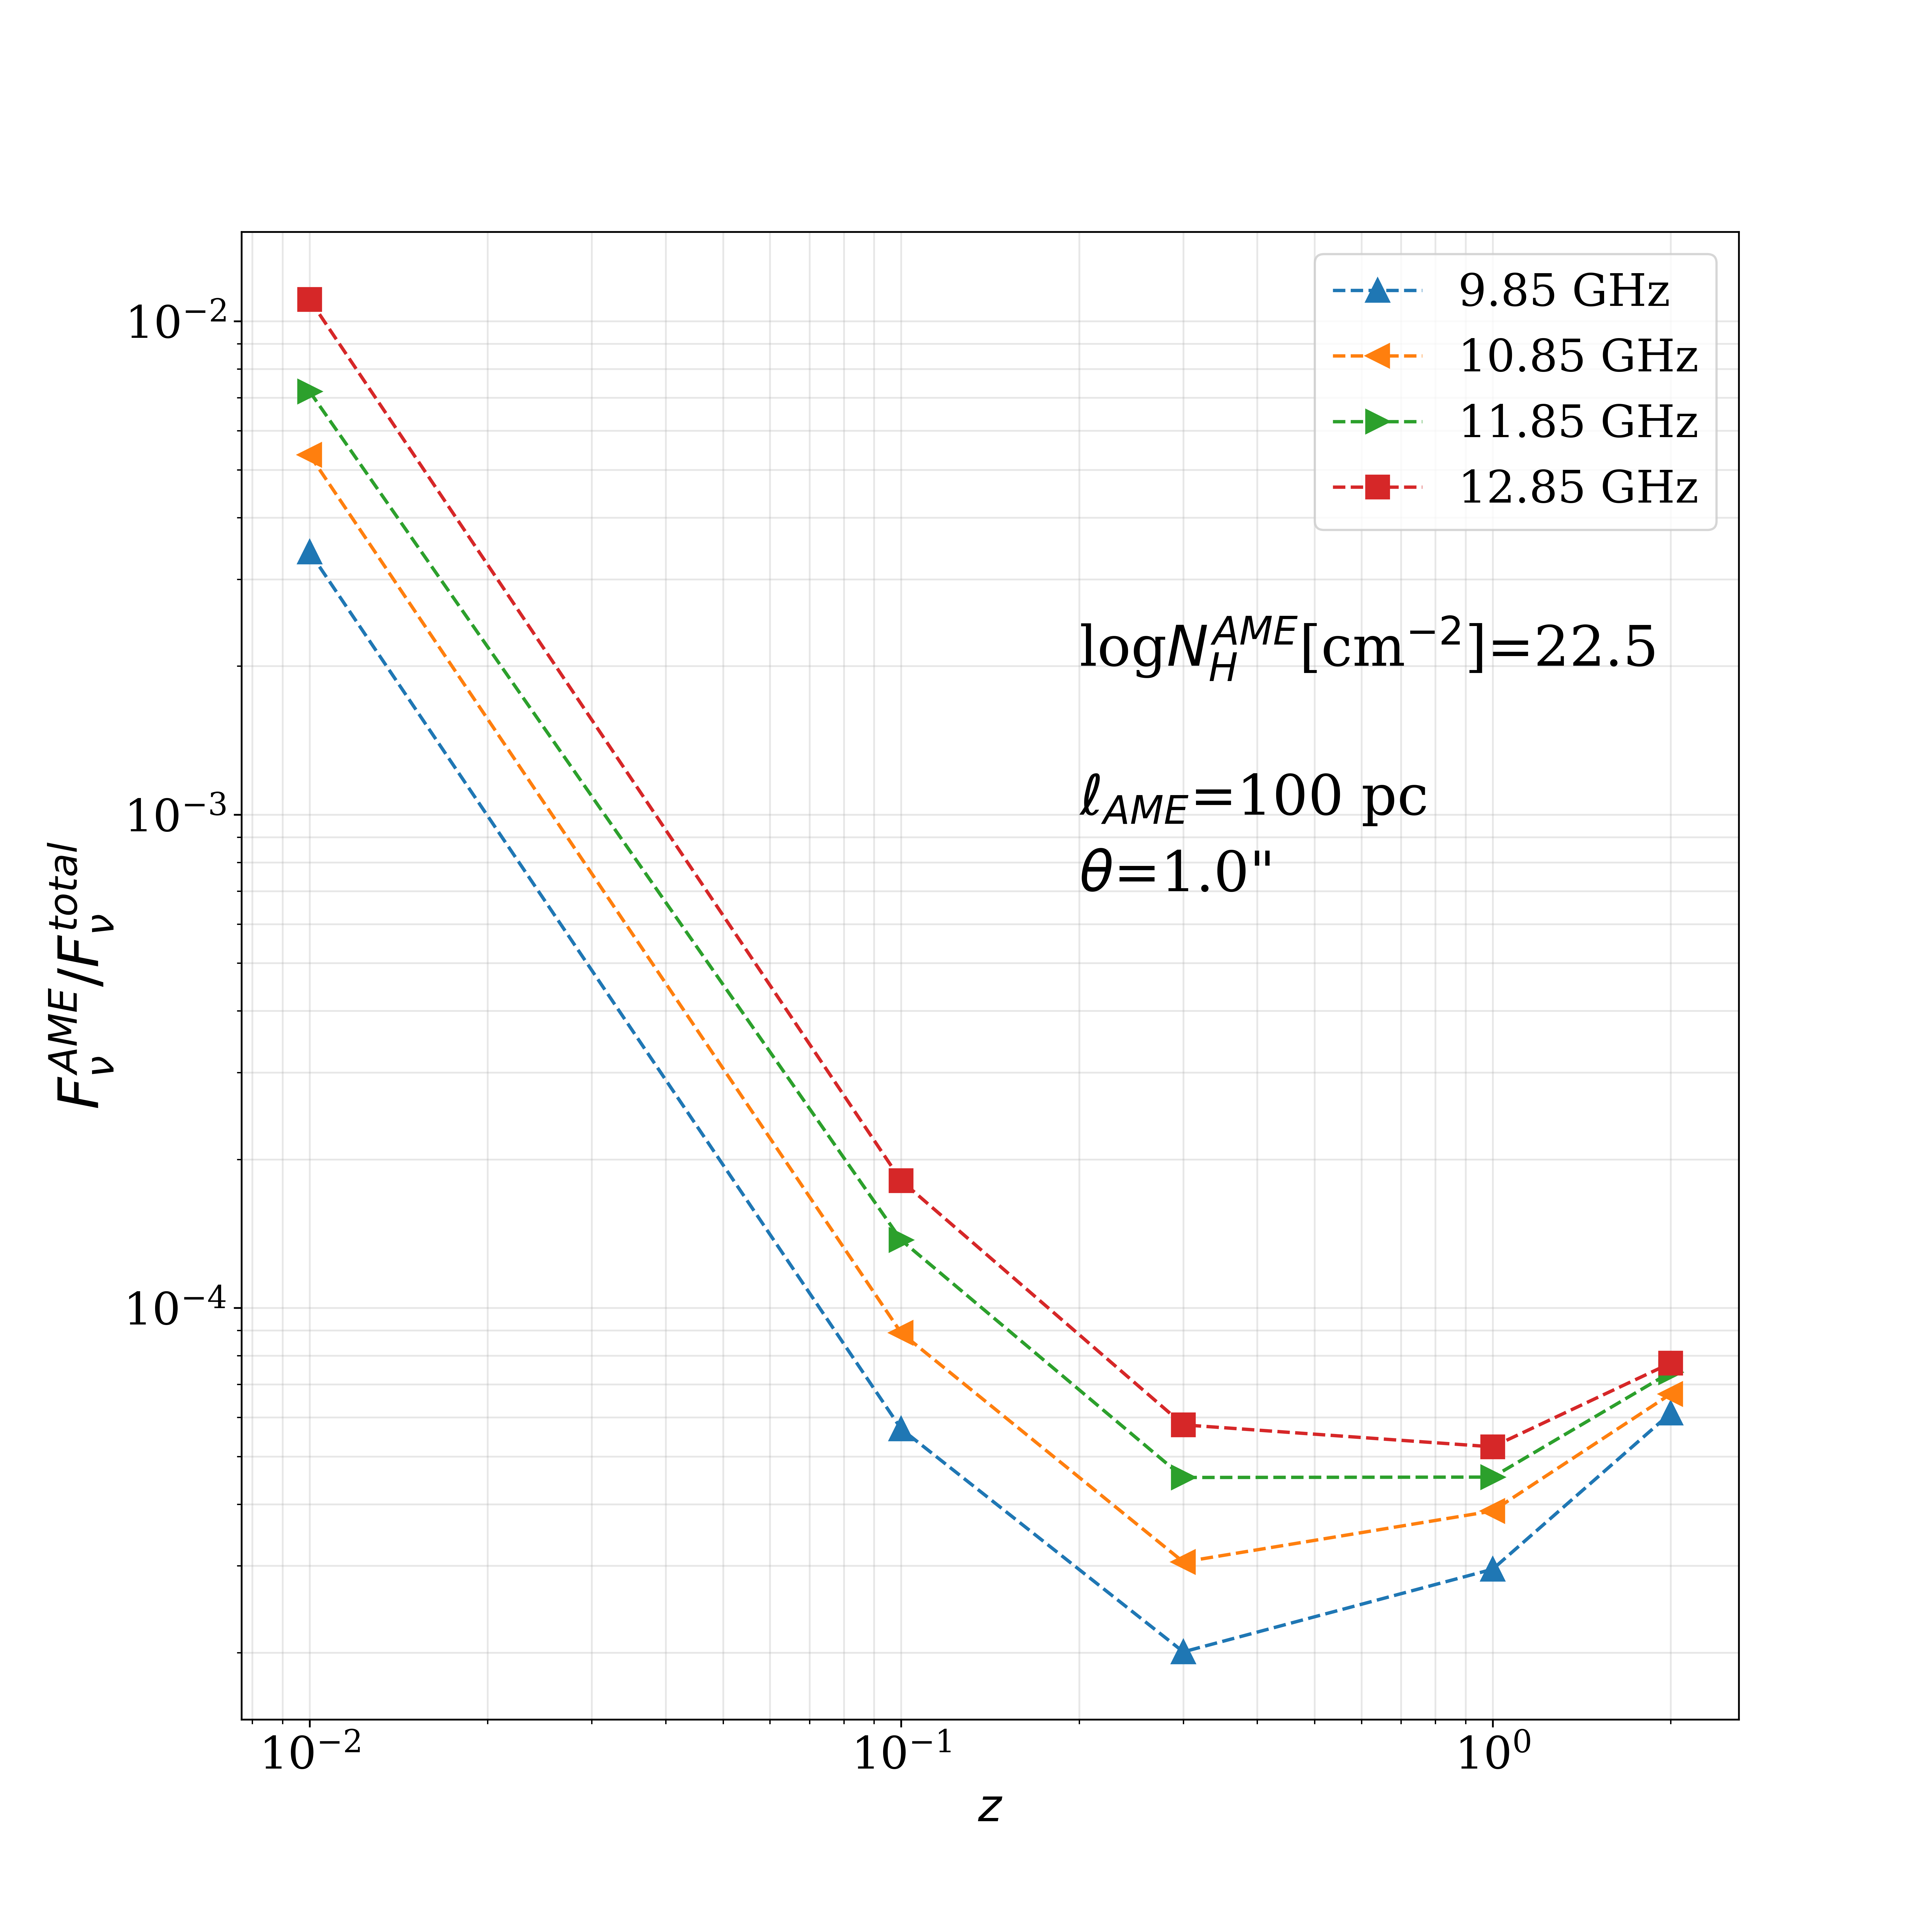
Fig 7 (page 9).
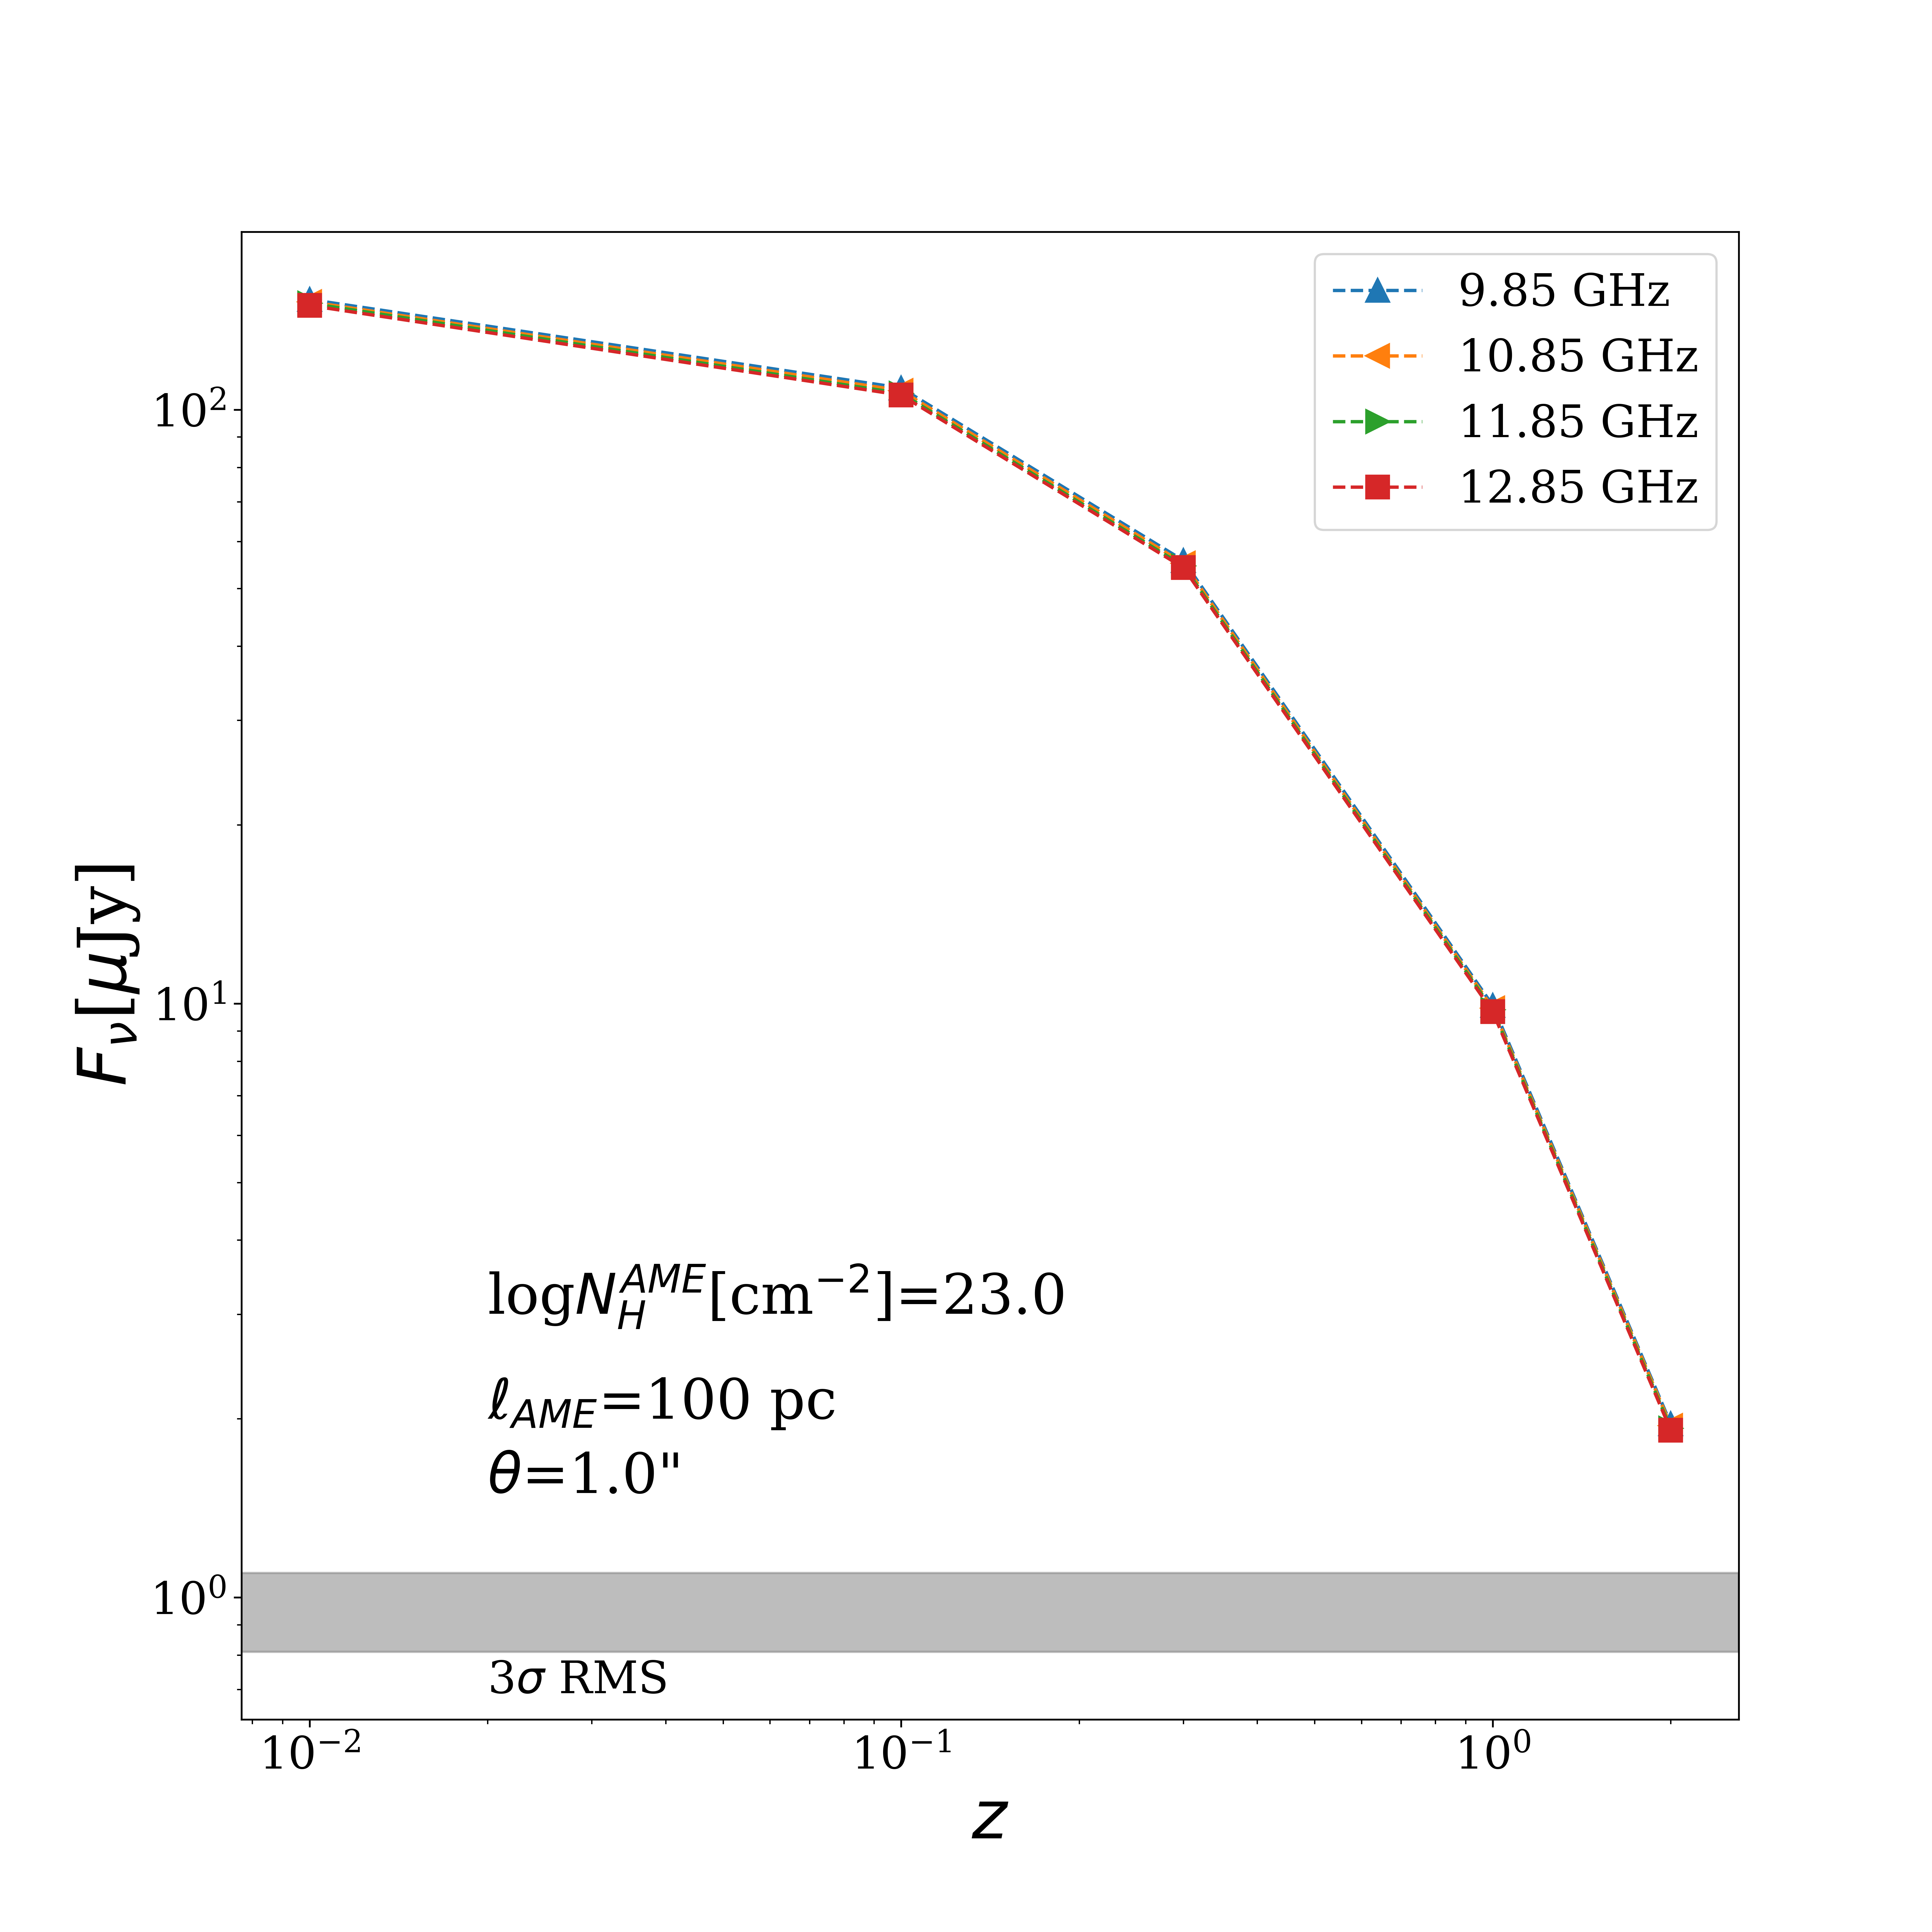
Fig 8 (page 10).
Limitations
- The model uses simplified cylindrical geometry and assumes equal hydrogen column density for free-free and AME regions, which may not capture complex ISM structure.
- SpDust model does not incorporate HI saturation in high-density regions, potentially leading to AME overprediction under extreme conditions.
- The analysis does not consider AME disruption mechanisms such as rotational disruption of small grains.
- Observational validation is limited to a few nearby galaxies with detected AME; extragalactic AME detections are sparse.
- No explicit treatment of synchrotron contamination or uncertainty in free-free optical depth at lower frequencies.
- No formal statistical uncertainty quantification or coverage of distribution shifts across galaxy types beyond parameter ranges tested.
Open questions / follow-ons
- What are the dominant carriers and physical environments responsible for AME variability across different galaxies and redshifts?
- Can improved AME models incorporate gas-phase saturation effects and grain disruption to refine extragalactic predictions?
- How might multi-frequency observations disentangle AME, free-free, and synchrotron components in complex star-forming regions?
- What is the feasibility of detecting AME peaks redshifted into SKA-Mid Band 5b for high-z galaxies with future deep observations?
Why it matters for bot defense
Bot-defense engineers relying on radio continuum emission SFR indicators for astrophysical source classification or anomaly detection should note that AME contamination is generally negligible for integrated, distant galaxy observations at ~10 GHz frequencies typical of SKA-Mid. However, for high angular resolution studies resolving star-forming regions, localized AME can contribute significantly and bias estimates if unaccounted for. This implies that multi-frequency data acquisition and careful SED modeling are necessary to avoid misclassification based on radio flux alone, especially for nearby or resolved systems. Understanding these astrophysical emission contamination sources and their scale-dependent impact can guide the design of robust, frequency-conscious measurement or classification systems.
Cite
@article{arxiv2606_25830,
  title={ Impact of Anomalous Microwave Emission (AME) on Radio Spectral Energy Distributions: SKA Observations of Galaxies Near and Far },
  author={ Ilsang Yoon and Eric Murphy and Caroline Bot and Lucie Correia },
  journal={arXiv preprint arXiv:2606.25830},
  year={ 2026 },
  url={https://arxiv.org/abs/2606.25830}
}