
Vistas: A Visualization Interface for Particle Collision Simulations
Source: arXiv:2606.19524 · Published 2026-06-17 · By Benoit Assi, Christan Bierlich, Rikab Gambhir, Philip Ilten, Tony Menzo, Stephen Mrenna et al.
TL;DR
This paper introduces VISTAS, an interactive visualization tool designed to render the full computational pipeline of high-energy particle collision simulations from the PYTHIA Monte-Carlo event generator. Unlike traditional HEP event displays that focus solely on final-state particles measured by detectors, VISTAS visualizes intermediate simulation stages such as the hard process, parton showers (initial- and final-state radiation), hadronization, and particle decays. It leverages the HEP Software Foundation’s browser-based PHOENIX framework to display events as a three-dimensional graph where particles are represented as lines oriented by their three-momentum vectors, and vertices correspond to production/decay points. Features include the ability to rotate, zoom, and filter particles by stage or kinematic properties, supporting intuitive exploration of complex event topologies.
Key findings
- VISTAS visualizes all major PYTHIA event simulation stages—hard process, beams, multi-parton interactions, initial-state radiation, final-state radiation, hadronization, and decay—each color-coded for distinction (e.g., hard process: magenta; MPI: red; hadronization: green).
- The full PYTHIA event record used for visualization can contain hundreds of particles (633 in the example shown), which reduces to fewer vertices (416) after removing duplicates and simplifying graph structure.
- The tool reconstructs a directed acyclic graph of particles and vertices by backwards traversal of the event record, resolving inconsistencies by angular ordering of mothers to daughters.
- Particles are rendered as 3D trajectories in PHOENIX with configurable length scales along their momentum vectors, allowing intuitive visualization of disparate physical length scales spanning >18 orders of magnitude within a single event.
- VISTAS allows toggling visibility of particles from different simulation stages and filtering by kinematic properties, supporting detailed event analysis and educational use.
- The visualization successfully illustrates physics features such as color flow connections, string fragmentation, and multiple parton interactions in an interactive environment.
- An example Higgs event (gg→H→ZZ→4μ) was used to demonstrate visualization of complex chains, including intermediate unstable particles invisible to detectors but present in the simulation.
- Comparison with existing HEP event displays highlights that VISTAS uniquely visualizes full simulation pipeline, not just detector final states.
Methodology — deep read
The authors focus on visualizing PYTHIA-generated simulated particle collision events. PYTHIA internally generates an event record listing ~600+ particles per event, each annotated with properties such as PDG ID, status (simulation stage), mothers, daughters, QCD color flow, four-momentum, and production vertex. These events represent a directed graph of particles as edges and vertices as production/decay points.
They define a threat model-independent approach (this is a visualization tool, not for security) and assume the PYTHIA event record is the input.
Step 1: Graph Construction. The event record is traversed backward (from last particle to first) to form a directed acyclic graph of vertices corresponding to interactions/decays and edges as particles. To handle inconsistencies where mother-daughter relations are not reciprocal, the algorithm selects the mother closest in angle to the daughter to form edges. Duplicate particle entries representing four-momentum shifts (e.g. due to radiation) are filtered to reduce complexity. By default, only particles with multiple daughters or originating from the hard process/MPI are preserved.
Step 2: JSON Translation. The graph is converted into a JSON structure to be loaded by the PHOENIX event viewer. Particles are represented as tracks defined by 3D points along their momentum directions scaled by configurable length parameters. Vertices (production/decay points) are assigned 3D positions starting at the origin or sequentially spread along an axis to separate complex subgraphs.
Particles are drawn as colored lines between vertices, with colors encoding simulation stages such as hard process (magenta), MPI (red), hadronization (green), decay (cyan), etc. Color flow is visualized as additional curved dark gray lines.
Step 3: Event Rendering and Interaction. The web-based PHOENIX display allows rotation, translation, and zooming of events with interactive mouse or touch controls. Selecting particle lines reveals detailed attributes. Toggle menus allow visibility filtering by stage or kinematic selections (e.g., pT, rapidity). This interface enables exploration of both architecture and kinematics.
The example event visualized is a proton-proton collision at 13 TeV producing a Higgs boson decaying into four muons through intermediate Z bosons. The stages shown include initial gluons (beams), hard process, ISR, FSR, MPI, hadronization strings, and final particle decays. Their event has been simplified following filtering steps to enhance clarity.
The software is implemented in Python for graph processing with output JSON consumed by JavaScript PHOENIX rendering. The VISTAS repository and an interactive event demo are available online. Additional details on vertex ordering, particle trajectory lengths, color assignment, and filtering options are described.
No adversarial evaluation or machine-learning components are involved—it is a visualization and educational tool.
Reproducibility is supported by releasing code and an online interactive viewer, though the full PYTHIA event record dataset is not publicly included, as it is standard simulation software output.
Technical innovations
- Backward traversal and angular-ordering-based mother selection to resolve non-reciprocal mother-daughter relations in PYTHIA event records, producing a consistent directed graph for visualization.
- Integration of multi-stage PYTHIA event simulation information—hard process, ISR, FSR, MPI, hadronization, and decay—into a unified interactive 3D visualization, beyond traditional final-state particle displays.
- Use of the PHOENIX browser-based event display framework for rendering particle tracks as momentum-oriented 3D line segments with configurable lengths to represent huge scale disparities in a single view.
- Interactive filtering and toggling of simulation stages and particle kinematics, enhancing educational interpretability of complex particle collision events.
Datasets
- PYTHIA simulated proton-proton collision events (example event: 633 particles, 416 vertices after filtering) - publicly available via PYTHIA software
Figures from the paper
Figures are reproduced from the source paper for academic discussion. Original copyright: the paper authors. See arXiv:2606.19524.
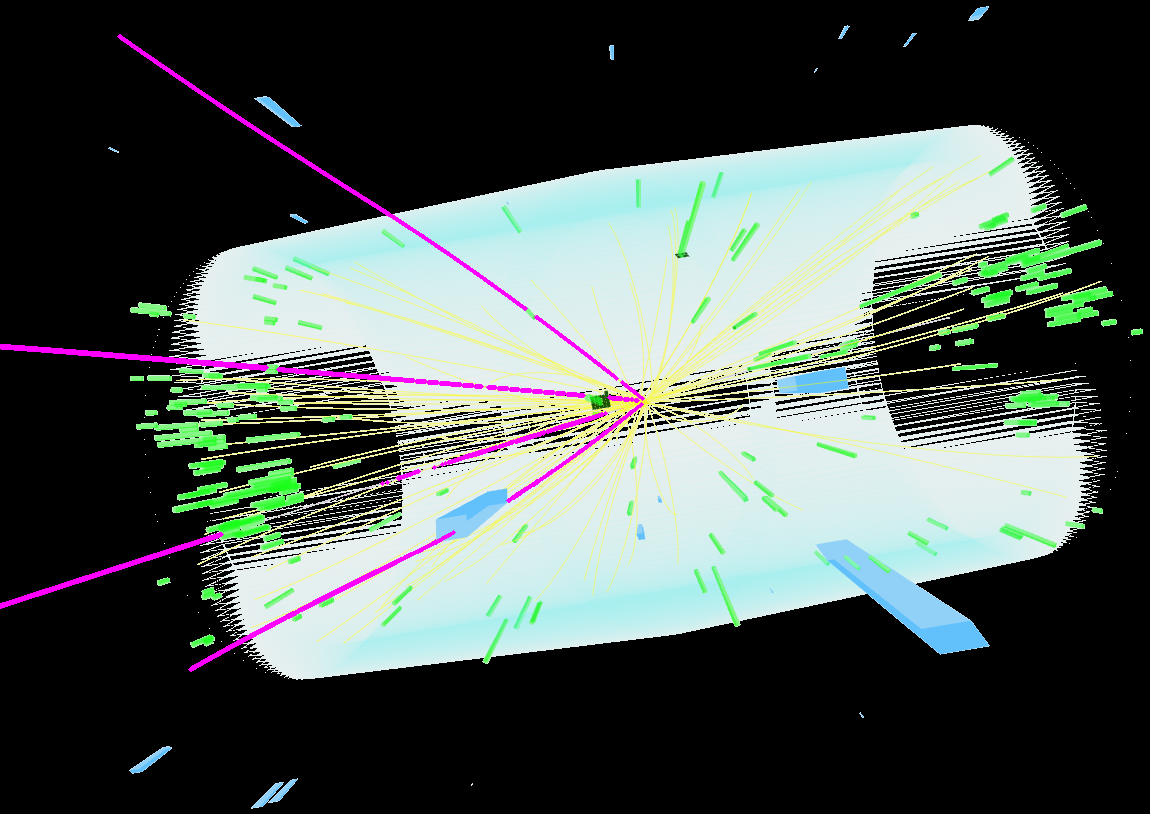
Fig 1: Example event reconstructed by the CMS
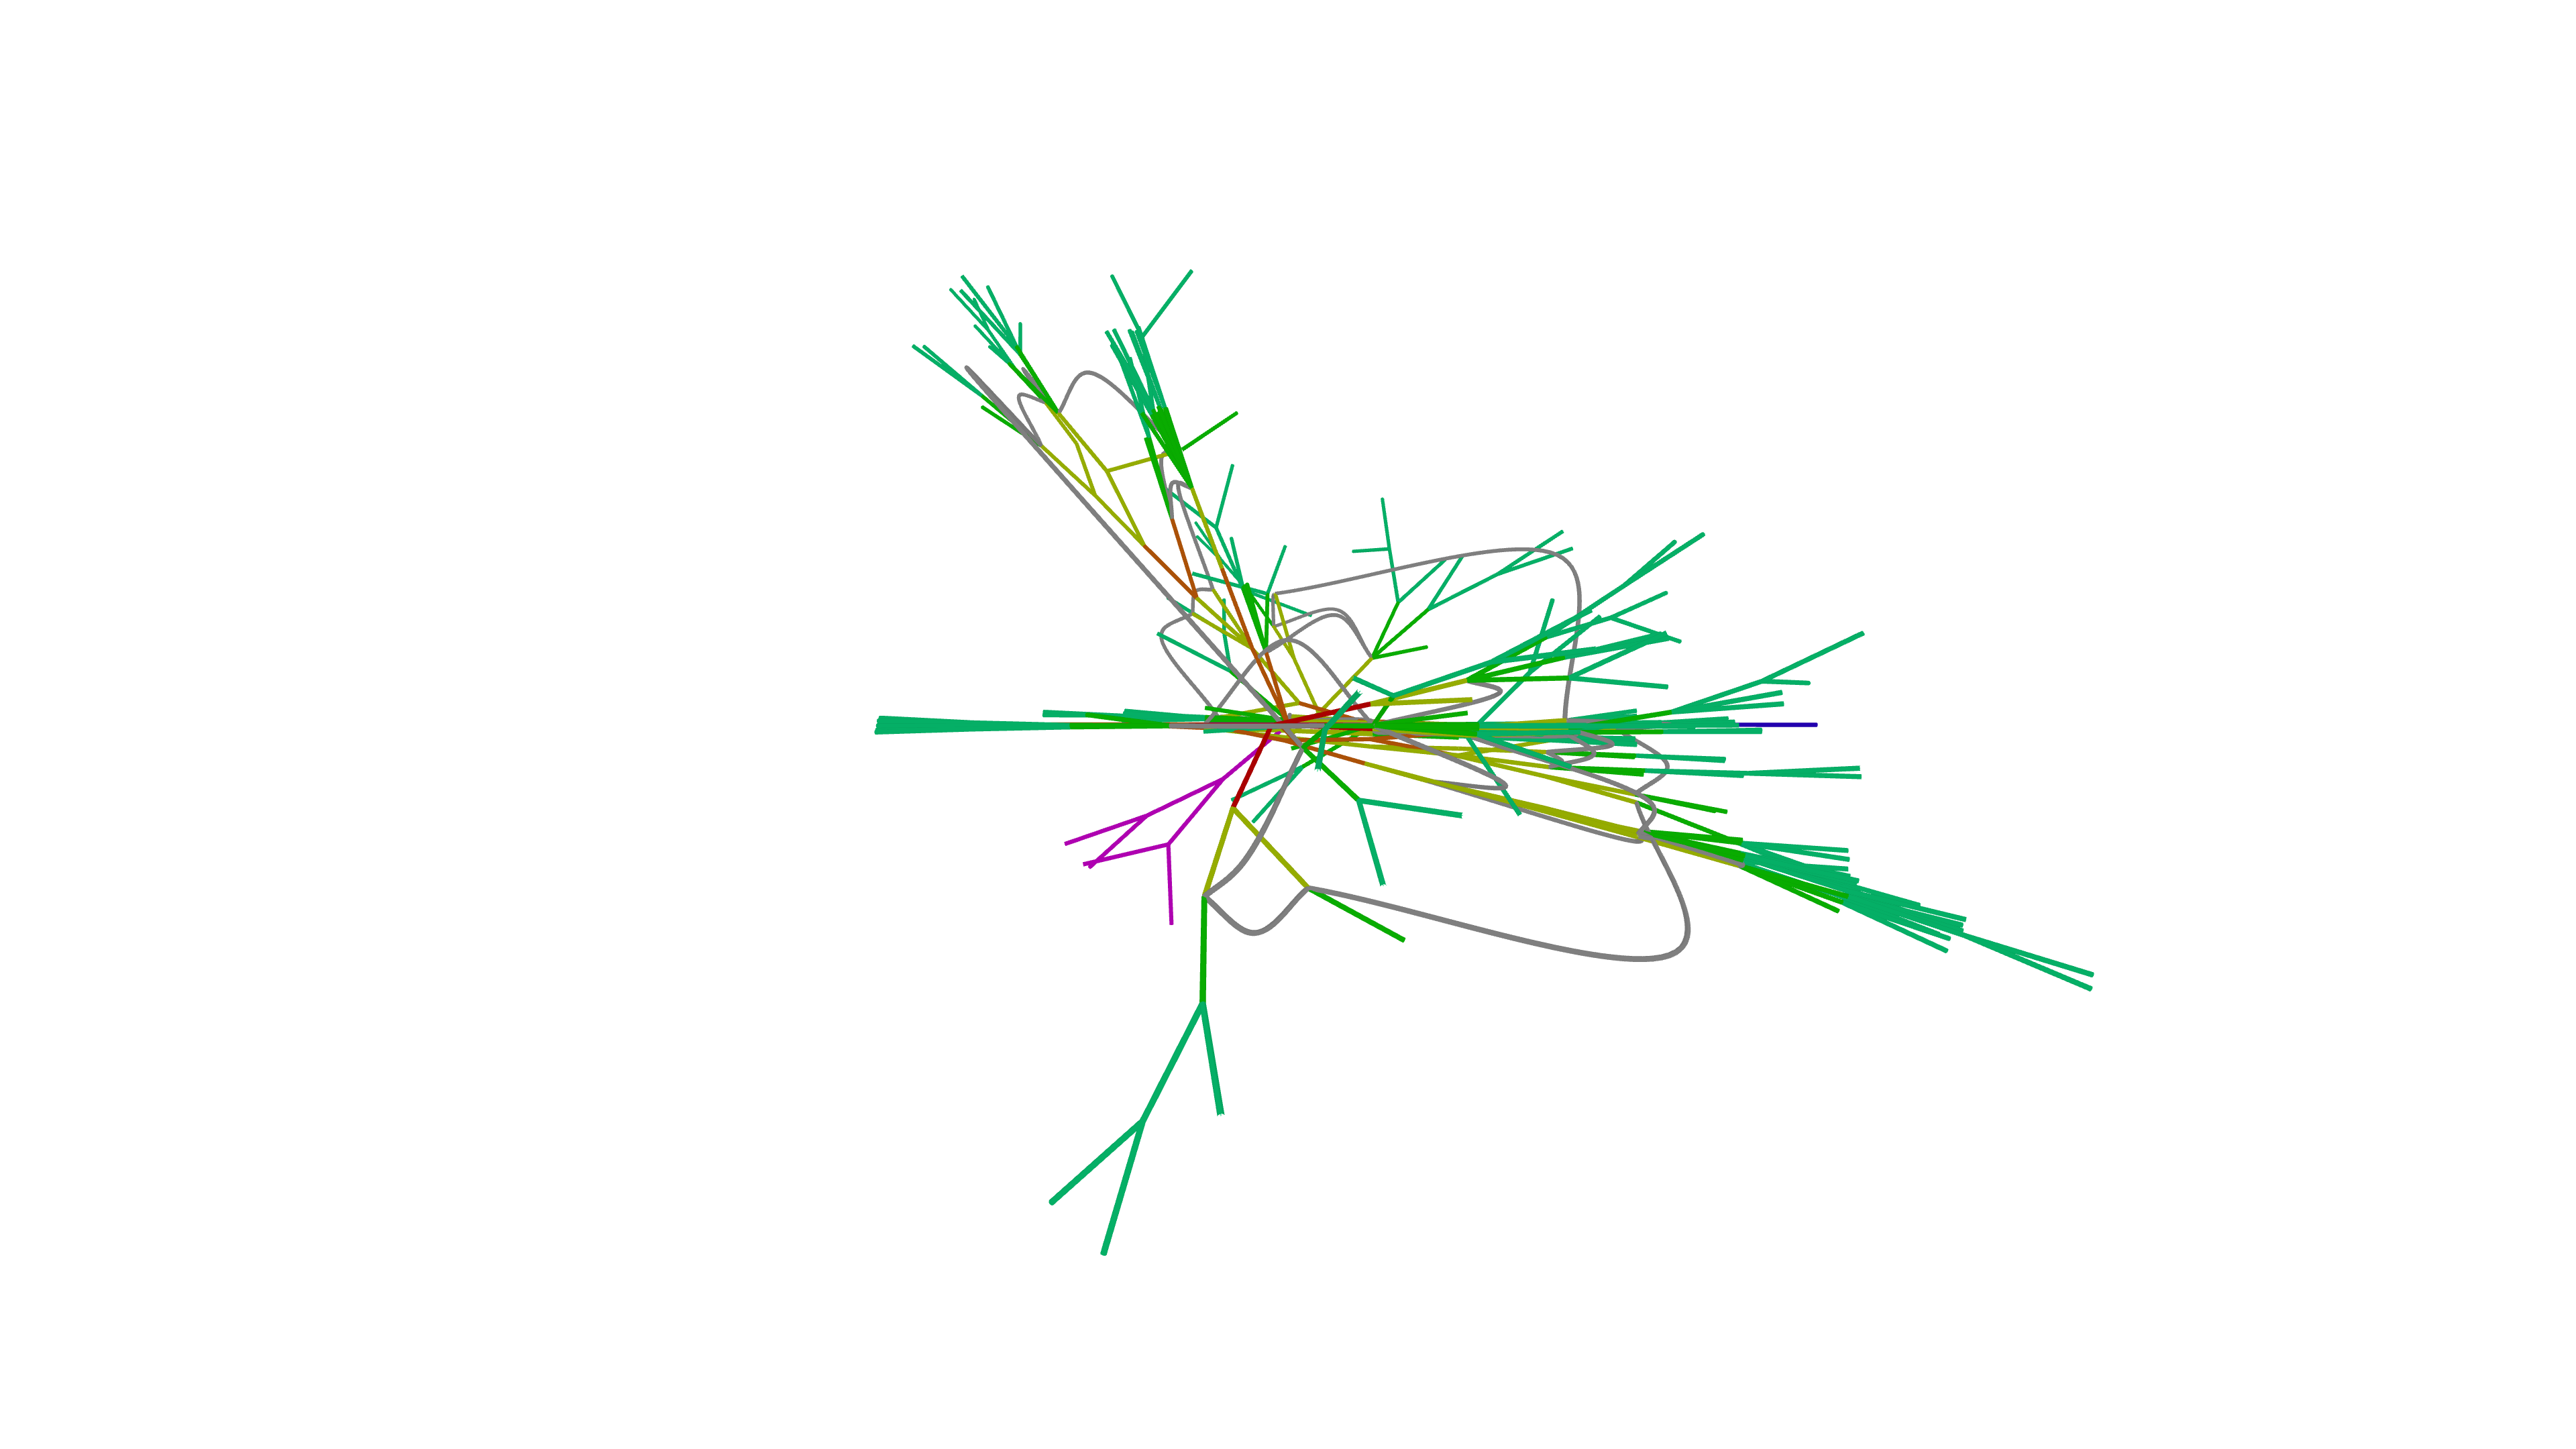
Fig 3: Screen capture of a sample HEP collision
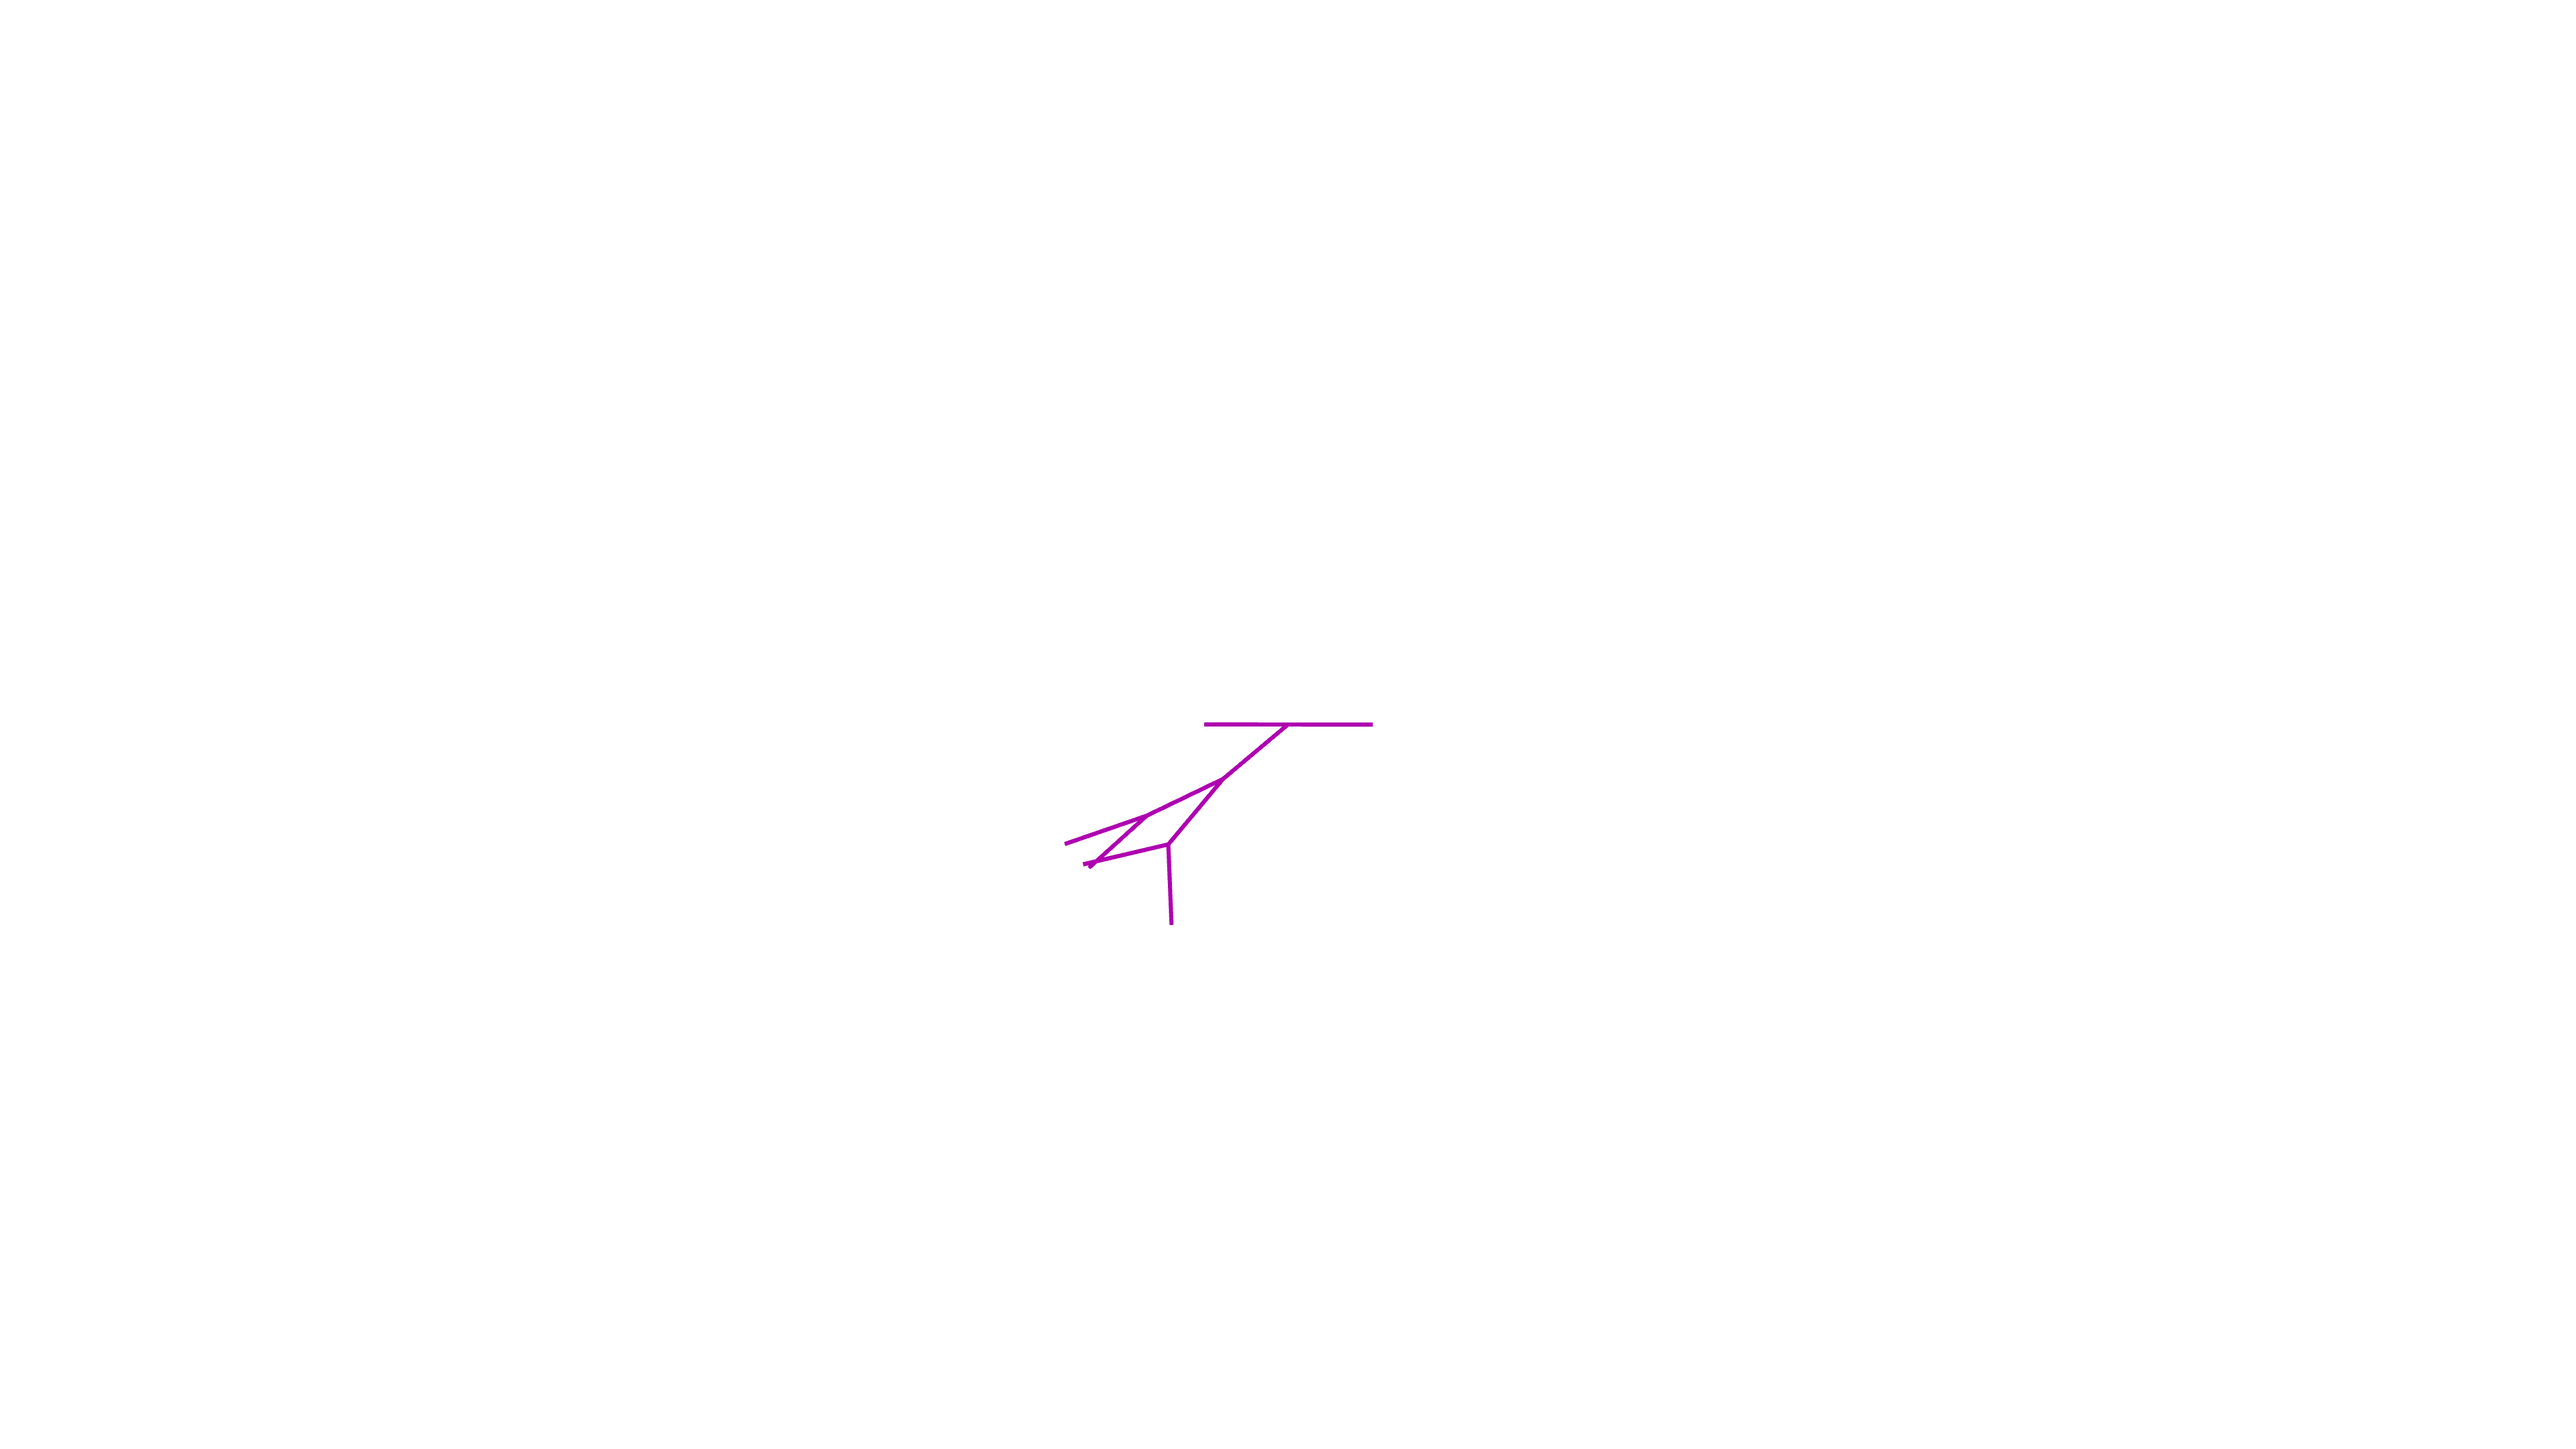
Fig 4: VISTAS visualization of the PYTHIA simulation stages from the event of table 1.
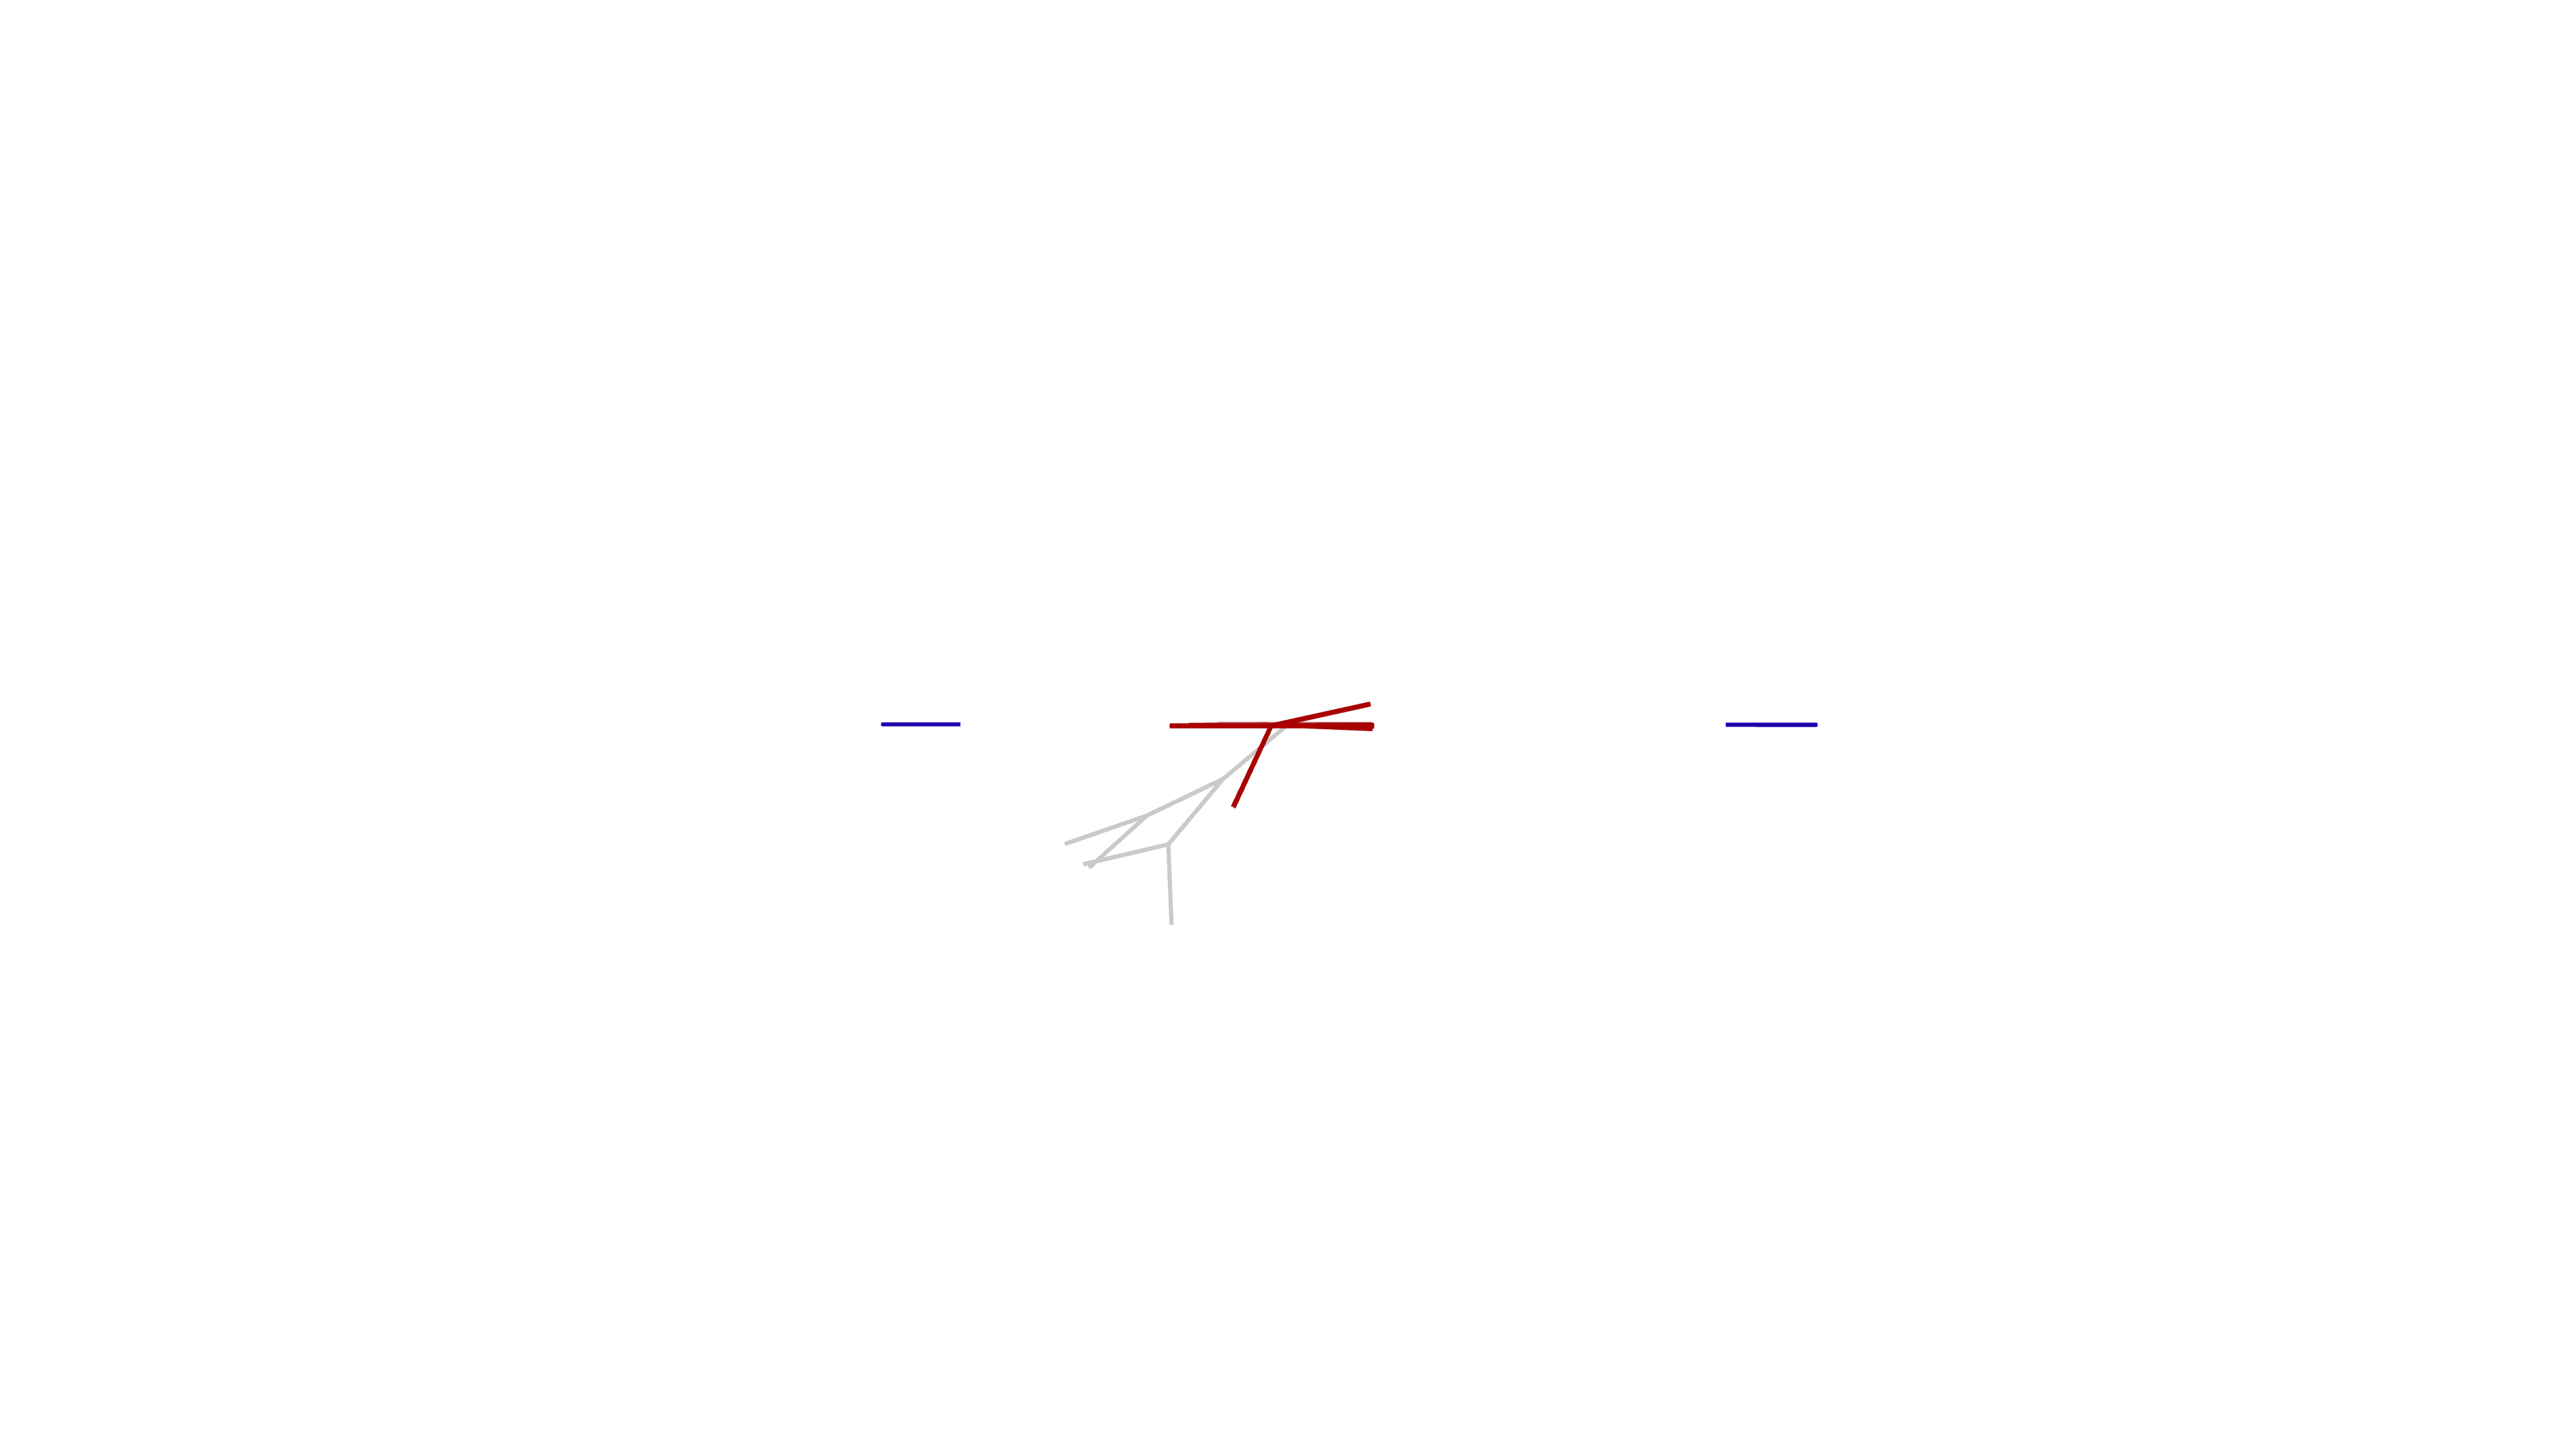
Fig 4 (page 6).
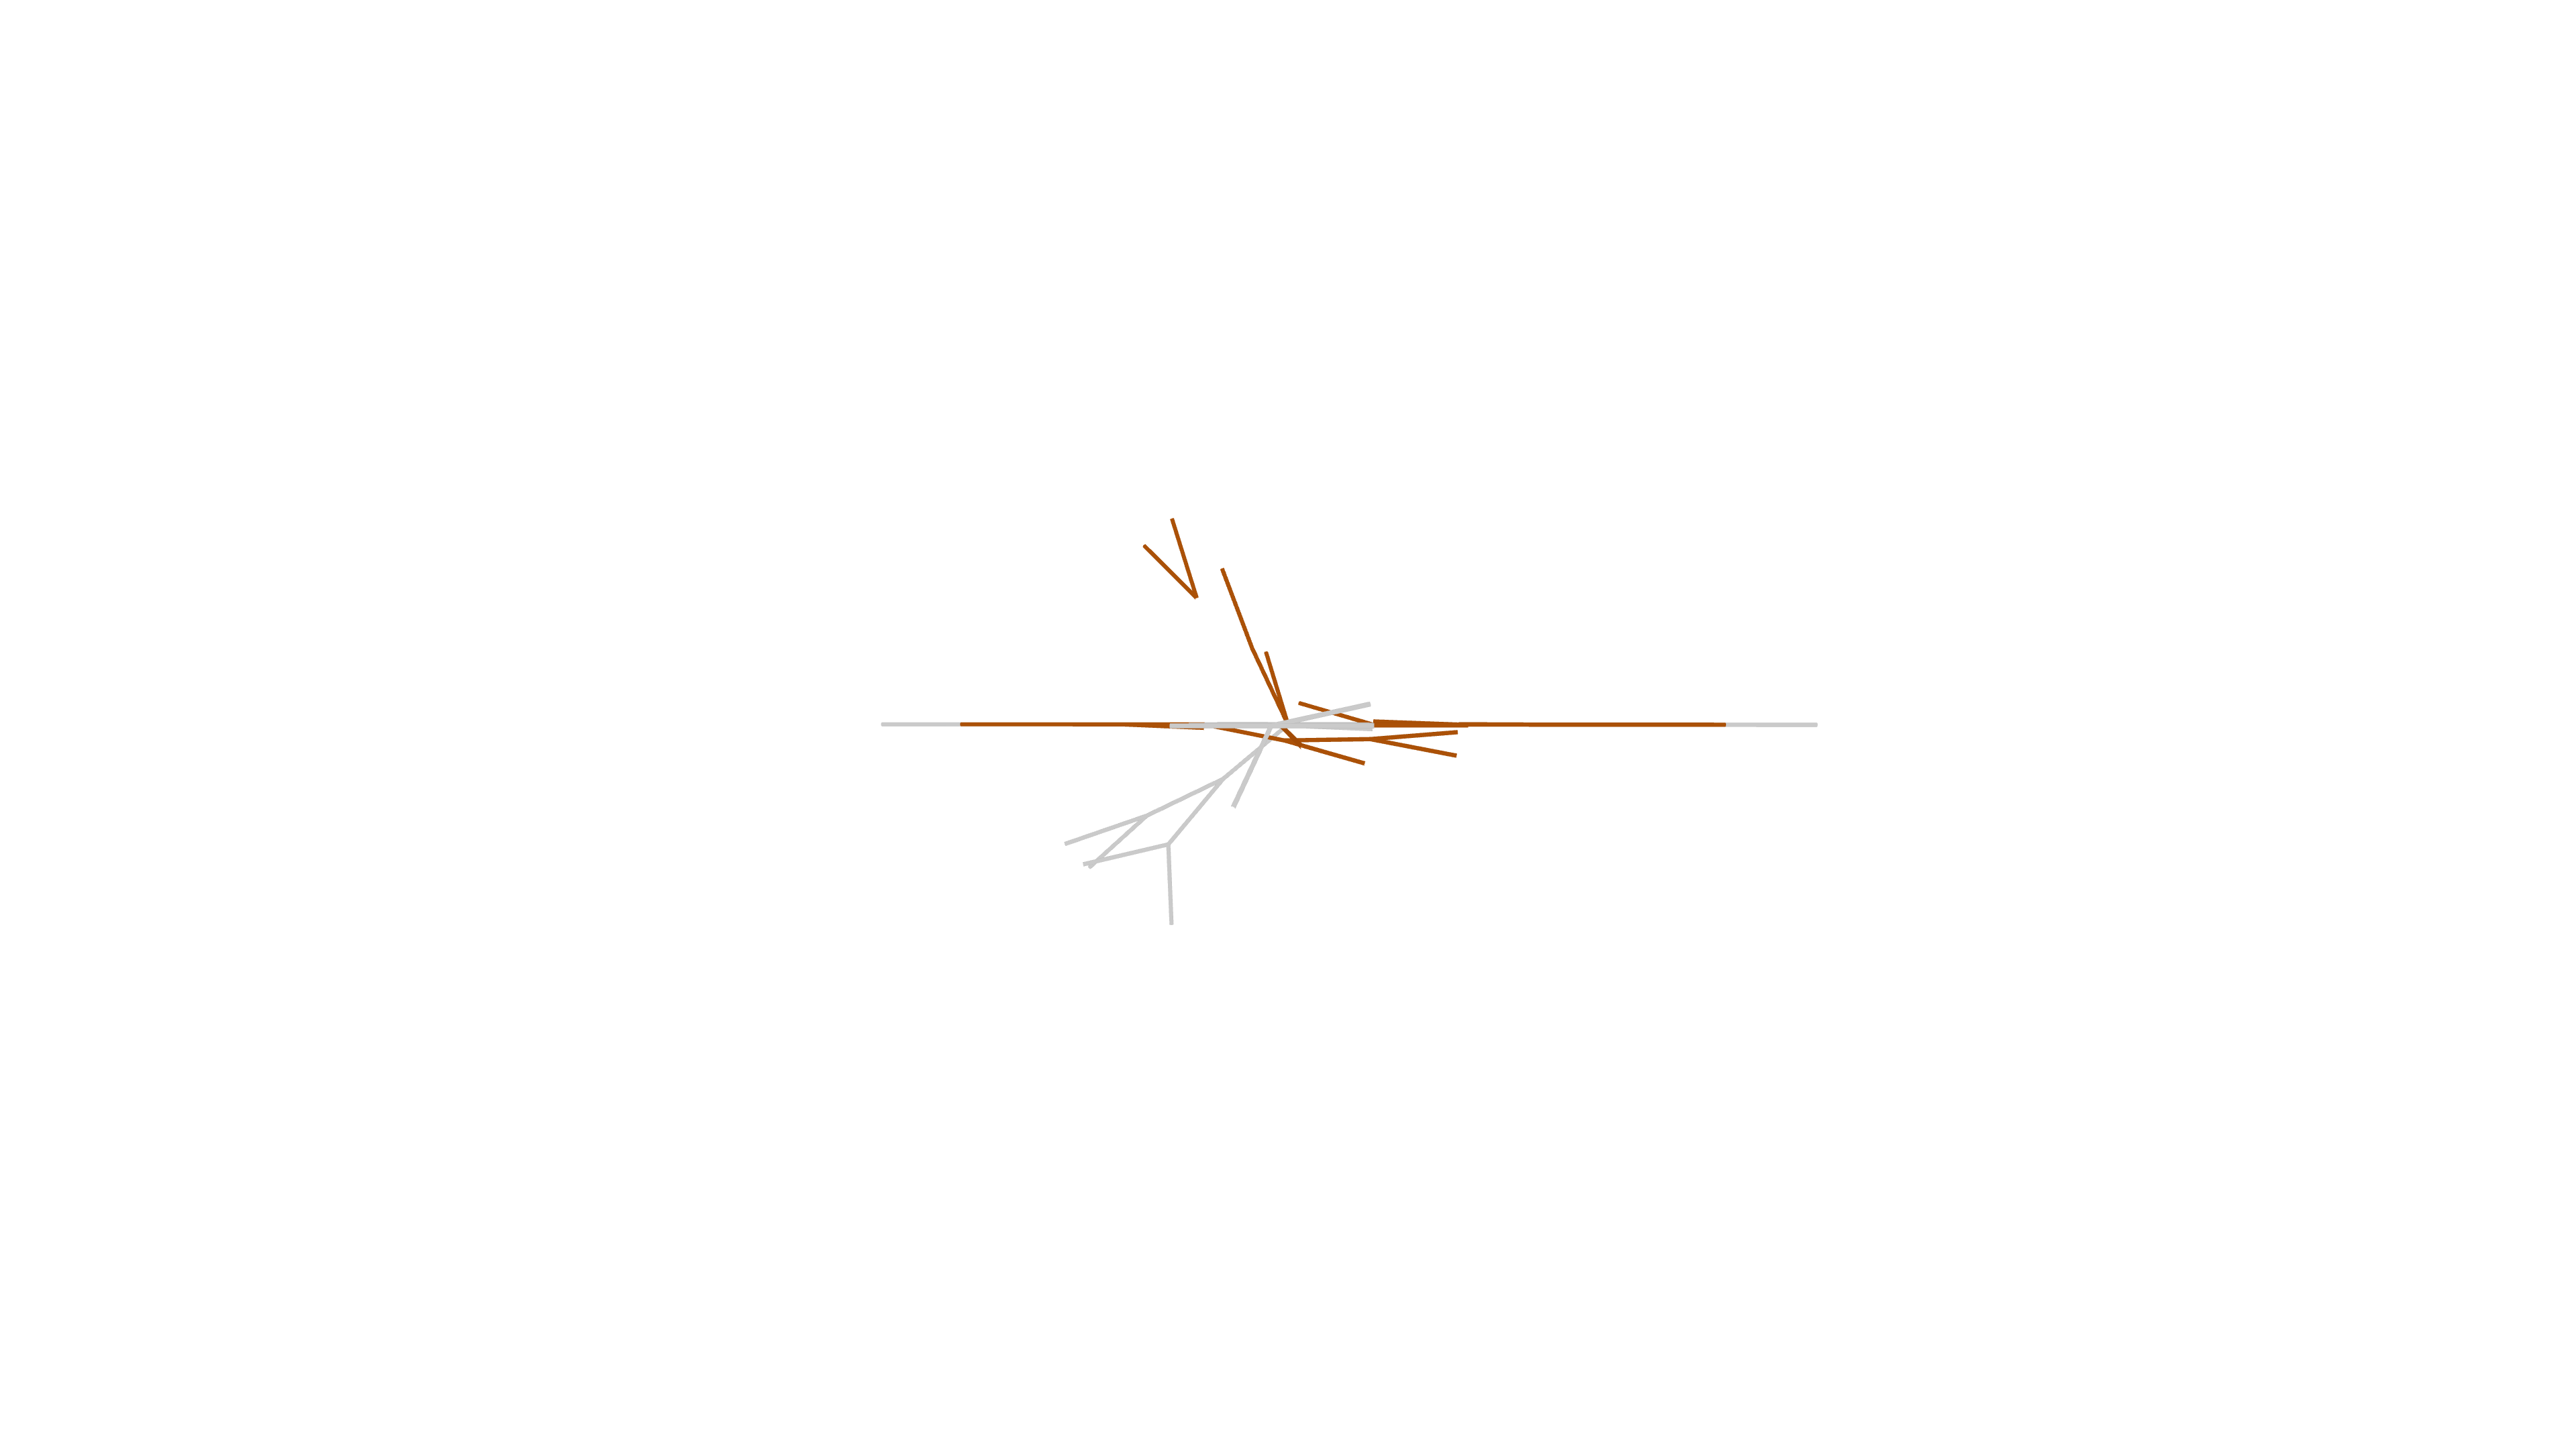
Fig 5 (page 6).
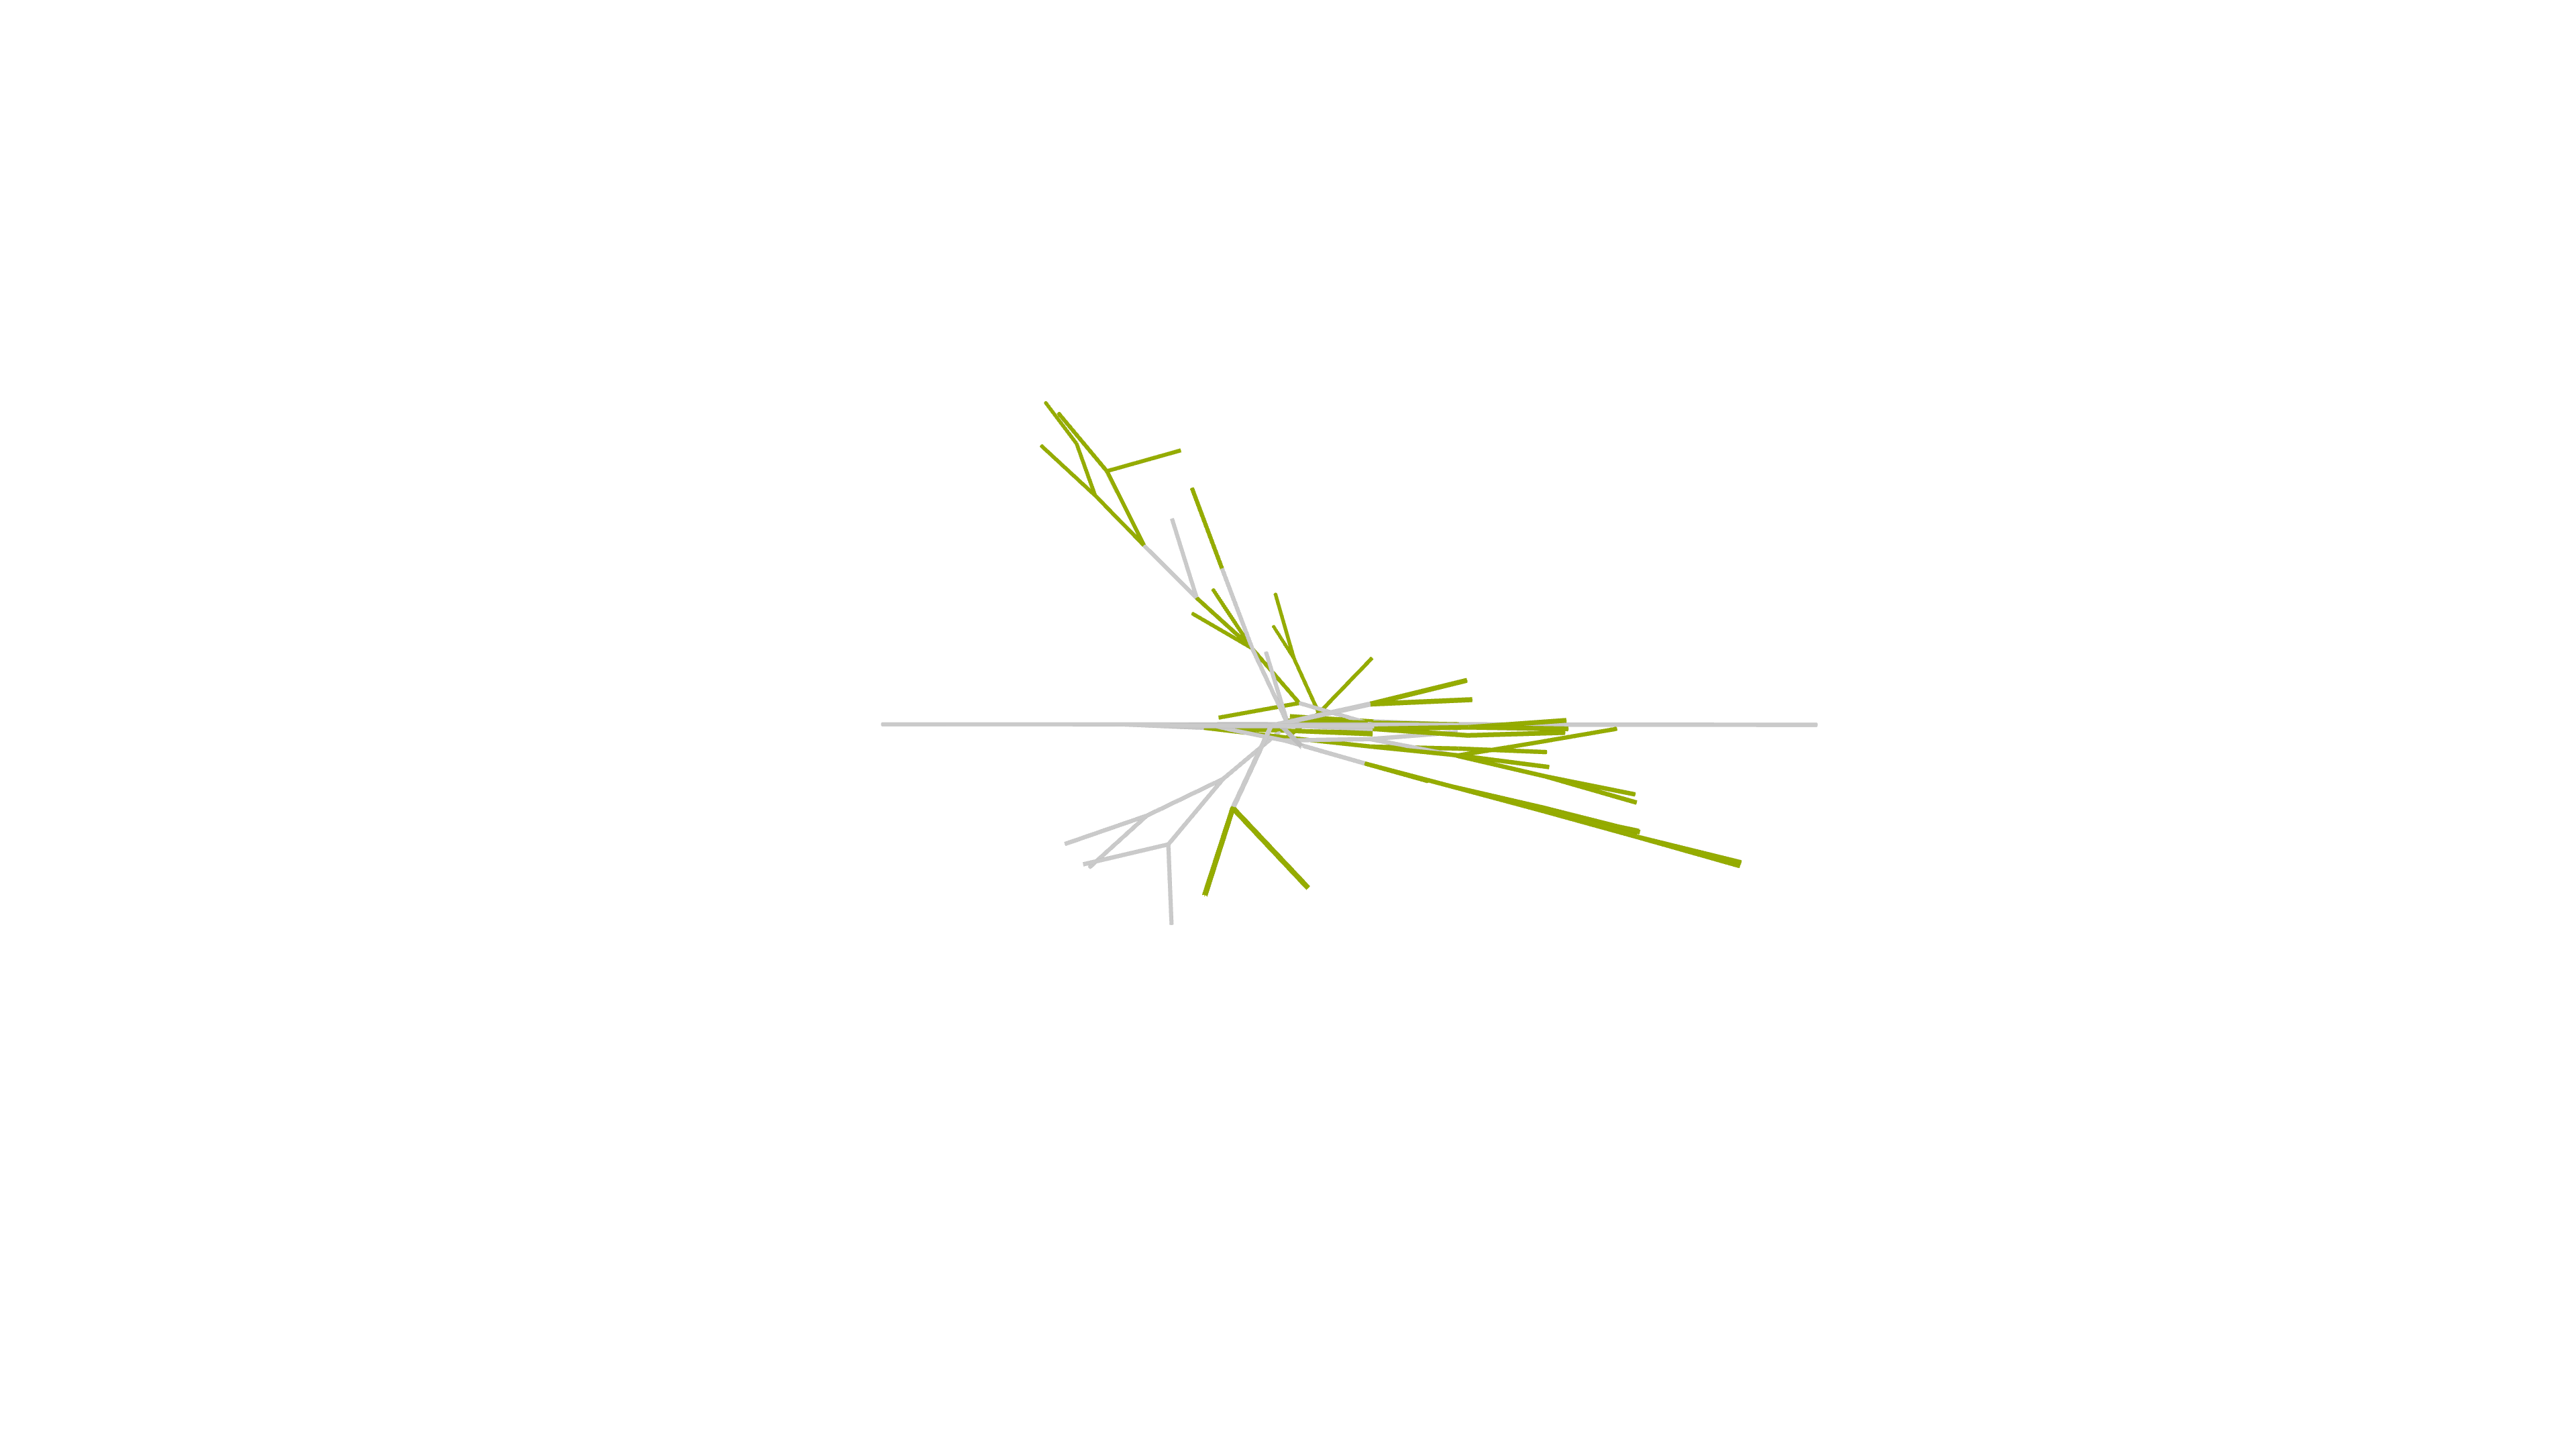
Fig 6 (page 6).
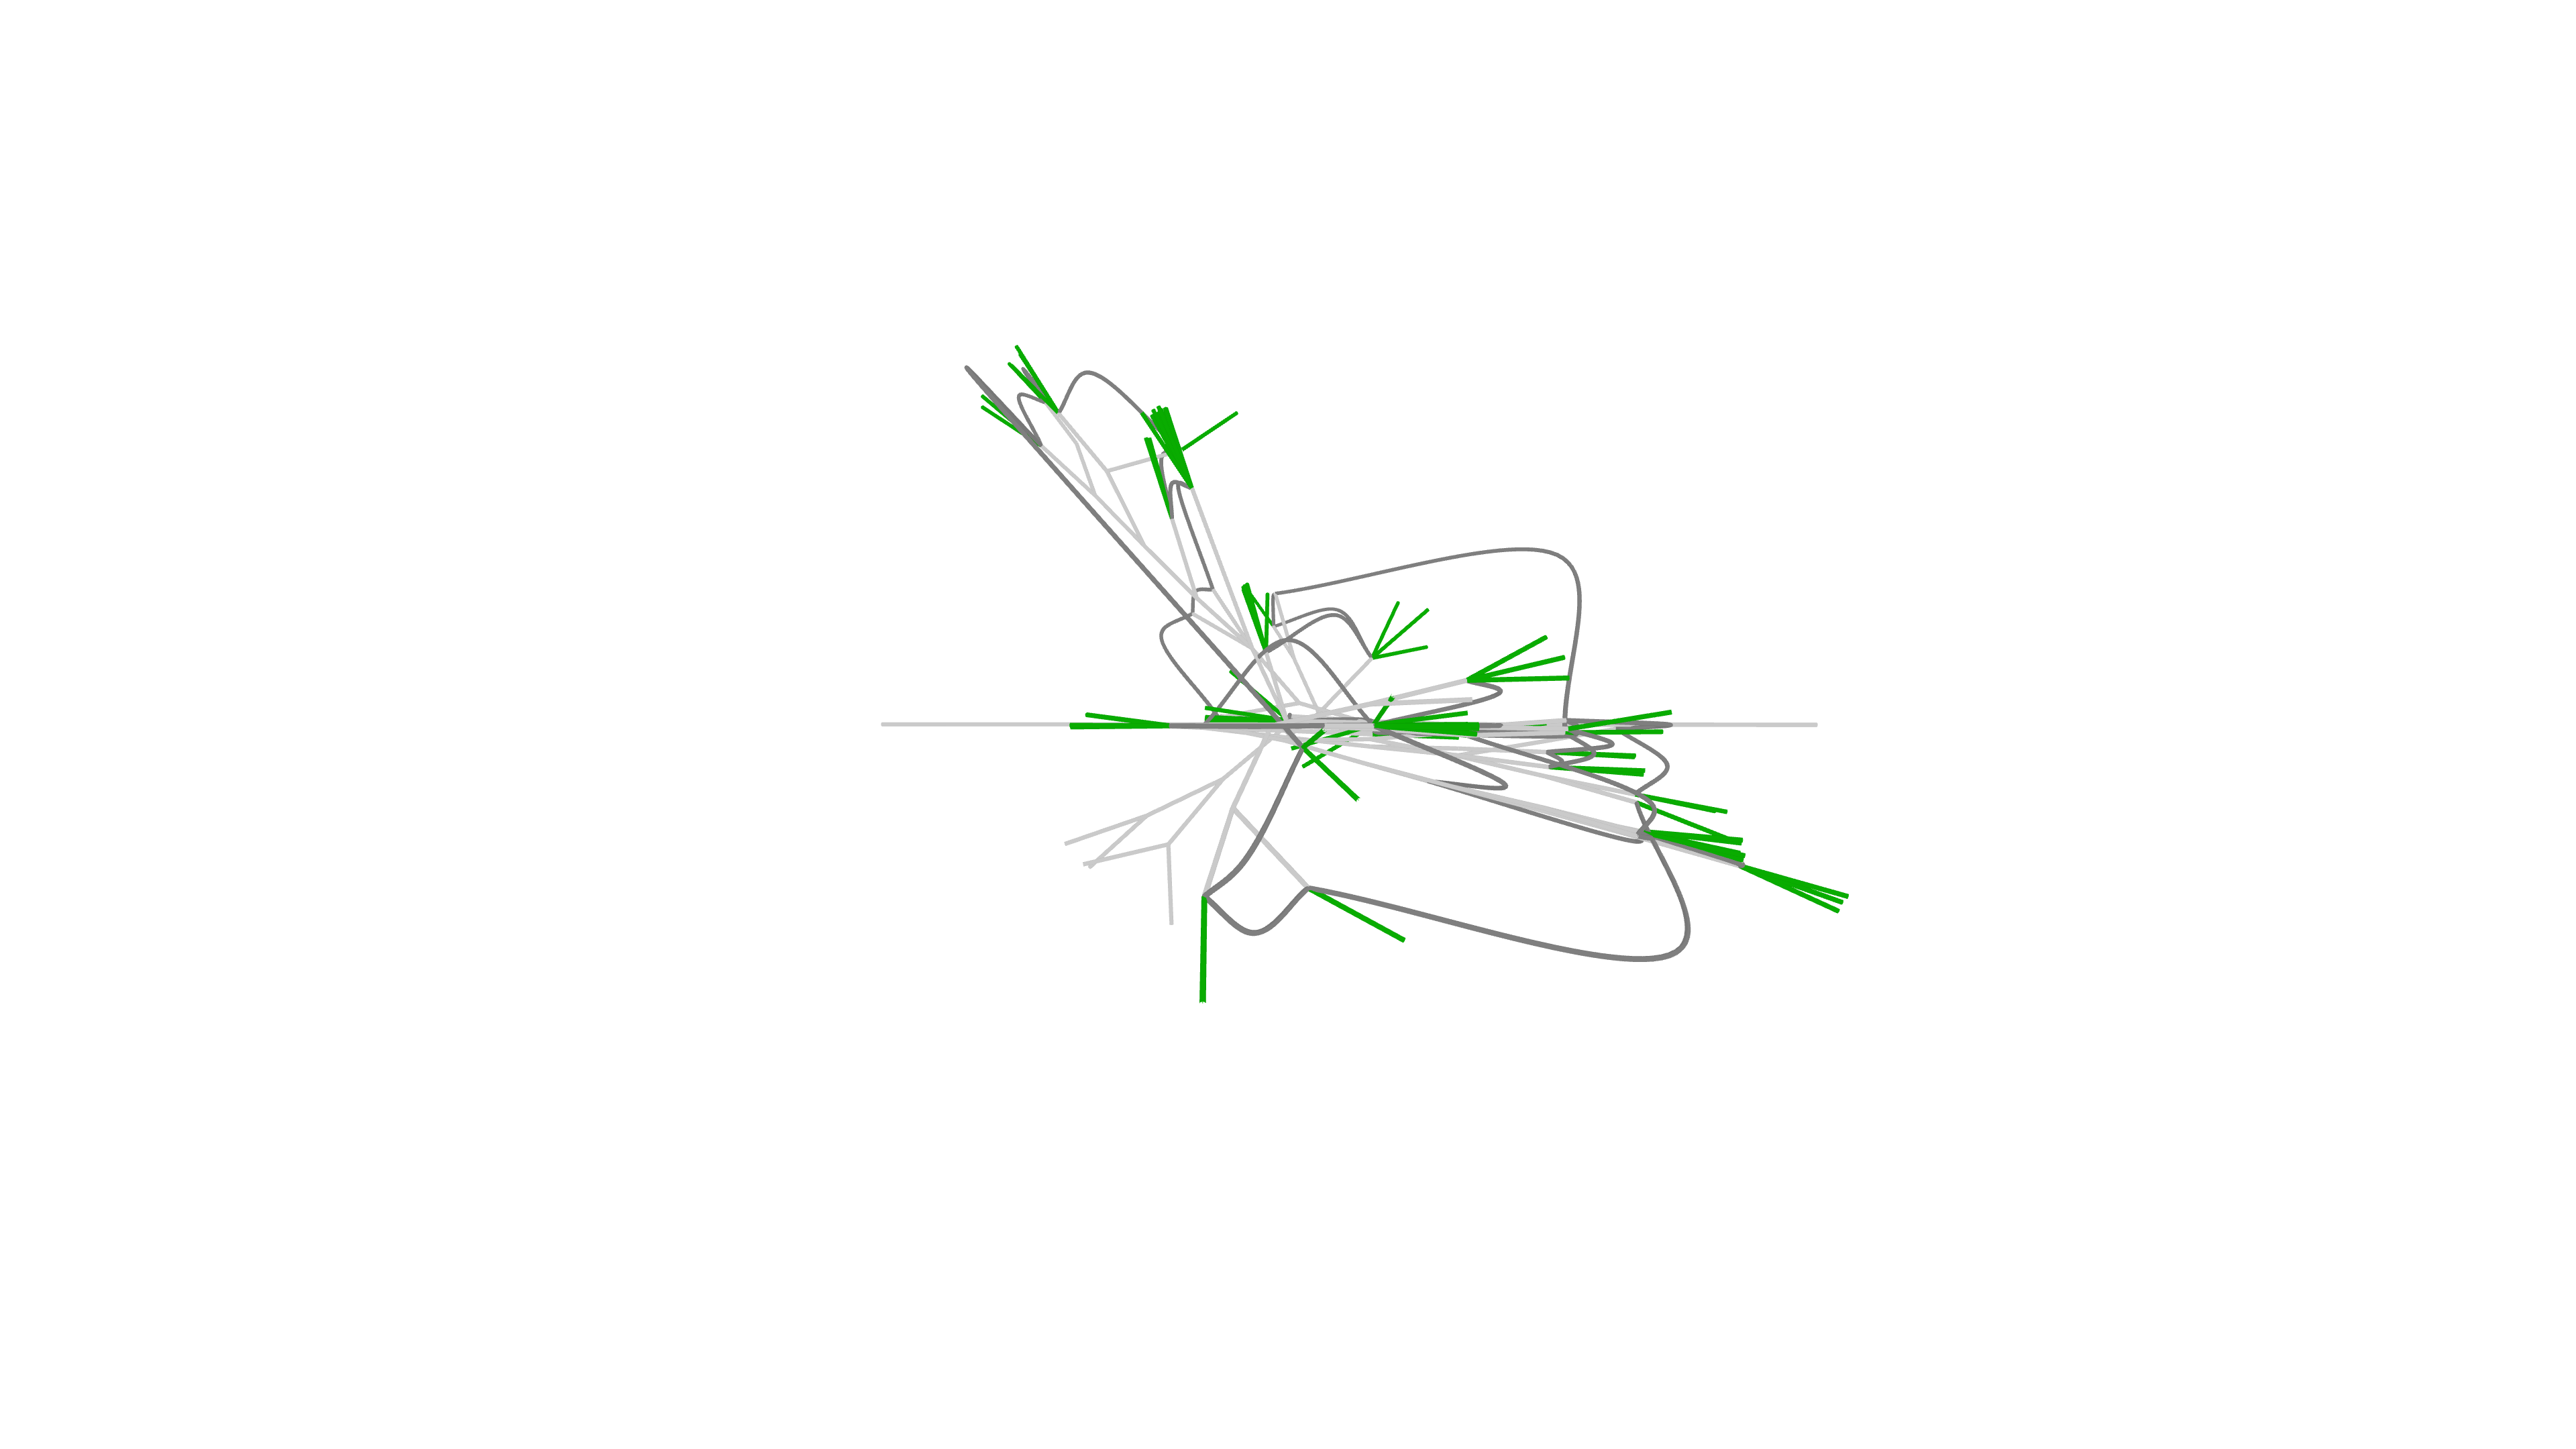
Fig 7 (page 6).
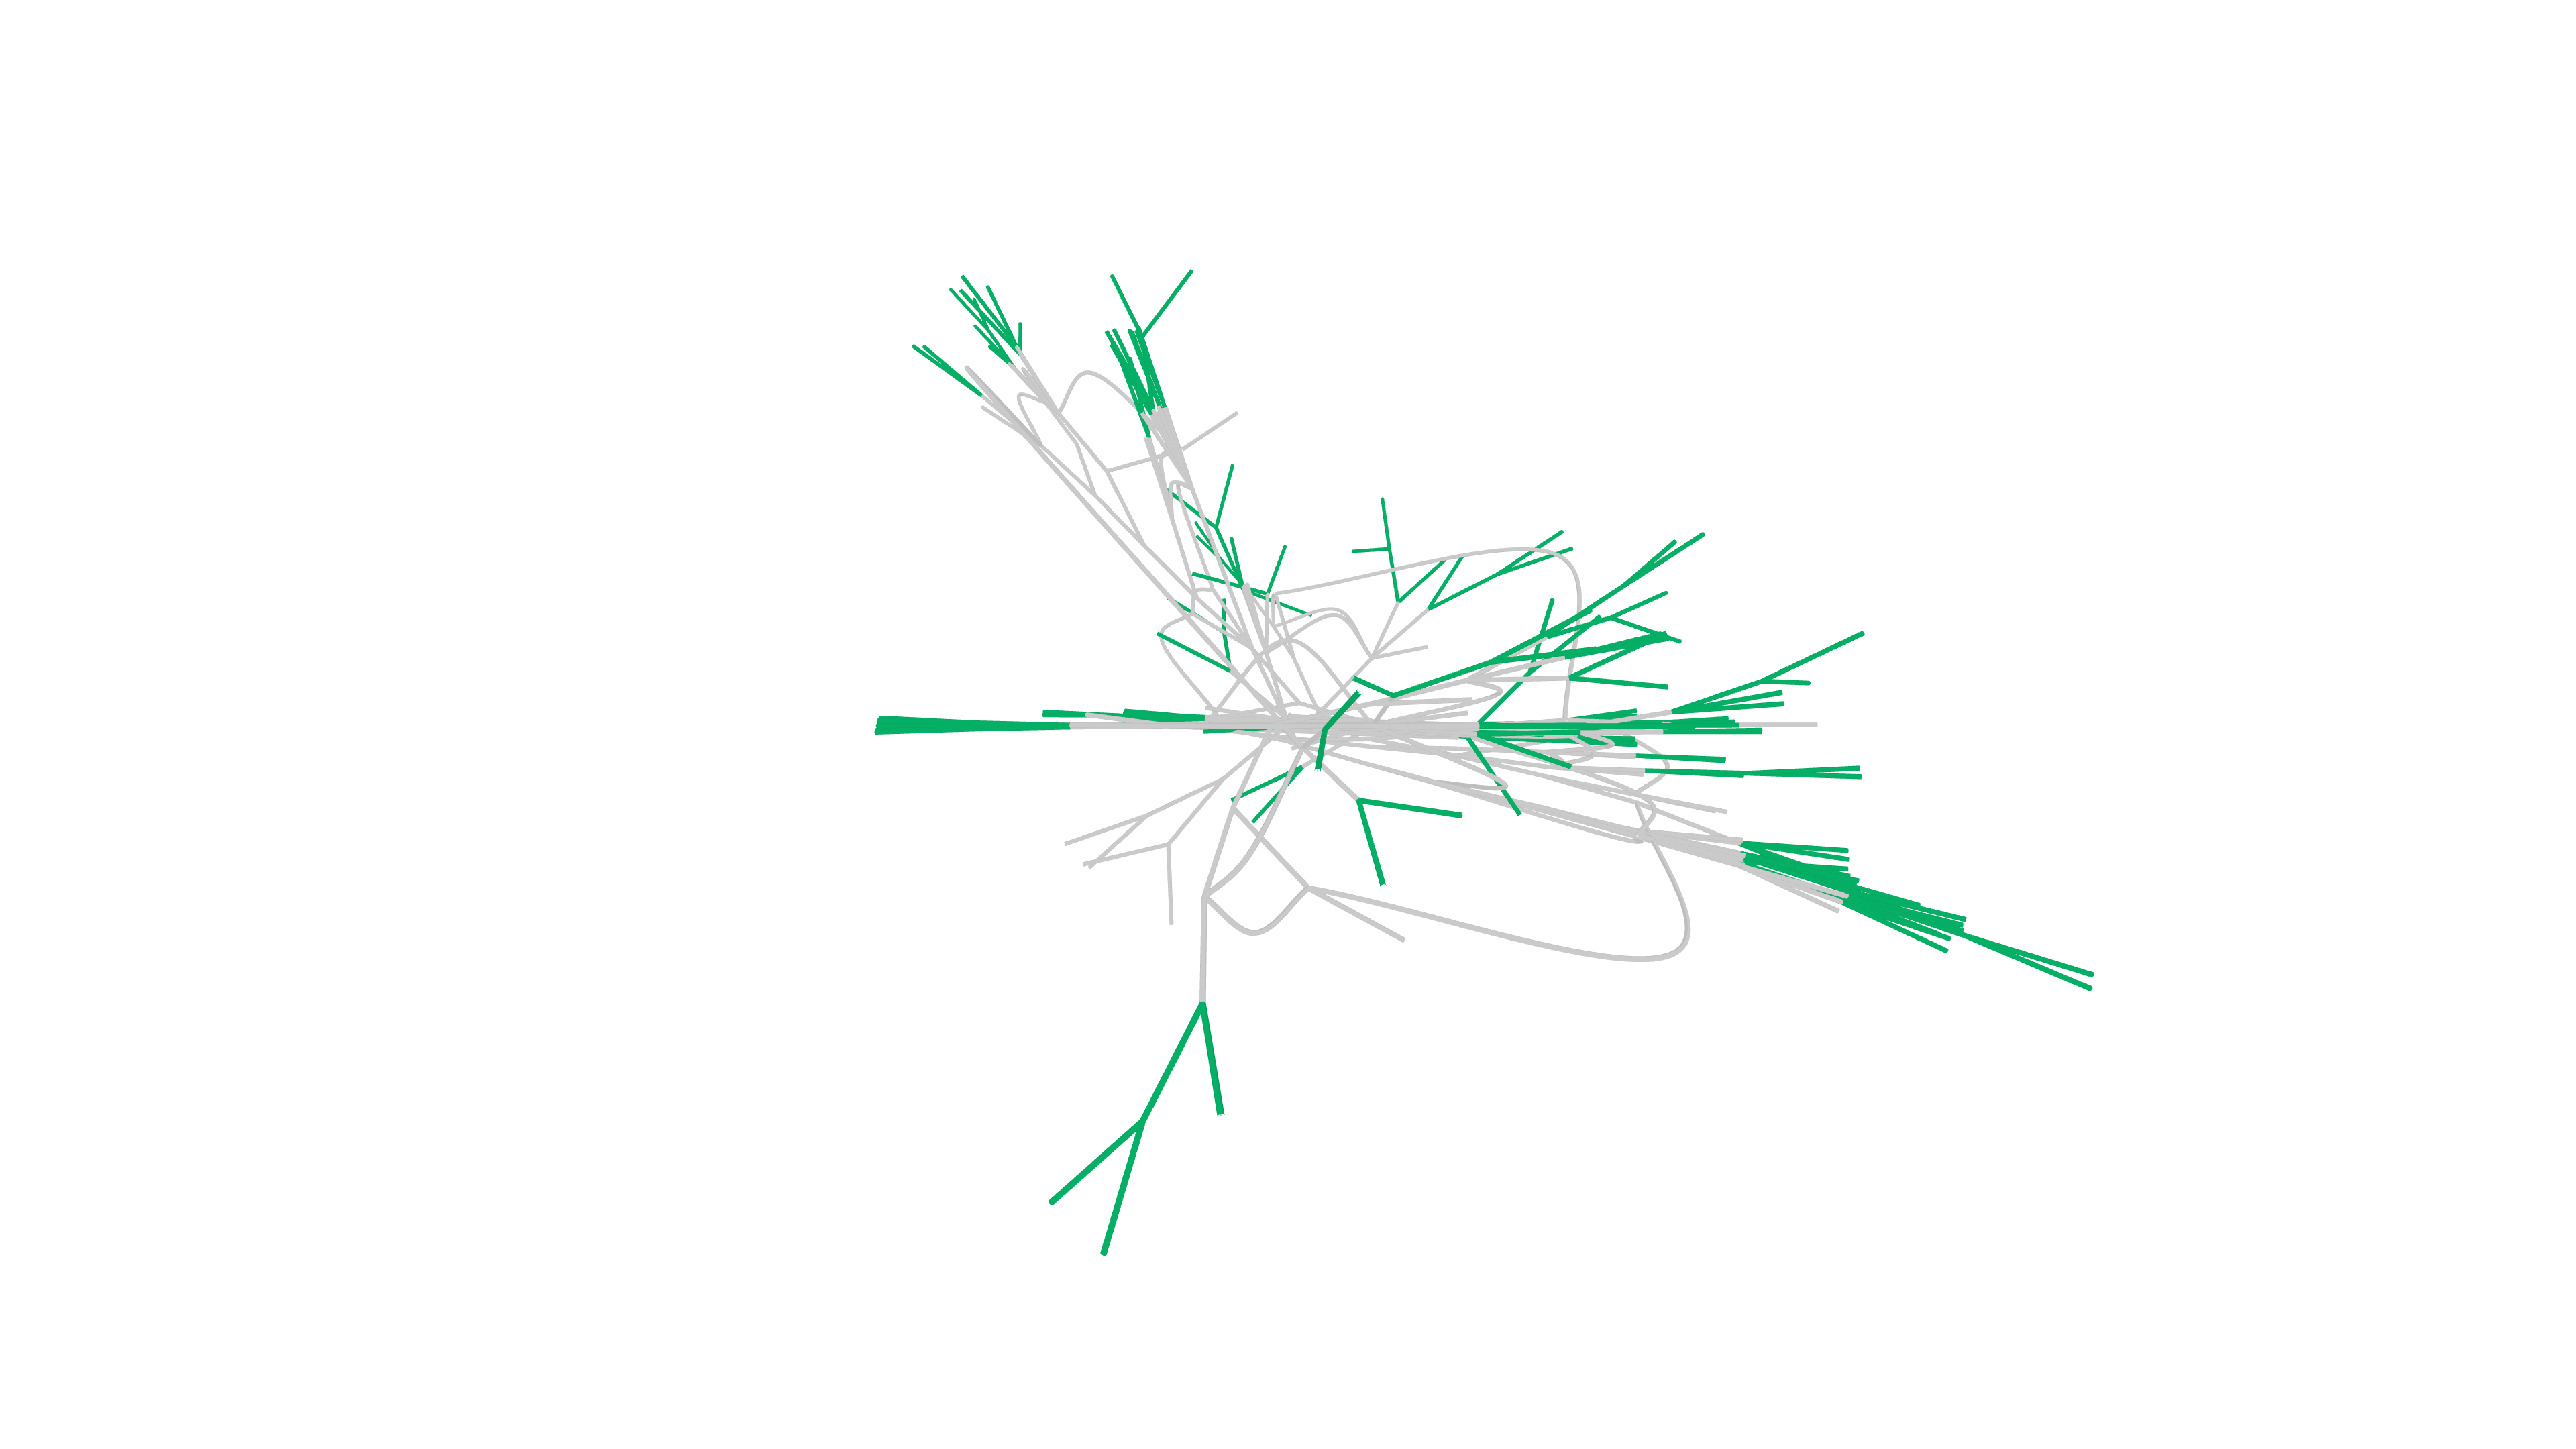
Fig 8 (page 6).
Limitations
- Visualization is limited to PYTHIA output; adapting to other Monte Carlo event generators (HERWIG, SHERPA) would require additional development.
- The event record graph simplification by particle filtering can omit some detailed links or particles, possibly removing subtle physical features.
- No quantitative user evaluation or formal educational assessment of VISTAS was presented to verify improved learning outcomes.
- Visualization scales and particle trajectory lengths are configurable but choosing physically meaningful scales is nontrivial and may cause distortion.
- Detectors effects and final-state reconstruction are not simulated; this is theoretical event record visualization only.
- No explicit handling or visualization of uncertainties or event-to-event variability is detailed.
Open questions / follow-ons
- How might VISTAS be generalized to support visualization of other Monte Carlo generators with different event record formats and conventions?
- Could user studies empirically validate VISTAS' efficacy as a pedagogical tool for particle physics education across different levels of expertise?
- How to optimally represent extremely large events (thousands of particles) with dense vertex structures while preserving user interpretability?
- What is the best method to integrate detector simulation overlays with VISTAS’ theoretical event visualization to connect theory with measurement?
Why it matters for bot defense
While not directly related to bot-defense or CAPTCHA, VISTAS' core approach—interactive visualization of complex hierarchical event data with filtering and graph-based representations—can inform visualization strategies for complex data flows or activity trees involved in bot detection systems. The techniques for resolving inconsistent data relationships and condensing large event records could inspire approaches to interpret behavioral graphs or multi-stage modeling pipelines in bot defense contexts. However, VISTAS is focused on high-energy physics event simulation rather than security or adversarial behavior. Bot defense engineers might find the graph construction and interactive filtering components relevant as design patterns but the domain-specific physics content is not directly applicable.
Cite
@article{arxiv2606_19524,
  title={ Vistas: A Visualization Interface for Particle Collision Simulations },
  author={ Benoit Assi and Christan Bierlich and Rikab Gambhir and Philip Ilten and Tony Menzo and Stephen Mrenna and Manuel Szewc and Michael K. Wilkinson and Ahmed Youssef and Jure Zupan },
  journal={arXiv preprint arXiv:2606.19524},
  year={ 2026 },
  url={https://arxiv.org/abs/2606.19524}
}