
Risk Stratification for ICU Delirium using Pervasive Ambient Sensing Information
Source: arXiv:2606.19292 · Published 2026-06-17 · By Jiaqing Zhang, Sabyasachi Bandyopadhyay, Miguel Contreras, Jessica Sena, Yuanfang Ren, Andrea Davidson et al.
TL;DR
This study addresses the challenge of early prediction and risk stratification of delirium, a common and serious complication in ICU patients linked to worsened outcomes and healthcare costs. Unlike prior work focusing on electronic health records or EEG signals, this paper investigates whether pervasive ambient sensing of environmental factors—specifically ICU light intensity and sound pressure levels—can predict delirium onset prospectively. The authors collected a unique multimodal dataset from 309 patients across 9 ICUs using sensors capturing daily day/night splits of light and detailed statistical descriptors of sound levels. They trained and evaluated multiple sequential neural network models, including CNNs, LSTMs, GRUs, and Transformers, over varying prediction horizons from 1 day up to 28 days. The CNN model on sound data alone achieved up to 0.80 AUC, outperforming light-only models. Combining sound and light improved risk prediction particularly in the short term (<1 week) though with slight accuracy reductions. Shapley Additive Explanations demonstrated that daytime sound features were the strongest delirium predictors, with integrated sound+light showing higher early risk assignment. These findings establish ambient ICU soundscape data as a clinically meaningful and interpretable signal to improve delirium risk estimation and prevention strategies in critical care.
Key findings
- CNN model on Sound dataset achieved an AUC of 0.80 in predicting delirium over a 28-day horizon.
- Model trained on Light dataset alone had moderate performance, peaking at 5-day prediction window.
- Combined Sound+Light model had highest risk discrimination at 7-day prediction window, assigning up to 1.8x relative risk compared to sound-only and 2.6x compared to light-only at early post-collection time points.
- SHAP analysis showed daytime sound pressure features (e.g., L90-day, Lmax-night) were consistently the strongest positive predictors of delirium risk.
- Background daytime sound (Lmin-day) negatively predicted delirium while sustained foreground sound positively predicted it.
- Sound data distributions were Gaussian and more consistent across sensor types while light intensity data distributions differed by sensor, possibly causing light model performance degradation.
- Study dataset included 309 ICU patients observed for up to 7 days; data was zero-padded to a 7-day observation window.
- Bootstrap-based 95% confidence intervals were computed for all reported metrics.
Threat model
n/a — This is a clinical risk prediction study without adversarial threat considerations. The focus is on predicting delirium onset using passive sensor data in ICU patients, without modeling an attacker or evasion scenarios.
Methodology — deep read
Threat model & assumptions: The study assumes an adversary is irrelevant since this is a medical prediction task with no explicit attacker model. The focus is on predicting delirium onset in ICU patients using continuous ambient sensor data. No adversarial robustness evaluation was conducted.
Data provenance, size, labels: Data was collected from two prospective single-center ICU studies at University of Florida (PAIN and ADAPT studies) between 2019-2024. Ambient sound and light data were captured from wrist-worn and room sensors (Actigraph GTX3+, iPod with AudioTools app, Thunderboard Sense 2). The combined cohort comprises 309 patients aged >18 with ICU stays >24 hours. Delirium labels were derived daily from EHR structured scores including CAM-ICU, Richmond Agitation Sedation Scale (RASS), and Glasgow Coma Scale (GCS) using a published computable phenotype algorithm. Patients were classified as delirious if they had at least one episode in the prediction window.
Architecture/algorithms: Four sequential neural network models were trained on processed features: LSTM, GRU, Temporal CNN, and Transformer. The input features were statistical summaries of sound pressure levels (max, min, percentiles) for day and night periods and averaged light intensities similarly split. The CNN model consisted of convolutional layers with ReLU activations, ending in a fully connected sigmoid output layer predicting delirium risk binary classification.
Training regime: Models were trained for binary cross-entropy loss using Adam optimizer with learning rate 0.001, batch size 8. Three-fold cross-validation was used on a development set (N=247) to optimize hyperparameters and select the best models, which were then evaluated on a held-out test set (N=62). Random seeds not specifically mentioned.
Evaluation protocol: Metrics included area under the ROC curve (AUC), accuracy, F1-score, precision, sensitivity, specificity, negative predictive value. Confidence intervals (95%) were estimated via 100 bootstrap resamples. Ablations included training on sound only, light only, and combined modalities across 10 prediction windows from 1 to 28 days. Relative risk ratios were computed to assess temporal risk stratification capability.
Reproducibility: No explicit mention of code or data release. Dataset contains sensitive ICU clinical and sensor data, likely not publicly available. The processing pipeline for statistical features and labeling is described in detail.
Concrete example: For predicting delirium risk over a 7-day horizon, sound pressure level features aggregated daily from Thunderboard and AudioTools app were zero-padded to a 7-day input sequence. The CNN model received these inputs, applied layers of convolution with ReLU, and output a probability of delirium occurrence. Models trained with sound only showed AUC ~0.80 on the test set. SHAP values for L90-day and Lmax-night were the largest positive contributions, indicating higher sustained daytime and maximum nighttime sound were key signals. This pipeline effectively distinguished patients at higher delirium risk within the ICU stay period from ambient environmental data alone.
Technical innovations
- First study to use pervasive ICU ambient sensing data (sound pressure levels and light intensity) alone to predict ICU delirium risk prospectively.
- Application of multiple sequential neural network architectures (LSTM, GRU, CNN, Transformer) to analyze temporal environmental feature sequences for clinical outcome prediction.
- Use of Shapley Additive Explanations (SHAP) to interpret multimodal model features and quantify their relative contribution to delirium risk prediction across time.
- Integration of heterogeneous sensors (wrist-worn Actigraph/iPod and room-based Thunderboard) homogenized by computing statistical sound descriptors for combined dataset construction.
Datasets
- ICU-ENV dataset — 309 patients — University of Florida ICU data from PAIN and ADAPT prospective studies
- Sound data — daily statistical descriptors of ICU sound pressure levels collected via AudioTools app on iPod and Thunderboard Sense 2
- Light data — daily daytime/nighttime average light intensity recorded by Actigraph GTX3+ and Thunderboard Sense 2
Baselines vs proposed
- Sound dataset CNN model: AUC = 0.80 for 28-day prediction window vs Light dataset CNN model: lower AUC with best at 5-day window
- Sound + Light combined CNN model: highest relative risk ratio at 7-day window with max RR 1.8x sound-only and 2.6x light-only models
- LSTM, GRU, Transformer models generally underperformed CNNs across datasets and prediction windows
Figures from the paper
Figures are reproduced from the source paper for academic discussion. Original copyright: the paper authors. See arXiv:2606.19292.
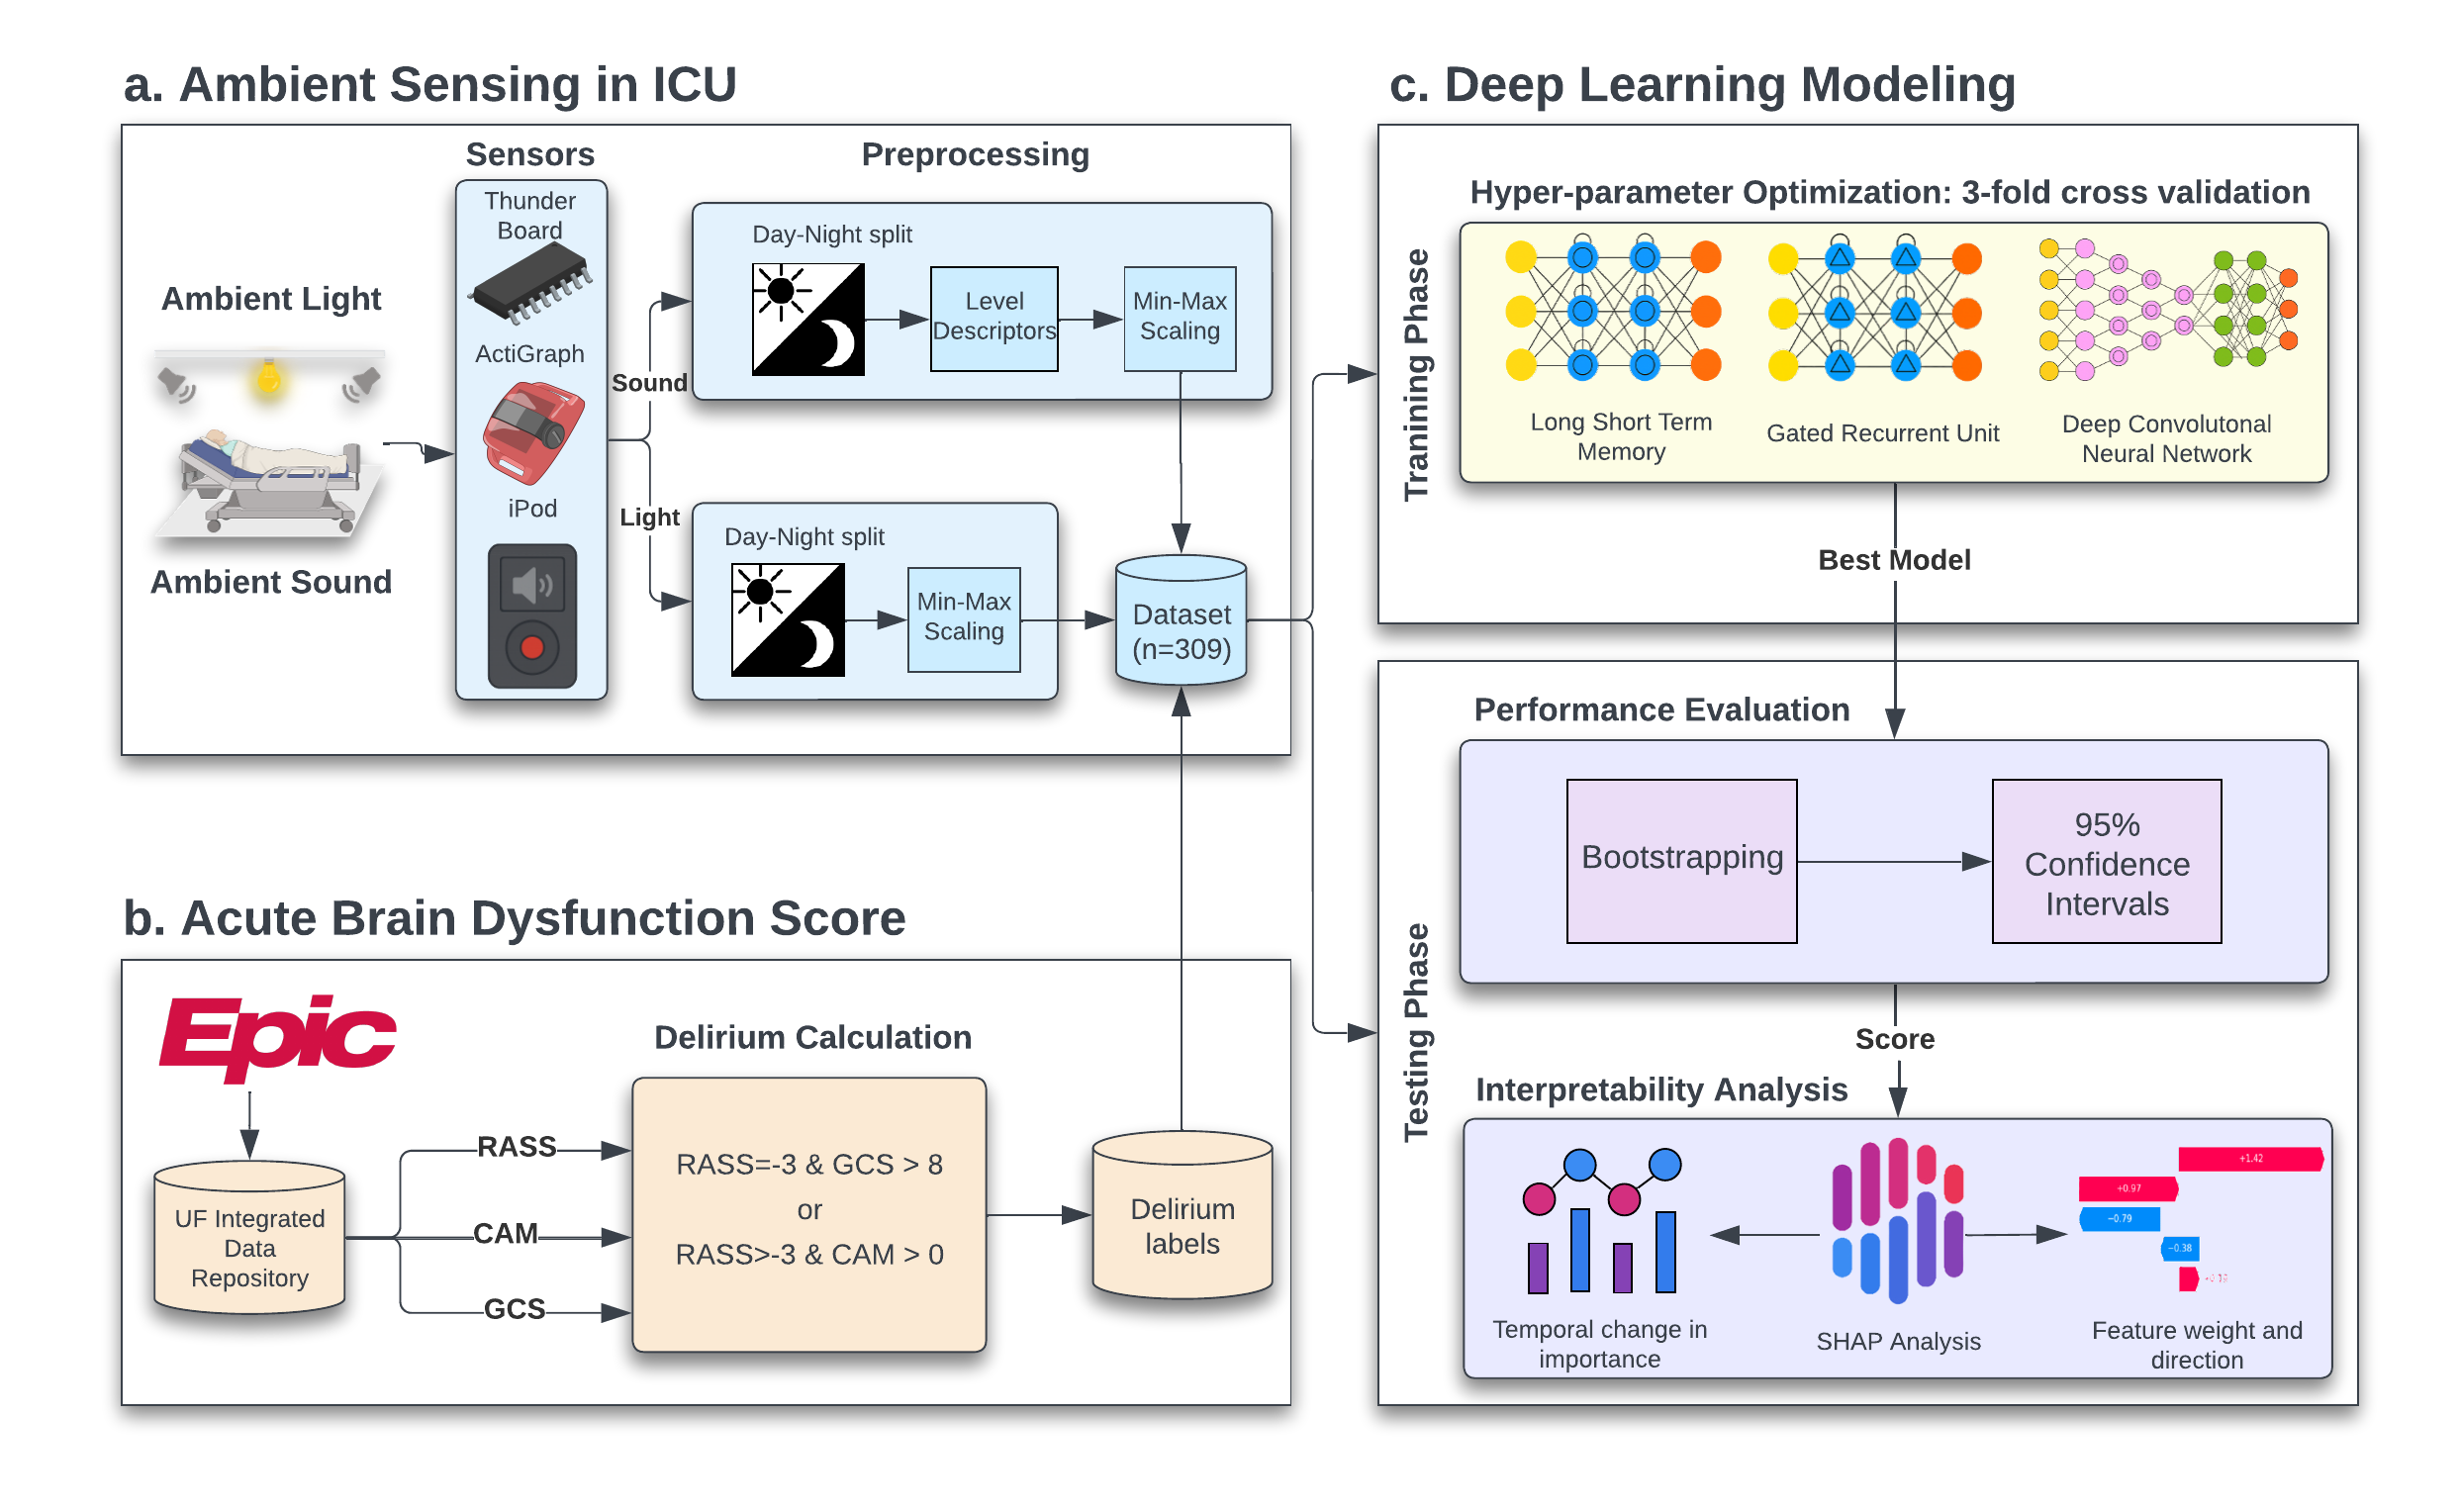
Fig 1: Conceptual Workflow of the methodology. a. Ambient light and sound data from ICU sensors (ThunderBoard, ActiGraph,
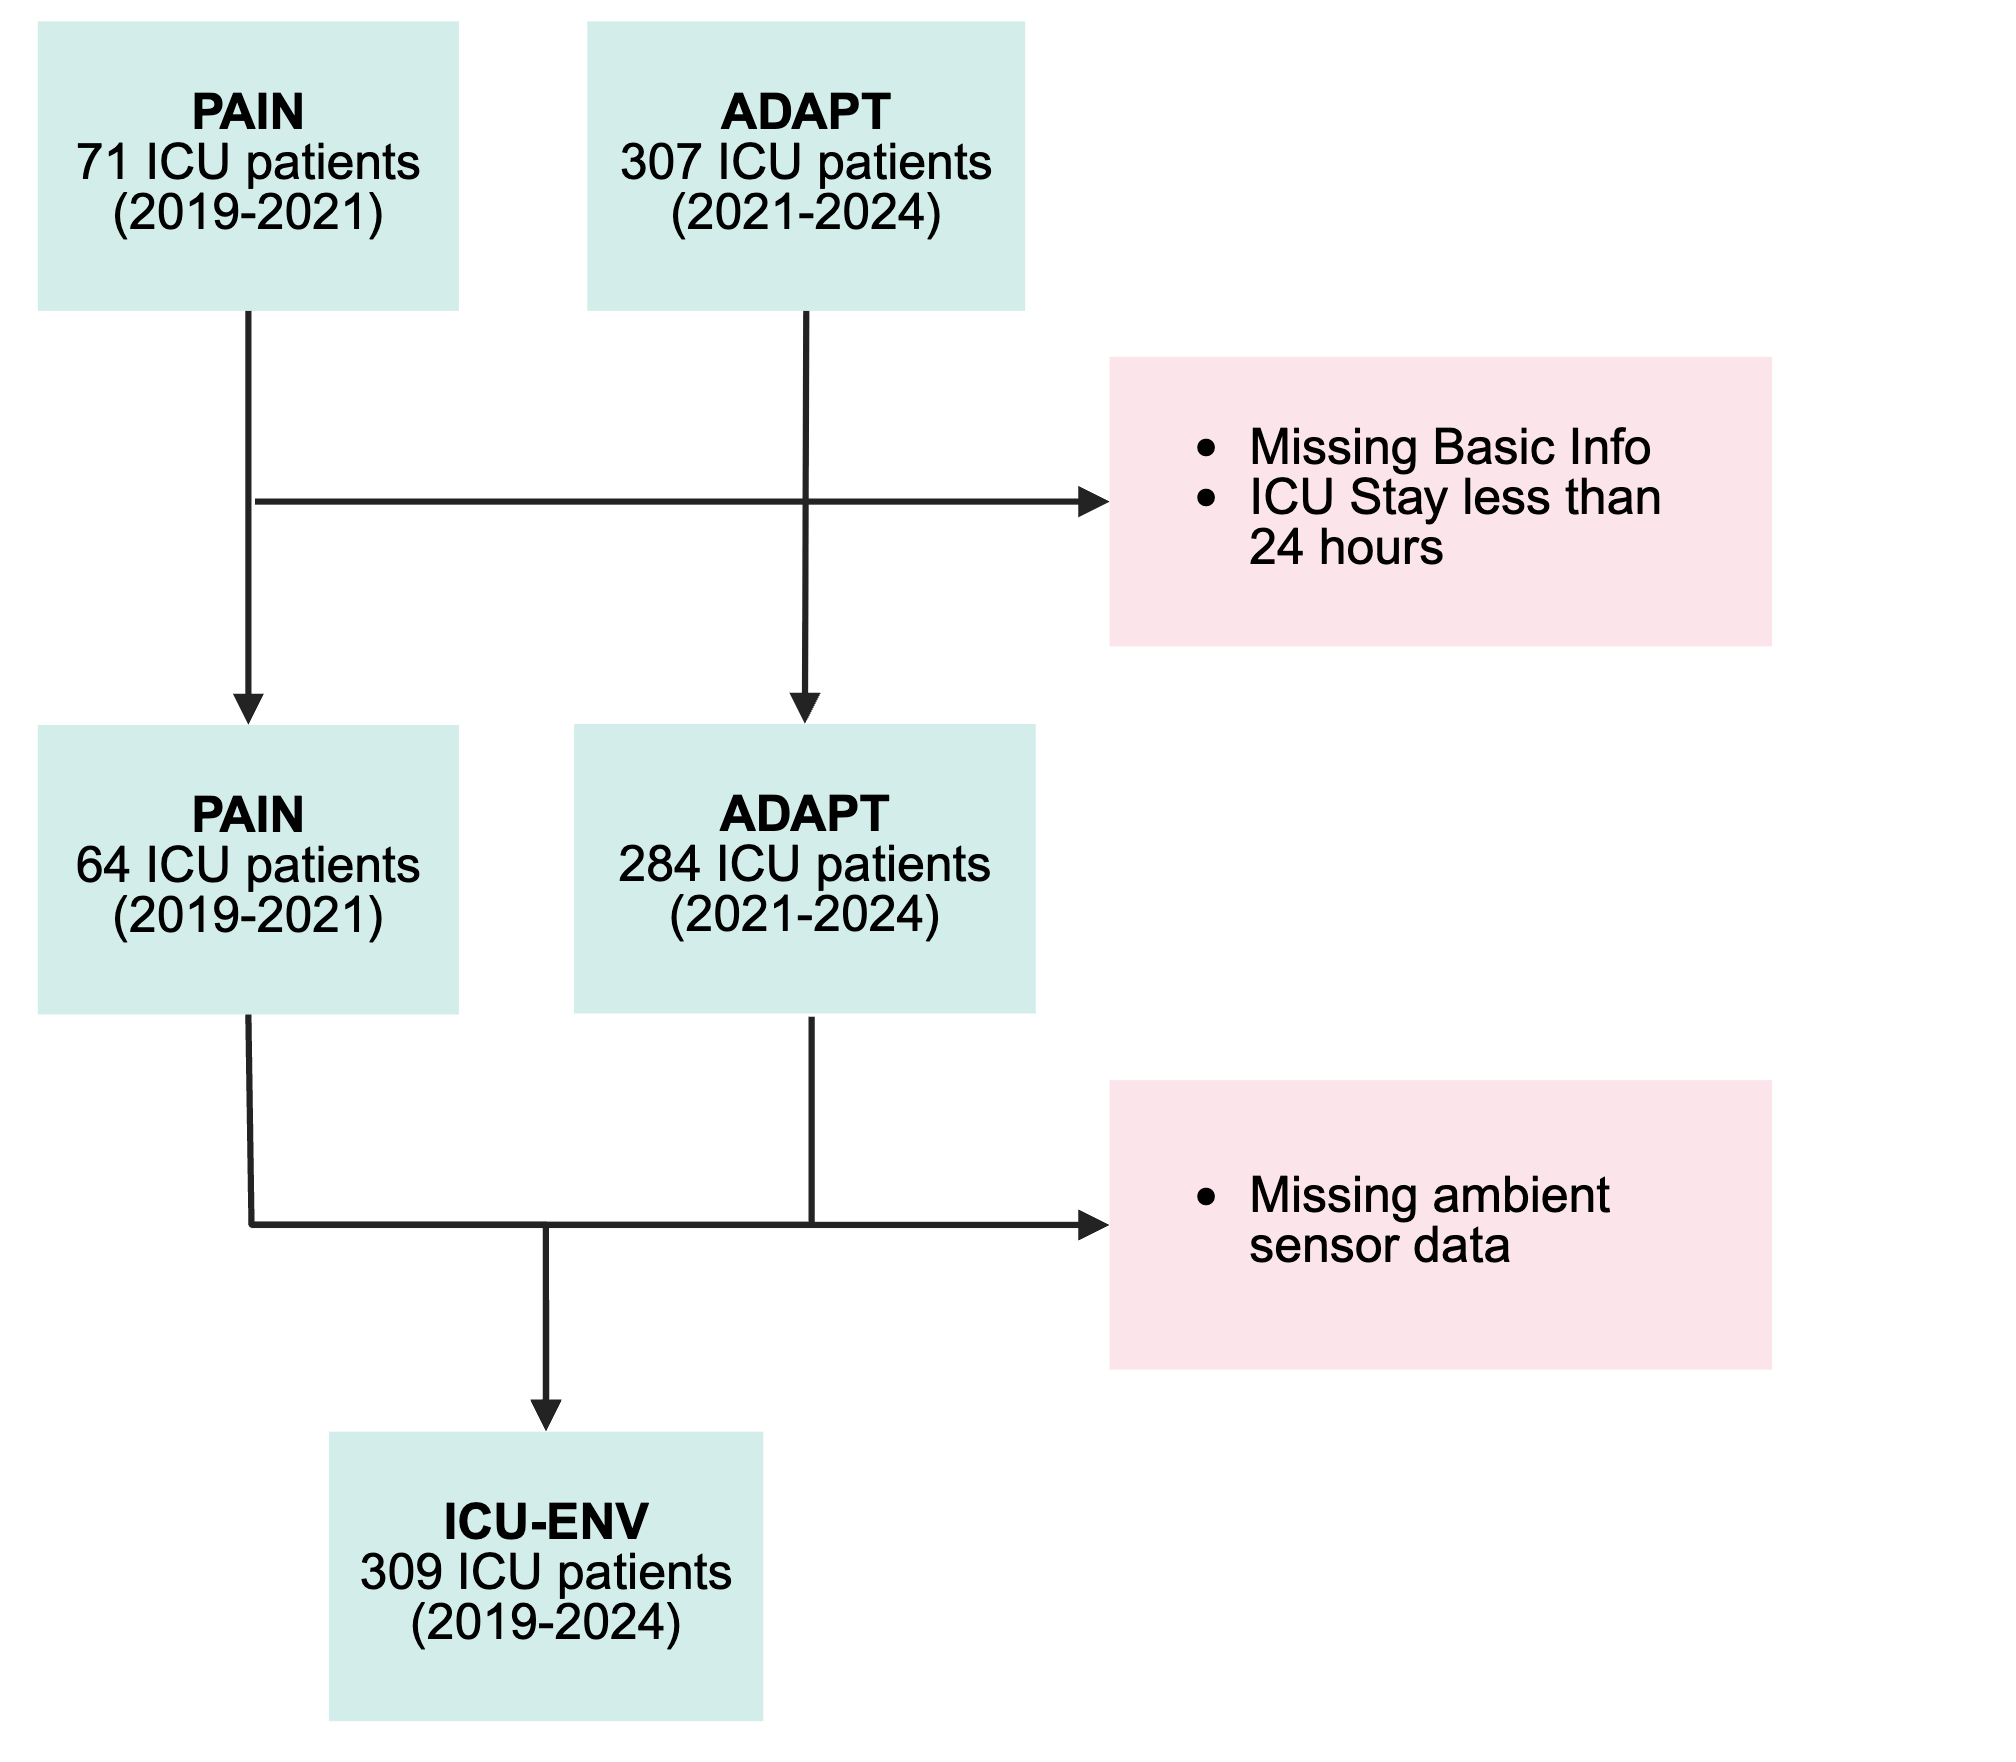
Fig 2: Cohort flow diagram. The ICU-ENV dataset includes
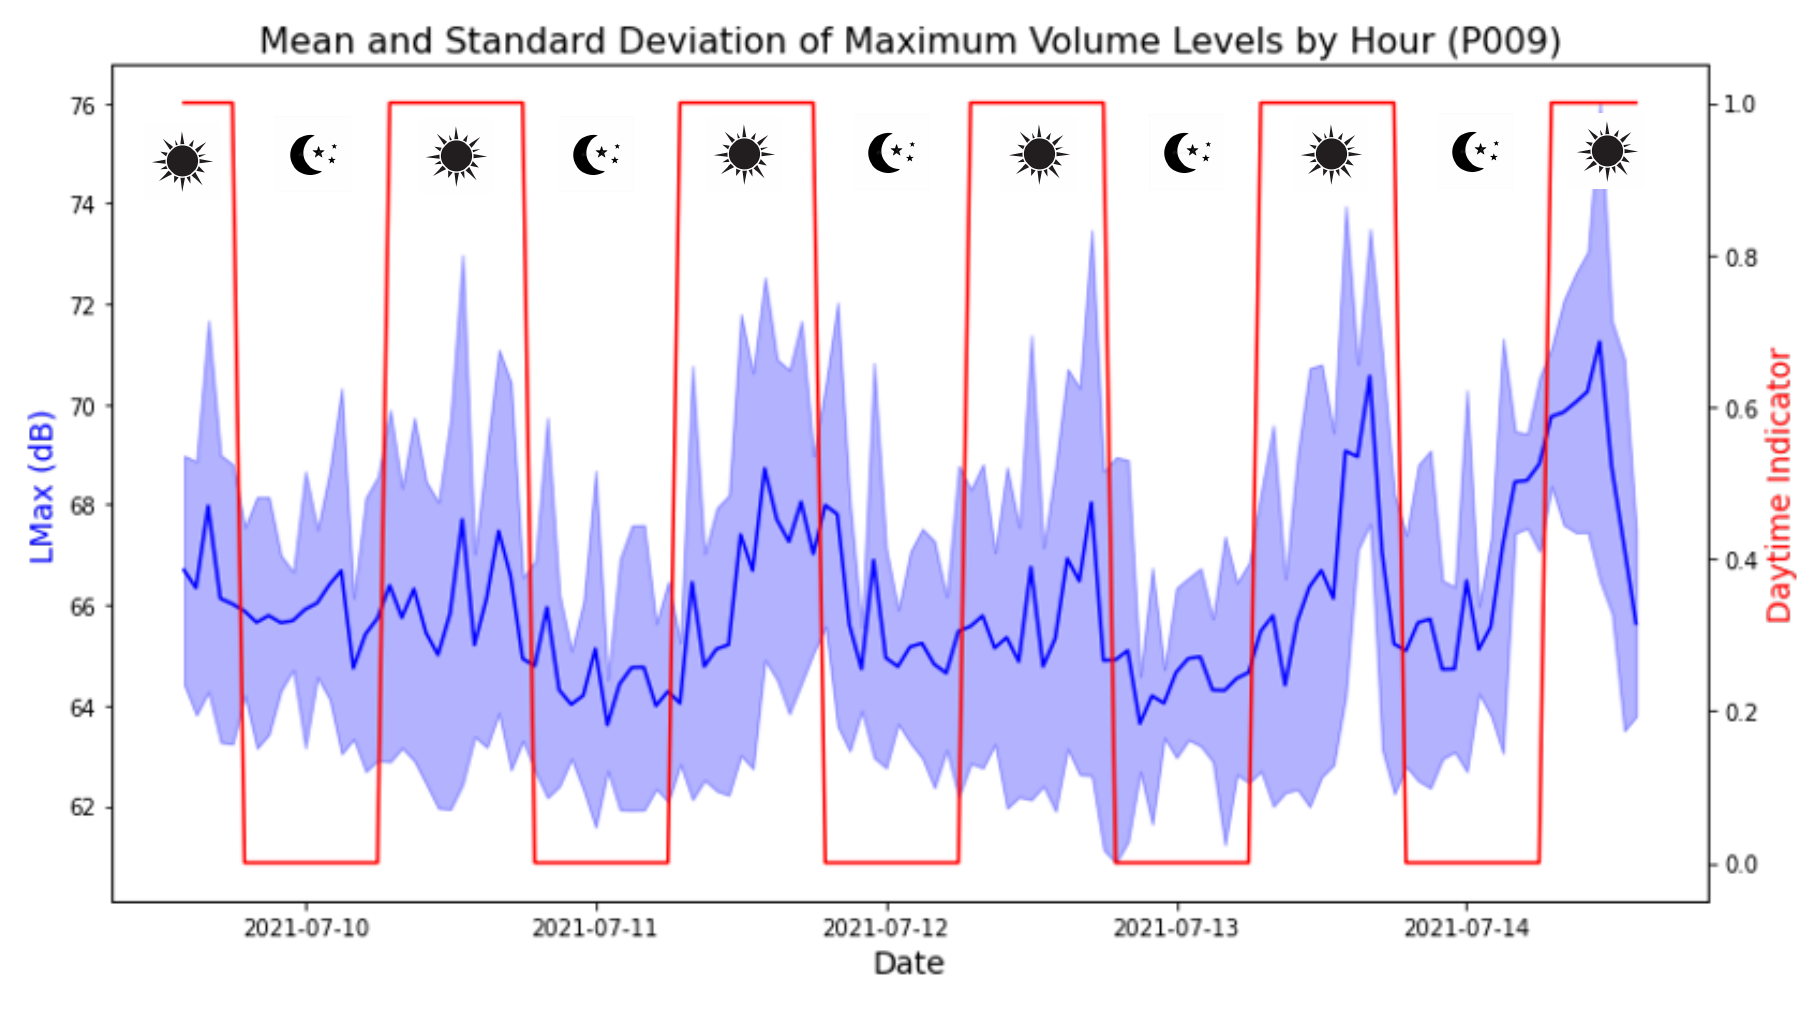
Fig 3: Mean and standard deviation of maximum noise in the
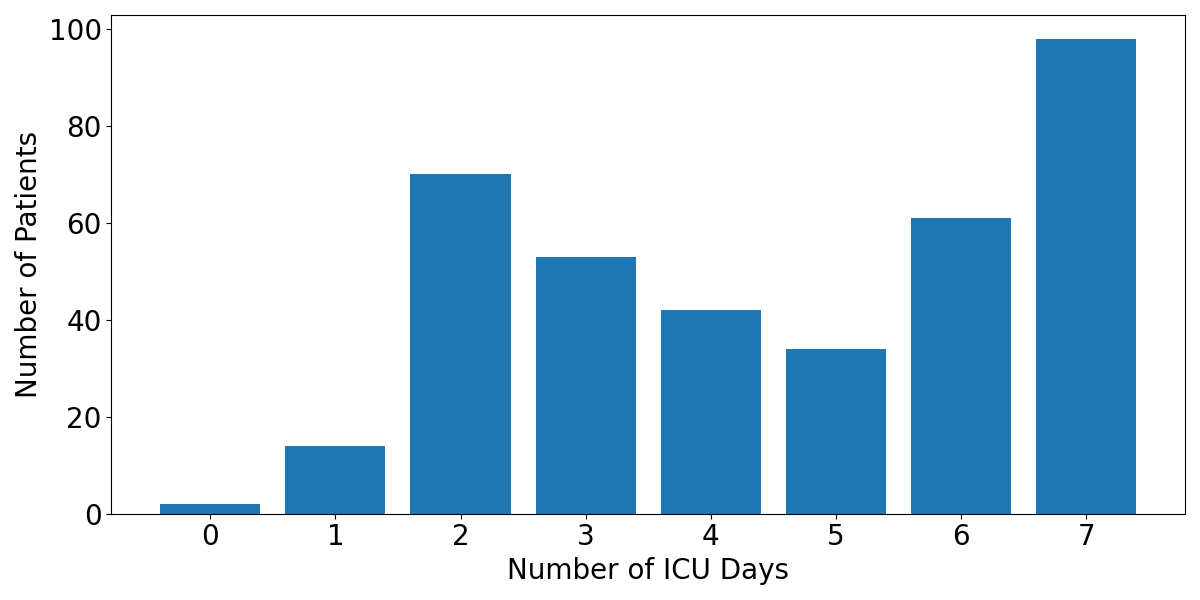
Fig 4: Distribution of the number of days of data collection.
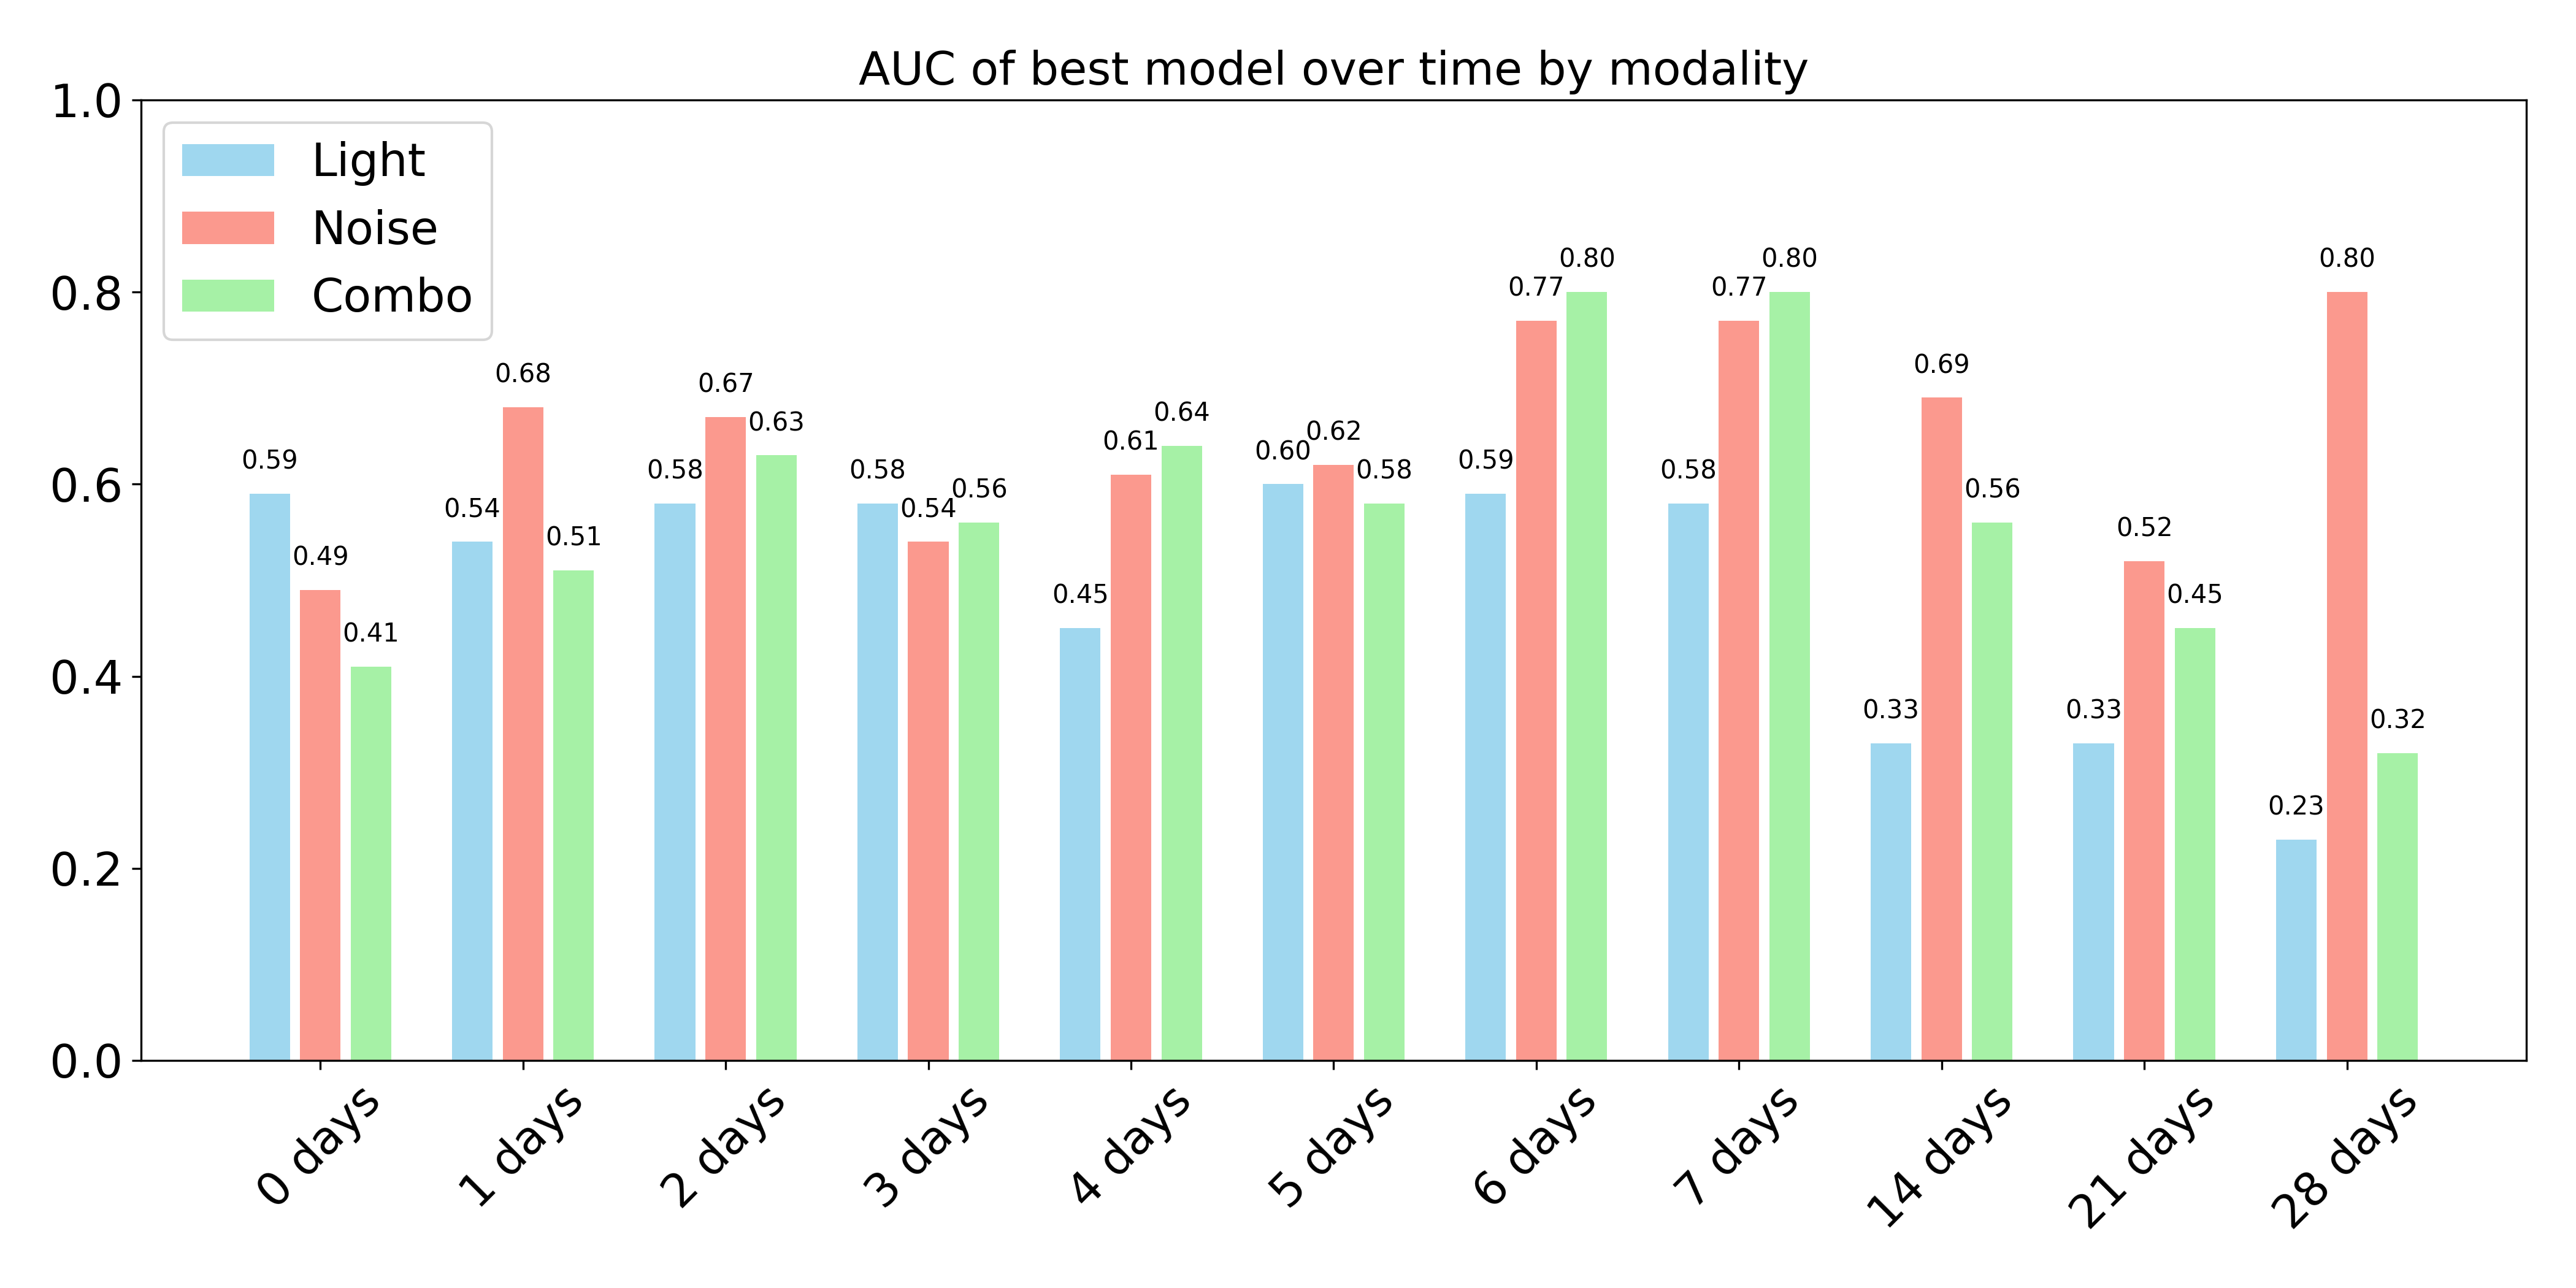
Fig 5: Best performances over a 1-month ICU stay for all
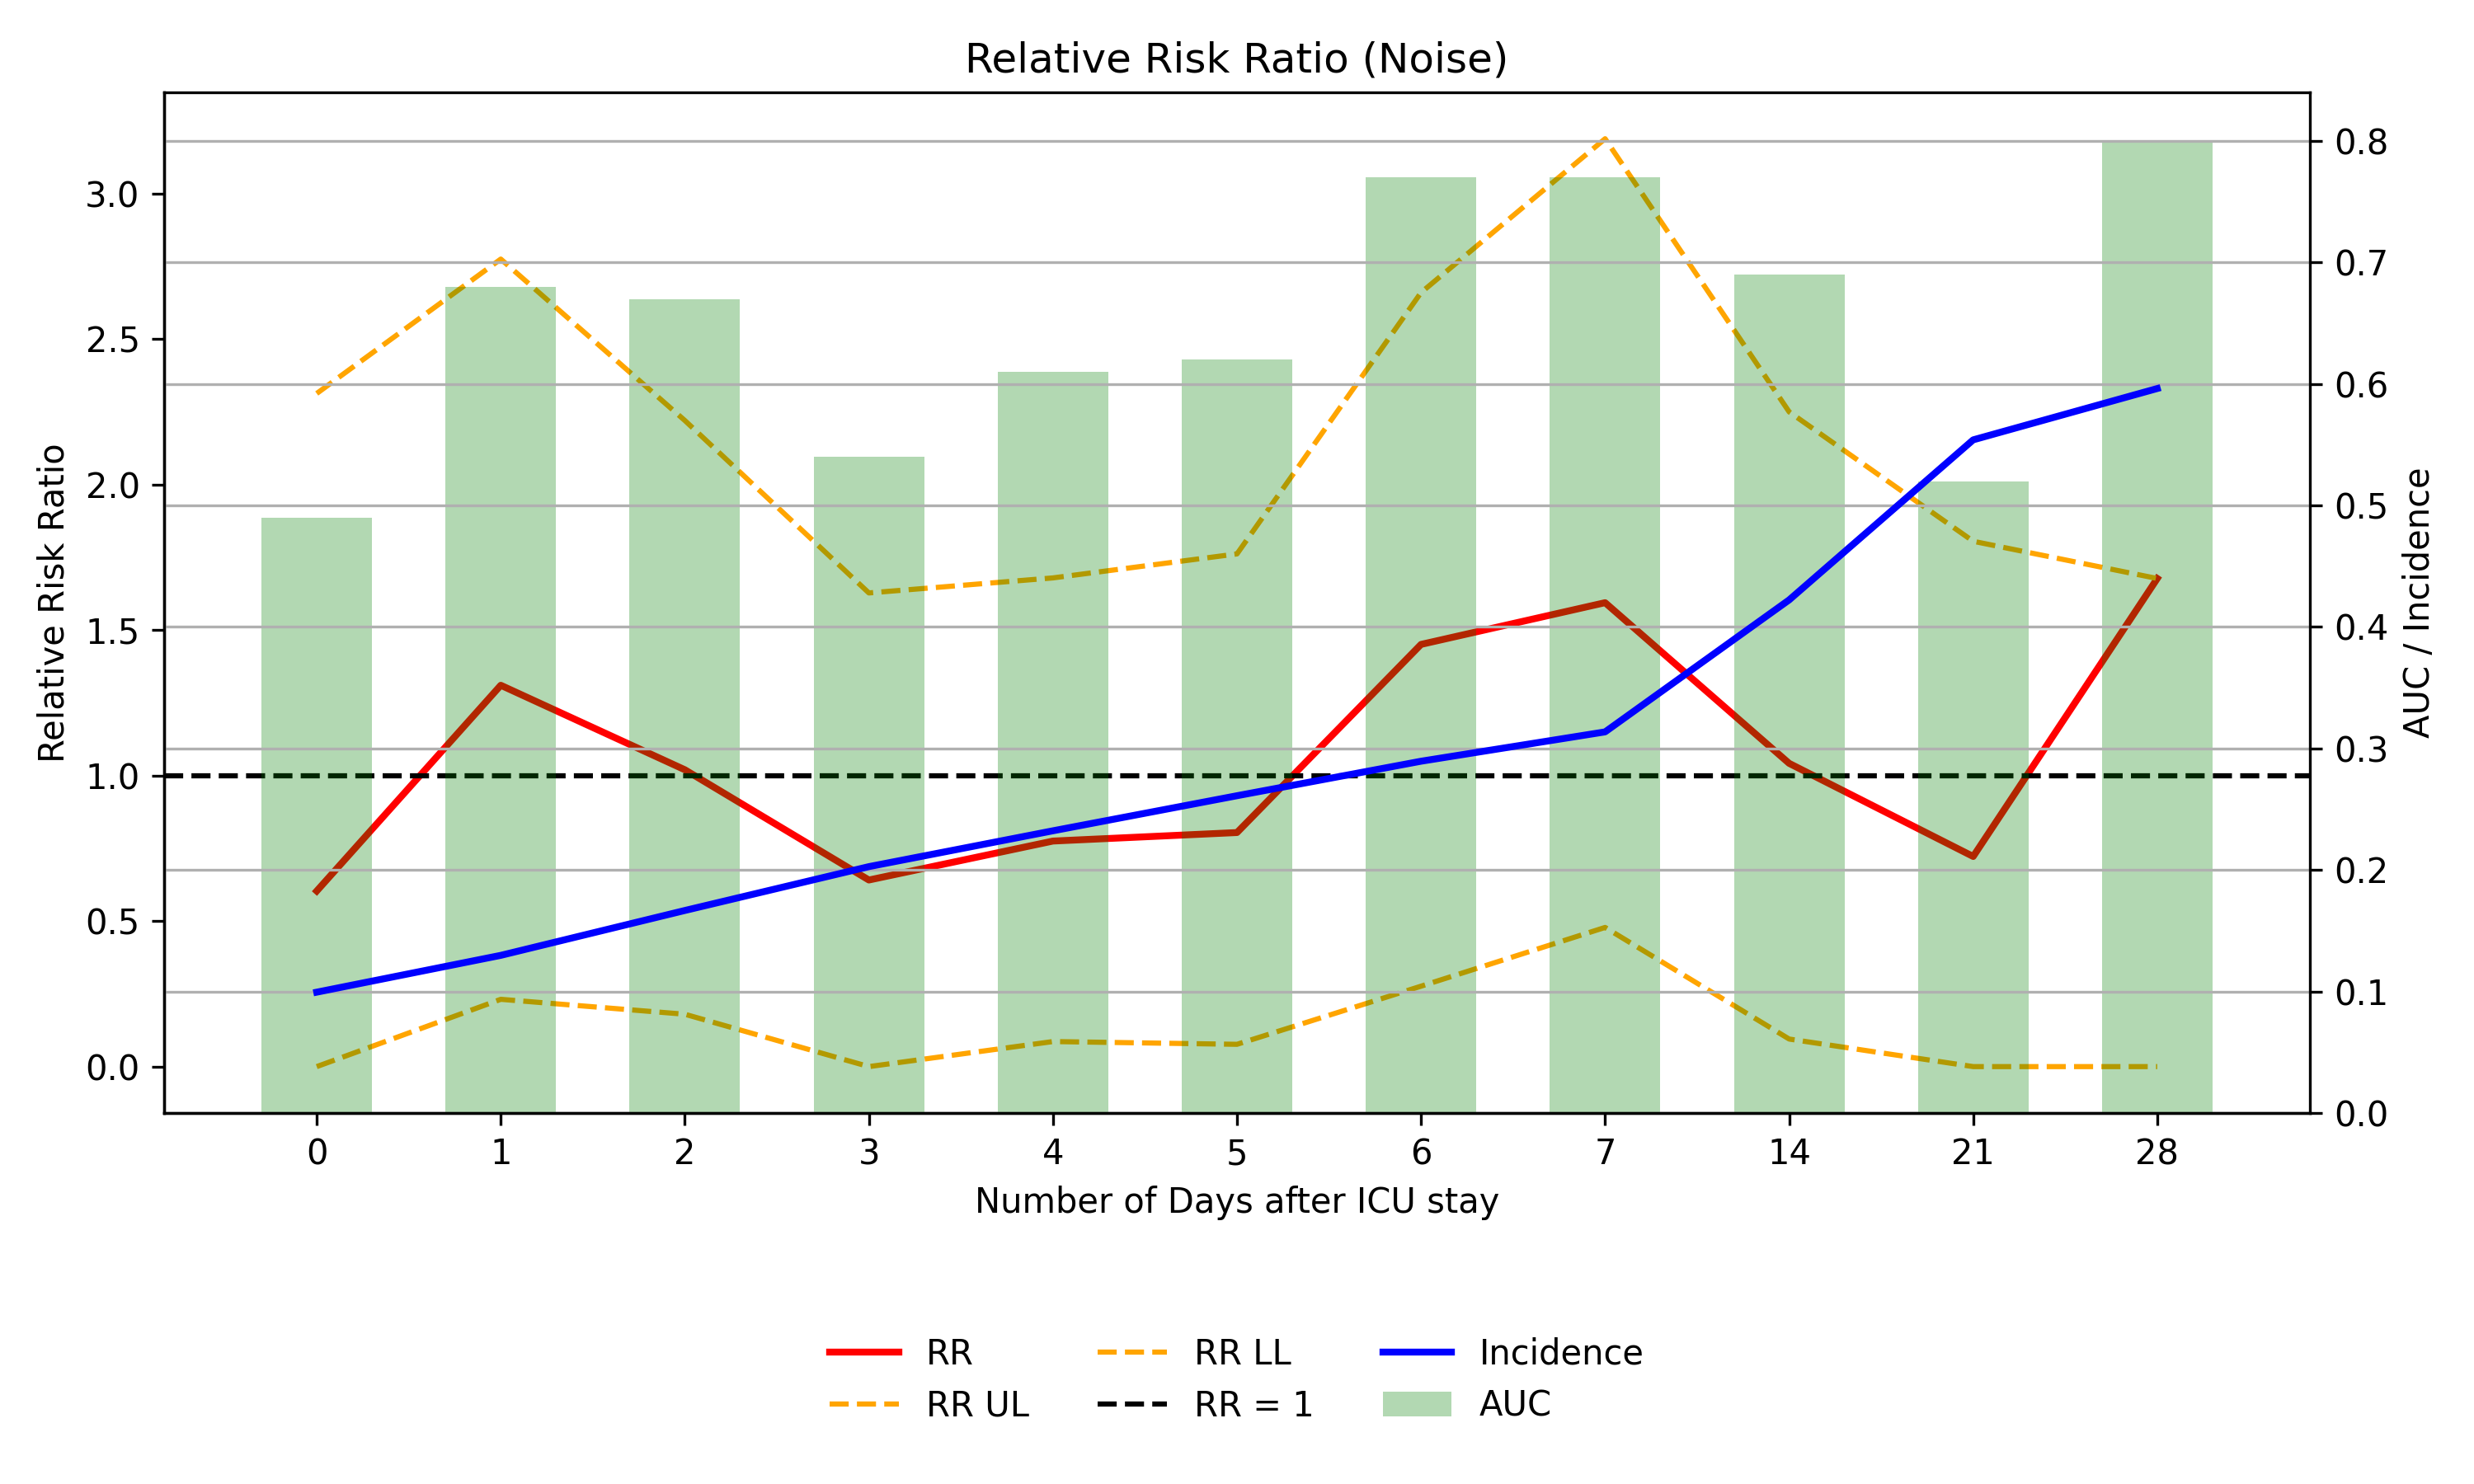
Fig 6: (a). Relative risk ratios were calculated for models
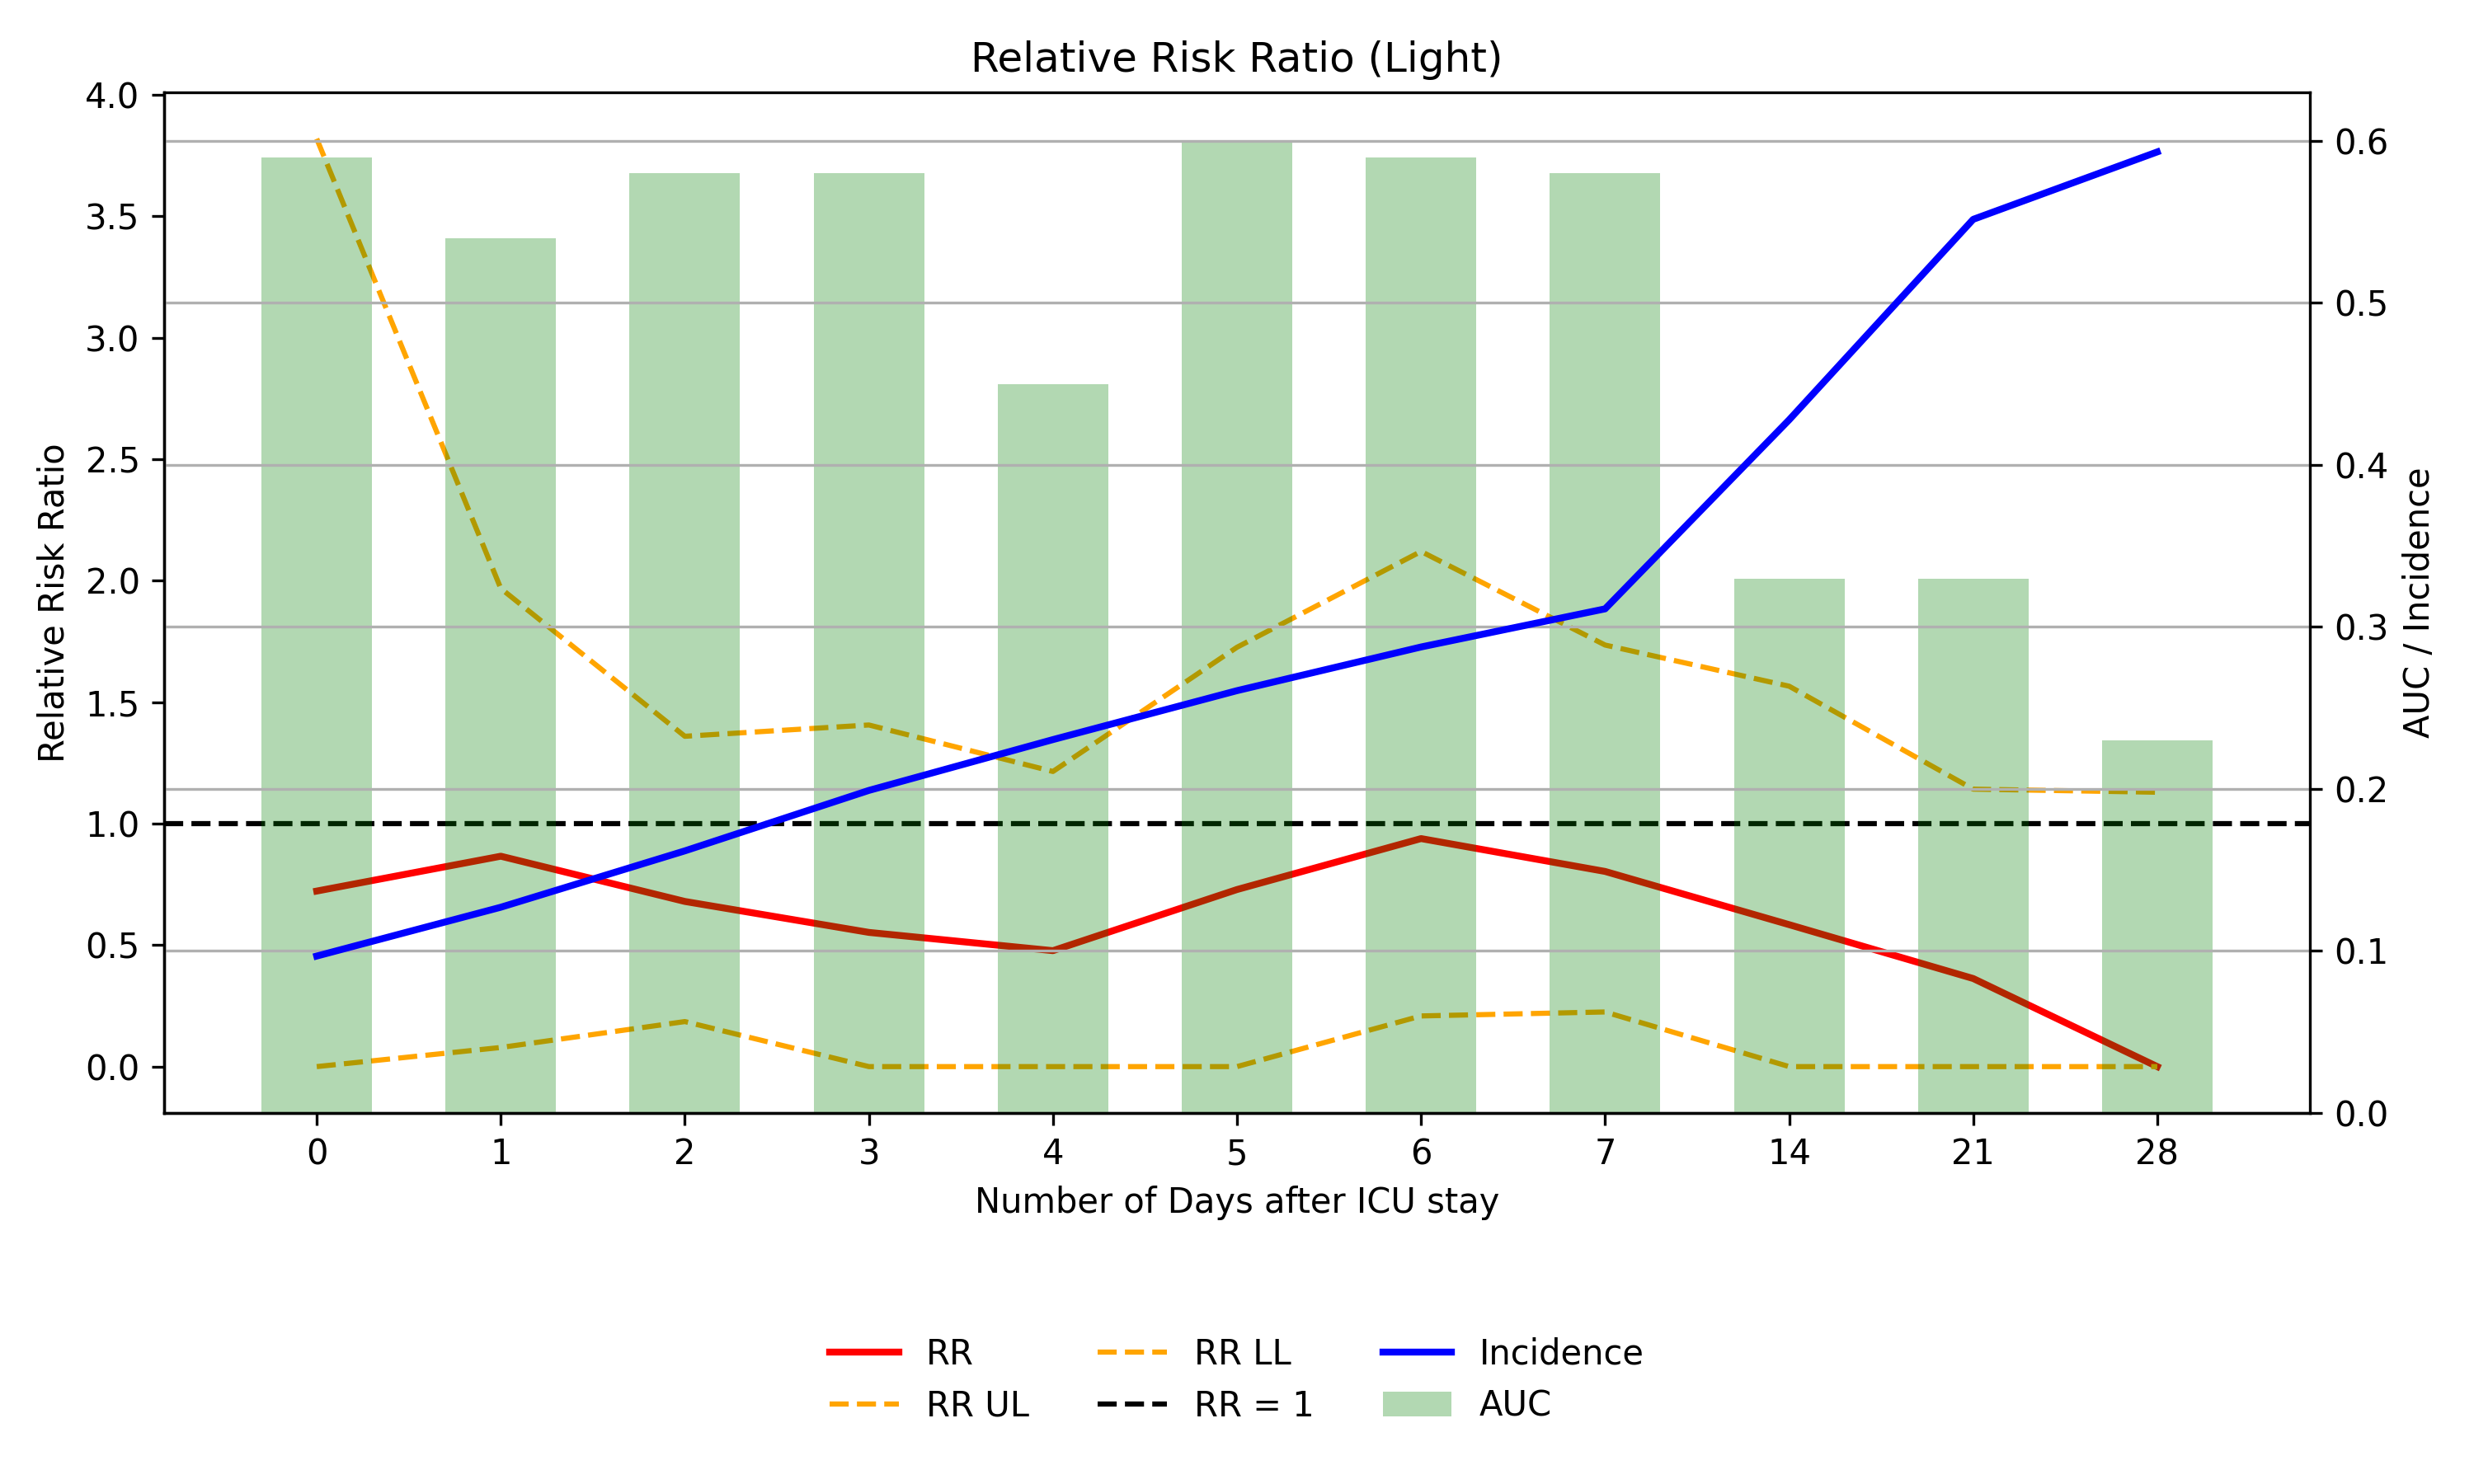
Fig 7: (a). Best model with sound (28-day prediction window),
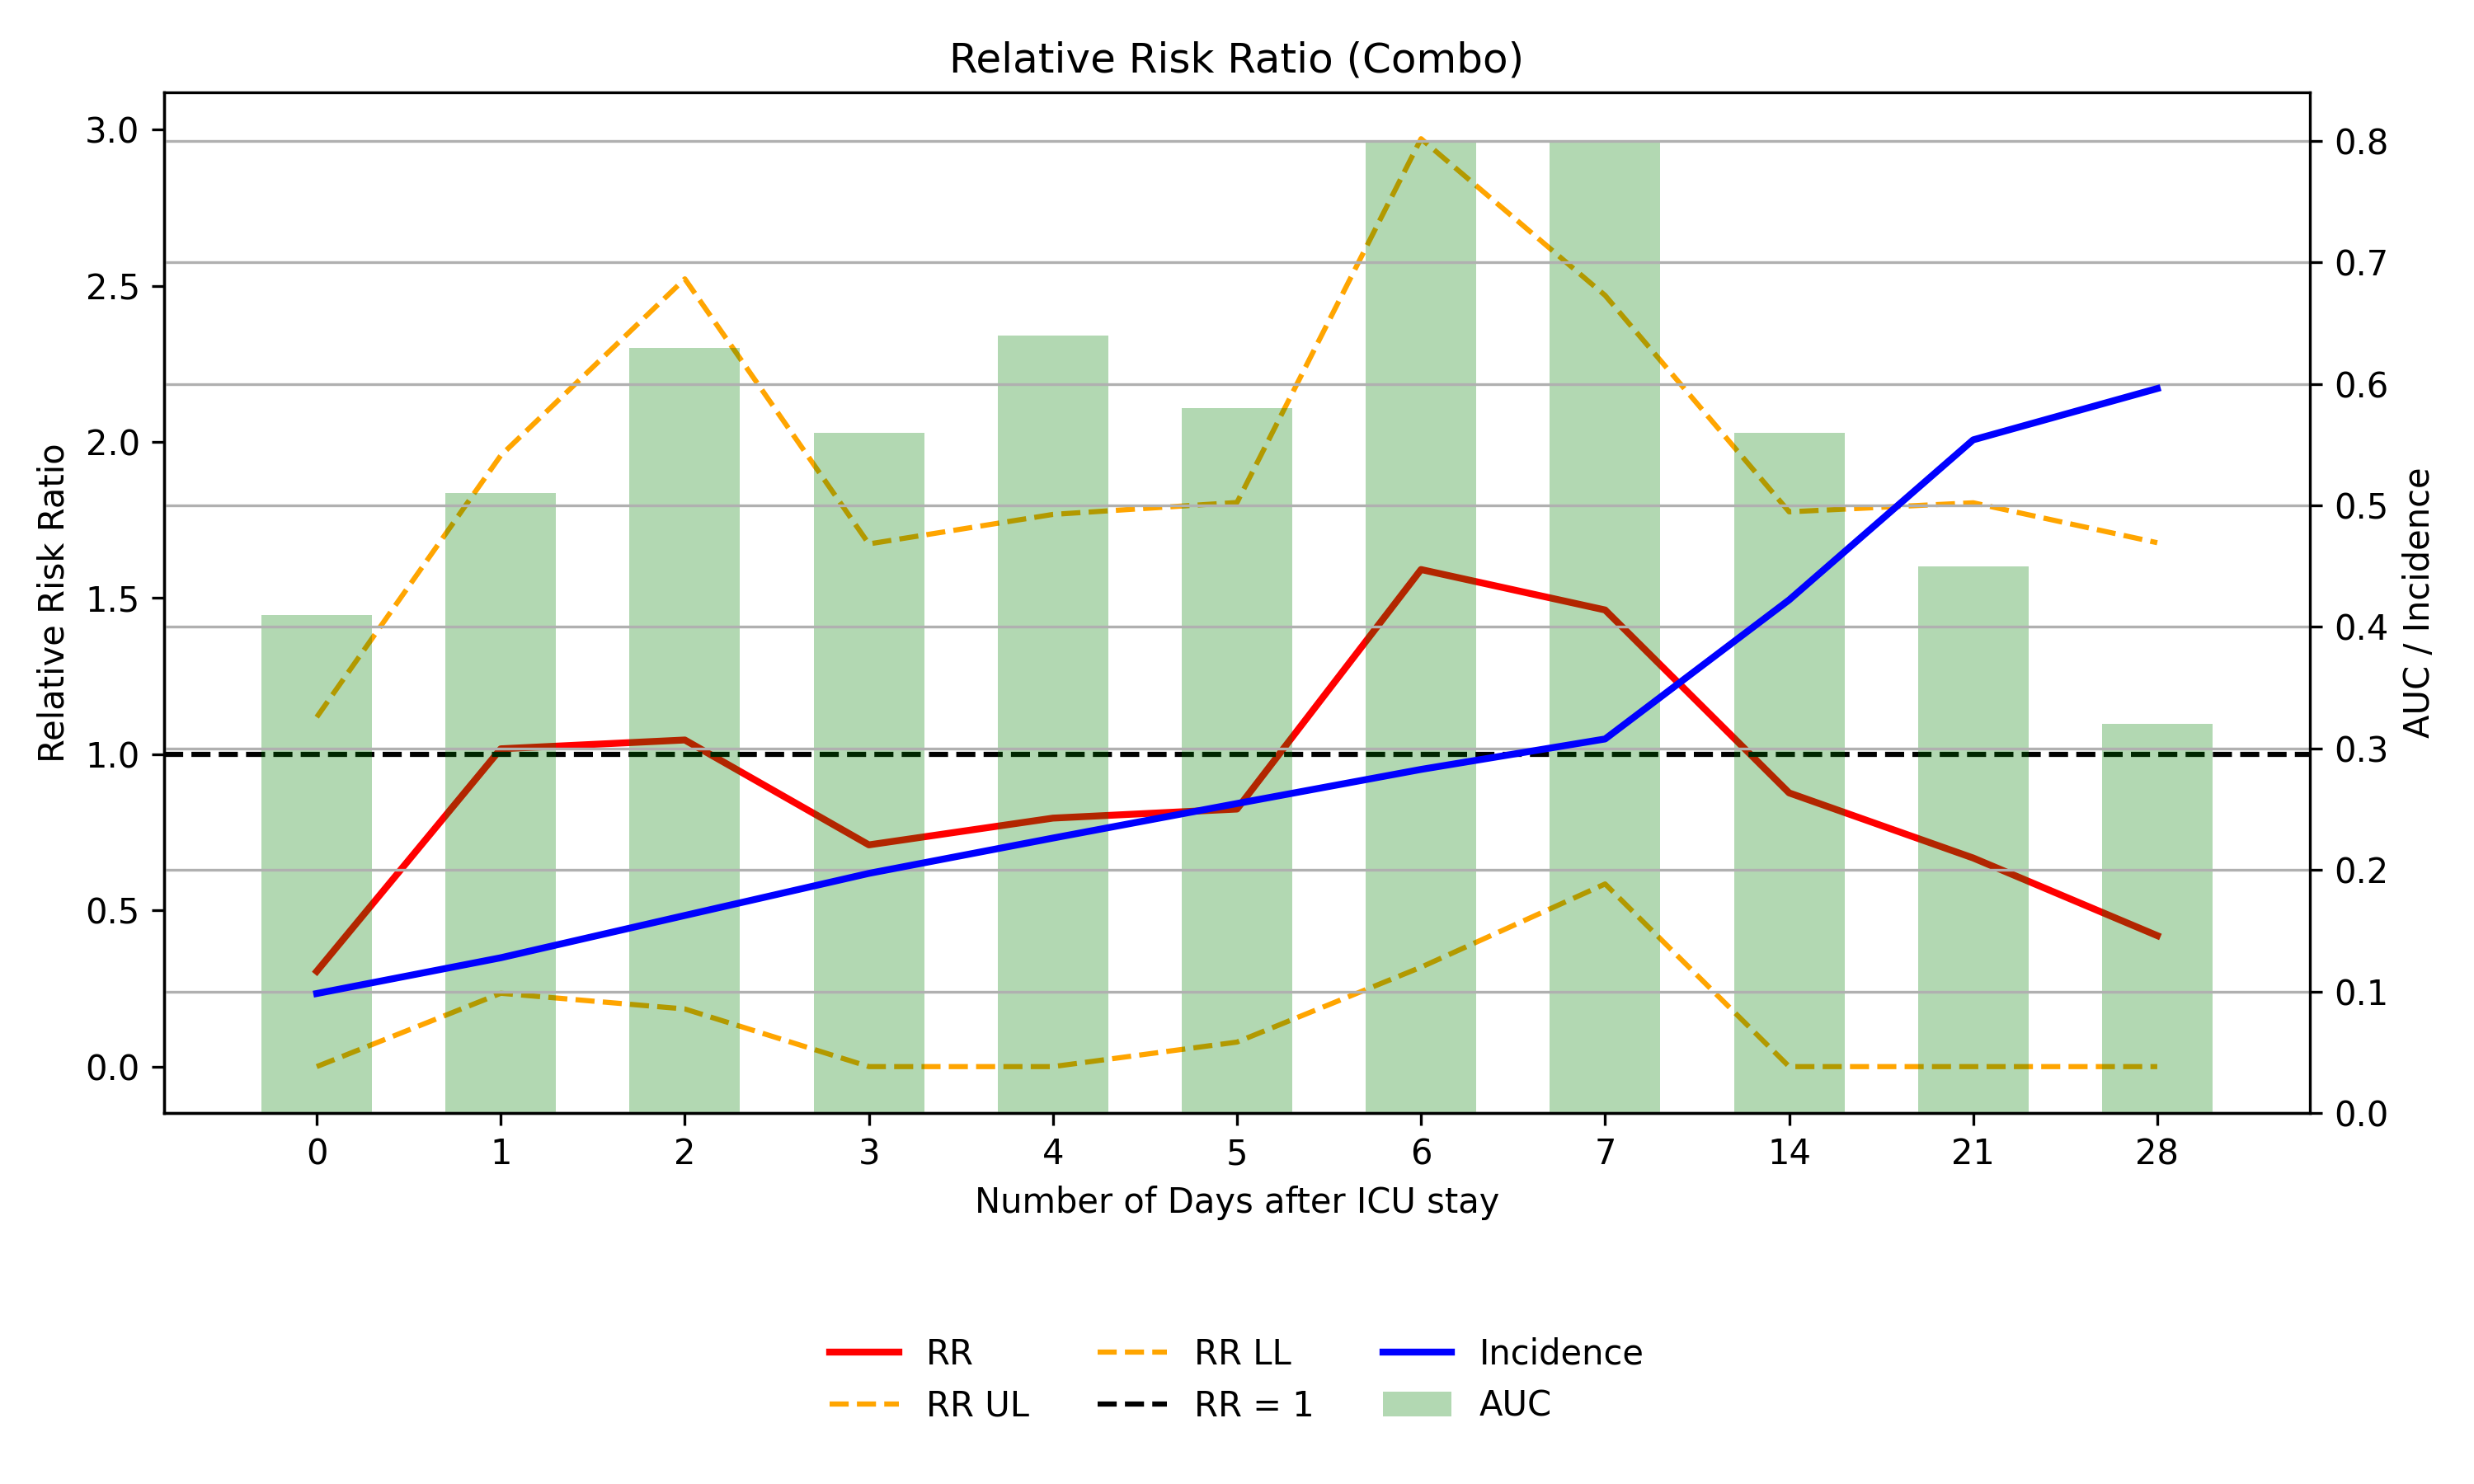
Fig 8: (a). shows the SHAP coefficients for the noise cohort
Limitations
- Single-center ICU cohort limits generalizability; external validation pending.
- Moderate sample size (N=309) constrains model complexity and risks overfitting.
- Light intensity data distributions differ significantly across sensors, introducing batch effects impacting model performance.
- No prospective deployment or real-time evaluation to verify clinical utility in ICU workflows.
- No adversarial testing or robustness evaluation against sensor noise or missing data.
- Predictive performance drops after combining modalities despite improved early risk detection, suggesting suboptimal multimodal fusion.
Open questions / follow-ons
- How to expand and standardize ambient sensing modalities to include richer environmental factors (e.g., temperature, humidity, motion) for enhanced delirium prediction?
- What multimodal fusion architectures can better combine light and sound features to maintain or improve overall classification performance?
- How will these predictive models perform prospectively in a real-world ICU setting with variable monitoring durations and sensor availability?
- Can ambient sensing models be integrated with clinical EHR or physiological data to create comprehensive, multimodal delirium risk assessment tools?
Why it matters for bot defense
While this study focuses on clinical delirium risk estimation, its approach to passive ambient sensing and time-series modeling via deep learning models shares conceptual similarities with behavioral observation and multimodal signal processing relevant to bot-defense. For bot-defense engineers, the demonstrated importance of integrating multiple sensor modalities (here light and sound) and the use of sequential neural networks like CNNs and recurrent units to capture temporal structure offers insights into designing systems that detect subtle environmental context changes predictive of anomalous behavior. The interpretability framework leveraging SHAP to quantify and visualize feature contributions provides a rigorous method for explaining model decisions, a critical need in high-stakes bot-defense scenarios to audit and tune risk scoring. However, the domain differences and lack of adversarial modeling mean direct applicability is limited; nonetheless, the paper exemplifies pipeline design for fusing noisy, heterogeneous sensor streams into robust temporal risk models with explainability—which is a transferable concept to captcha and bot-detection signal processing.
Cite
@article{arxiv2606_19292,
  title={ Risk Stratification for ICU Delirium using Pervasive Ambient Sensing Information },
  author={ Jiaqing Zhang and Sabyasachi Bandyopadhyay and Miguel Contreras and Jessica Sena and Yuanfang Ren and Andrea Davidson and Ziyuan Guan and Tezcan Ozrazgat-Baslanti and Subhash Nerella and Azra Bihorac and Parisa Rashidi },
  journal={arXiv preprint arXiv:2606.19292},
  year={ 2026 },
  url={https://arxiv.org/abs/2606.19292}
}