
Mapping a Quasar Outflow from Parsec to Kiloparsec Scales: A Combined HST Absorption and VLT Emission Investigation
Source: arXiv:2606.16967 · Published 2026-06-15 · By Mayank Sharma, Travis C. Fischer, Manuela Bischetti, Nahum Arav, Fabrizio Fiore, Chiara Feruglio et al.
TL;DR
This study tackles the observational gap linking nuclear quasar winds to their extended galactic-scale outflows across parsec-to-kiloparsec scales. Using integral-field spectroscopy from VLT/KMOS combined with archival HST/COS absorption line data and SDSS spectra of quasar PKS J0352−0711 at z = 0.9655, the authors trace outflow properties simultaneously on scales from ~10 pc to >8 kpc. They identify multiple kinematic components in both absorption and emission, revealing a physical progression where a nuclear wind with a constant velocity (~−3800 km/s) at ~9–40 pc decelerates to ~−2100 km/s at ~500 pc, consistent with mass loading from the ISM, and finally expands into a wide-angle galactic-scale outflow at >8 kpc with velocity ~−1000 km/s. Despite the velocity decrease by a factor of ~4 over three orders of magnitude in spatial scale, the momentum flux remains roughly constant within uncertainties. This linkage provides a direct observational demonstration of an evolving quasar-driven outflow connecting the nuclear engine to galaxy-scale feedback, supporting sustained AGN feedback affecting host galaxy evolution.
Key findings
- Detection of a nuclear outflow component S2 at ~9 pc with velocity vmax ≈ −3700 km/s and mass outflow rate ~7–9 M⊙/yr (Miller et al. 2020b).
- An intermediate absorption system S1 at ~520 pc decelerated to vmax ≈ −2100 km/s with mass outflow rate ~10.6 M⊙/yr, indicating ISM mass-loading.
- The spatially resolved emission component B traces a wide-angle outflow extending to ~8.4 kpc with vmax ≈ −1000 km/s and mass outflow rate ~10.1 M⊙/yr.
- A broad, unresolved emission component C with vmax ≈ −3900 km/s is spatially limited between ~40–2400 pc, with ˙M = 1–17 M⊙/yr.
- Momentum fluxes ˙P of outflows at different scales remain consistent within uncertainties (~10^34–10^35 dyne), despite factor-of-four velocity decrease.
- [O III] emission line flux and velocity maps reveal distinct kinematic components corresponding to systemic host galaxy rotation (Component A) and high-velocity outflow (Component B).
- The high-ionization [Ne V] emission traces the inner (~2.4 kpc) higher-ionization, high-density phase of the outflow, kinematically consistent with [O III] Component B.
- The evolutionary sequence from absorption to emission tracing the wind from nuclear to galactic scales is established for the first time in a single quasar.
Methodology — deep read
Threat Model & Assumptions: The goal is to observationally trace quasar-driven outflows from nuclear to galactic scales. There is no direct adversarial setup, but the study assumes that absorption and emission signatures probe physically related outflow phases and velocities. Geometry assumptions include that blueshifted emission traces the approaching outflow component and that obscuration hides any redshifted counterpart.
Data: Two nights of VLT/KMOS observations (IZ grating, R~3400) with 12 exposures totaling 3900s on quasar PKS J0352-0711 at z=0.9655, covering rest-frame 4000−5375 Å. Spatial resolution ~0.63" (seeing-limited), field 2.8"×2.8" sampled at 0.2" spaxels. Archival SDSS DR17 data from 2000 with 2700s exposure covers 1940−4690 Å at R ~ 2000. Archival HST/COS UV absorption data from Miller et al. (2020b).
Architecture / Algorithm: For KMOS, the authors construct data cubes with standard pipeline reductions. To isolate emission line components (Hβ and [O III]), they model continuum as a broken power-law plus Fe II templates (found negligible). Multi-Gaussian Bayesian Evidence Analysis Tool (BEAT) is applied per spectrum/spaxel using nested sampling to find statistically justified Gaussian components for emission lines. Kinematic parameters (velocity centroids, widths) are tied across lines where appropriate. PSF subtraction is performed using continuum windows to isolate extended emission from unresolved nucleus.
Training Regime: Not applicable (data analysis rather than machine-learned models). Statistical inference uses nested sampling for model evidence with >99% posterior probability criteria to select component number. Signal-to-noise >2 required to accept components in spaxels.
Evaluation Protocol: Velocity channel maps constructed from PSF-subtracted cubes illustrate spatially resolved emission structures. Gaussian component kinematics are mapped to identify systemic host galaxy emission vs. outflowing components. Mass outflow rates and energetics are derived from line luminosities, assumed densities, and measured velocities at various spatial scales. Cross-validation across different datasets and apertures confirms consistent kinematics. Uncertainties stem mainly from electron density assumptions and geometric projection effects. Comparisons are made to previous absorption-based measurements.
Reproducibility: The reduced KMOS data were obtained from ESO Phase 3 data releases. Archival SDSS and HST/COS data are public. Key analysis tools (BEAT, BADASS) are cited and publicly known. Exact code for fitting is not explicitly stated as released but methods and parameters are described in detail.
Concrete end-to-end example: The central nuclear [O III] spectrum is extracted from the 3×3 spaxel region, continuum-subtracted, and modeled with BEAT, revealing three emission components: a narrow systemic (FWHM 470 km/s), a broader blueshifted outflow (FWHM 1120 km/s, −360 km/s shift), and a very broad extreme wing (FWHM~4130 km/s, −390 km/s). This informs the outflow velocities and energetics near the nucleus, which are then compared to spatially resolved emission extending to kiloparsec scales and to absorption line data from HST at ~10 and ~500 pc.
Technical innovations
- Combined use of high-resolution UV absorption spectroscopy (HST/COS) with spatially resolved optical integral field spectroscopy (VLT/KMOS) to physically map a single quasar outflow across ~10 pc to >8 kpc scales.
- Application of Bayesian Evidence Analysis Tool (BEAT) with nested sampling to rigorously decompose emission line profiles into statistically justified multi-Gaussian kinematic components.
- Use of PSF subtraction employing line-free continuum windows to disentangle unresolved nuclear emission from spatially resolved outflow components in IFU data.
- Integration of multi-ionization tracer lines ([O III], [Ne V], [Ne III]) in emission with UV mini-BAL absorption lines to establish outflow velocity and density structure as a function of radius.
Datasets
- VLT/KMOS IFU data on PKS J0352−0711 — 3900 s total exposure, 2.8"×2.8" field, R ~3400 — ESO Phase 3 public
- Sloan Digital Sky Survey DR17 spectrum of PKS J0352−0711 — 2700 s exposure, R ~2000 — public
- HST Cosmic Origins Spectrograph Mini-BAL absorption spectra of PKS J0352−0711 — previously published in Miller et al. (2020b) — public
Baselines vs proposed
- Absorption outflow S2 (HST): vmax = −3700 km/s, R ~9 pc, ˙M ~7–9 M⊙/yr vs emission component C (VLT): vmax ≈ −3900 km/s, R min 40 pc to max 2.4 kpc, ˙M = 1–17 M⊙/yr
- Absorption outflow S1 (HST): vmax = −2100 km/s, R ~520 pc, ˙M ~10.6 M⊙/yr vs emission outflow B (VLT): vmax ≈ −1000 km/s, R > 8.4 kpc, ˙M ~10.1 M⊙/yr
- [Ne V] emission: velocity centroid and width match [O III] outflow component B within 20% broader line widths
- Mass outflow rates and momentum fluxes consistent within uncertainties across spatially separated components despite velocity decreasing by factor ~4
Figures from the paper
Figures are reproduced from the source paper for academic discussion. Original copyright: the paper authors. See arXiv:2606.16967.
Fig 1: VLT/KMOS spectrum of the [O iii] region in PKS 0352,
Fig 2: PSF-subtracted flux maps of the extended [O iii] emission around PKS 0352. (a) Total integrated flux map. (b) Emission near
Fig 3: Spatially resolved maps of the two distinct components of the [O iii] line emission, showing only spaxels with a > 2σ detection. The
Fig 4: Spatially resolved kinematics of the extended [O iii] emission. Center: Flux map generated by integrating the rest-frame spectrum
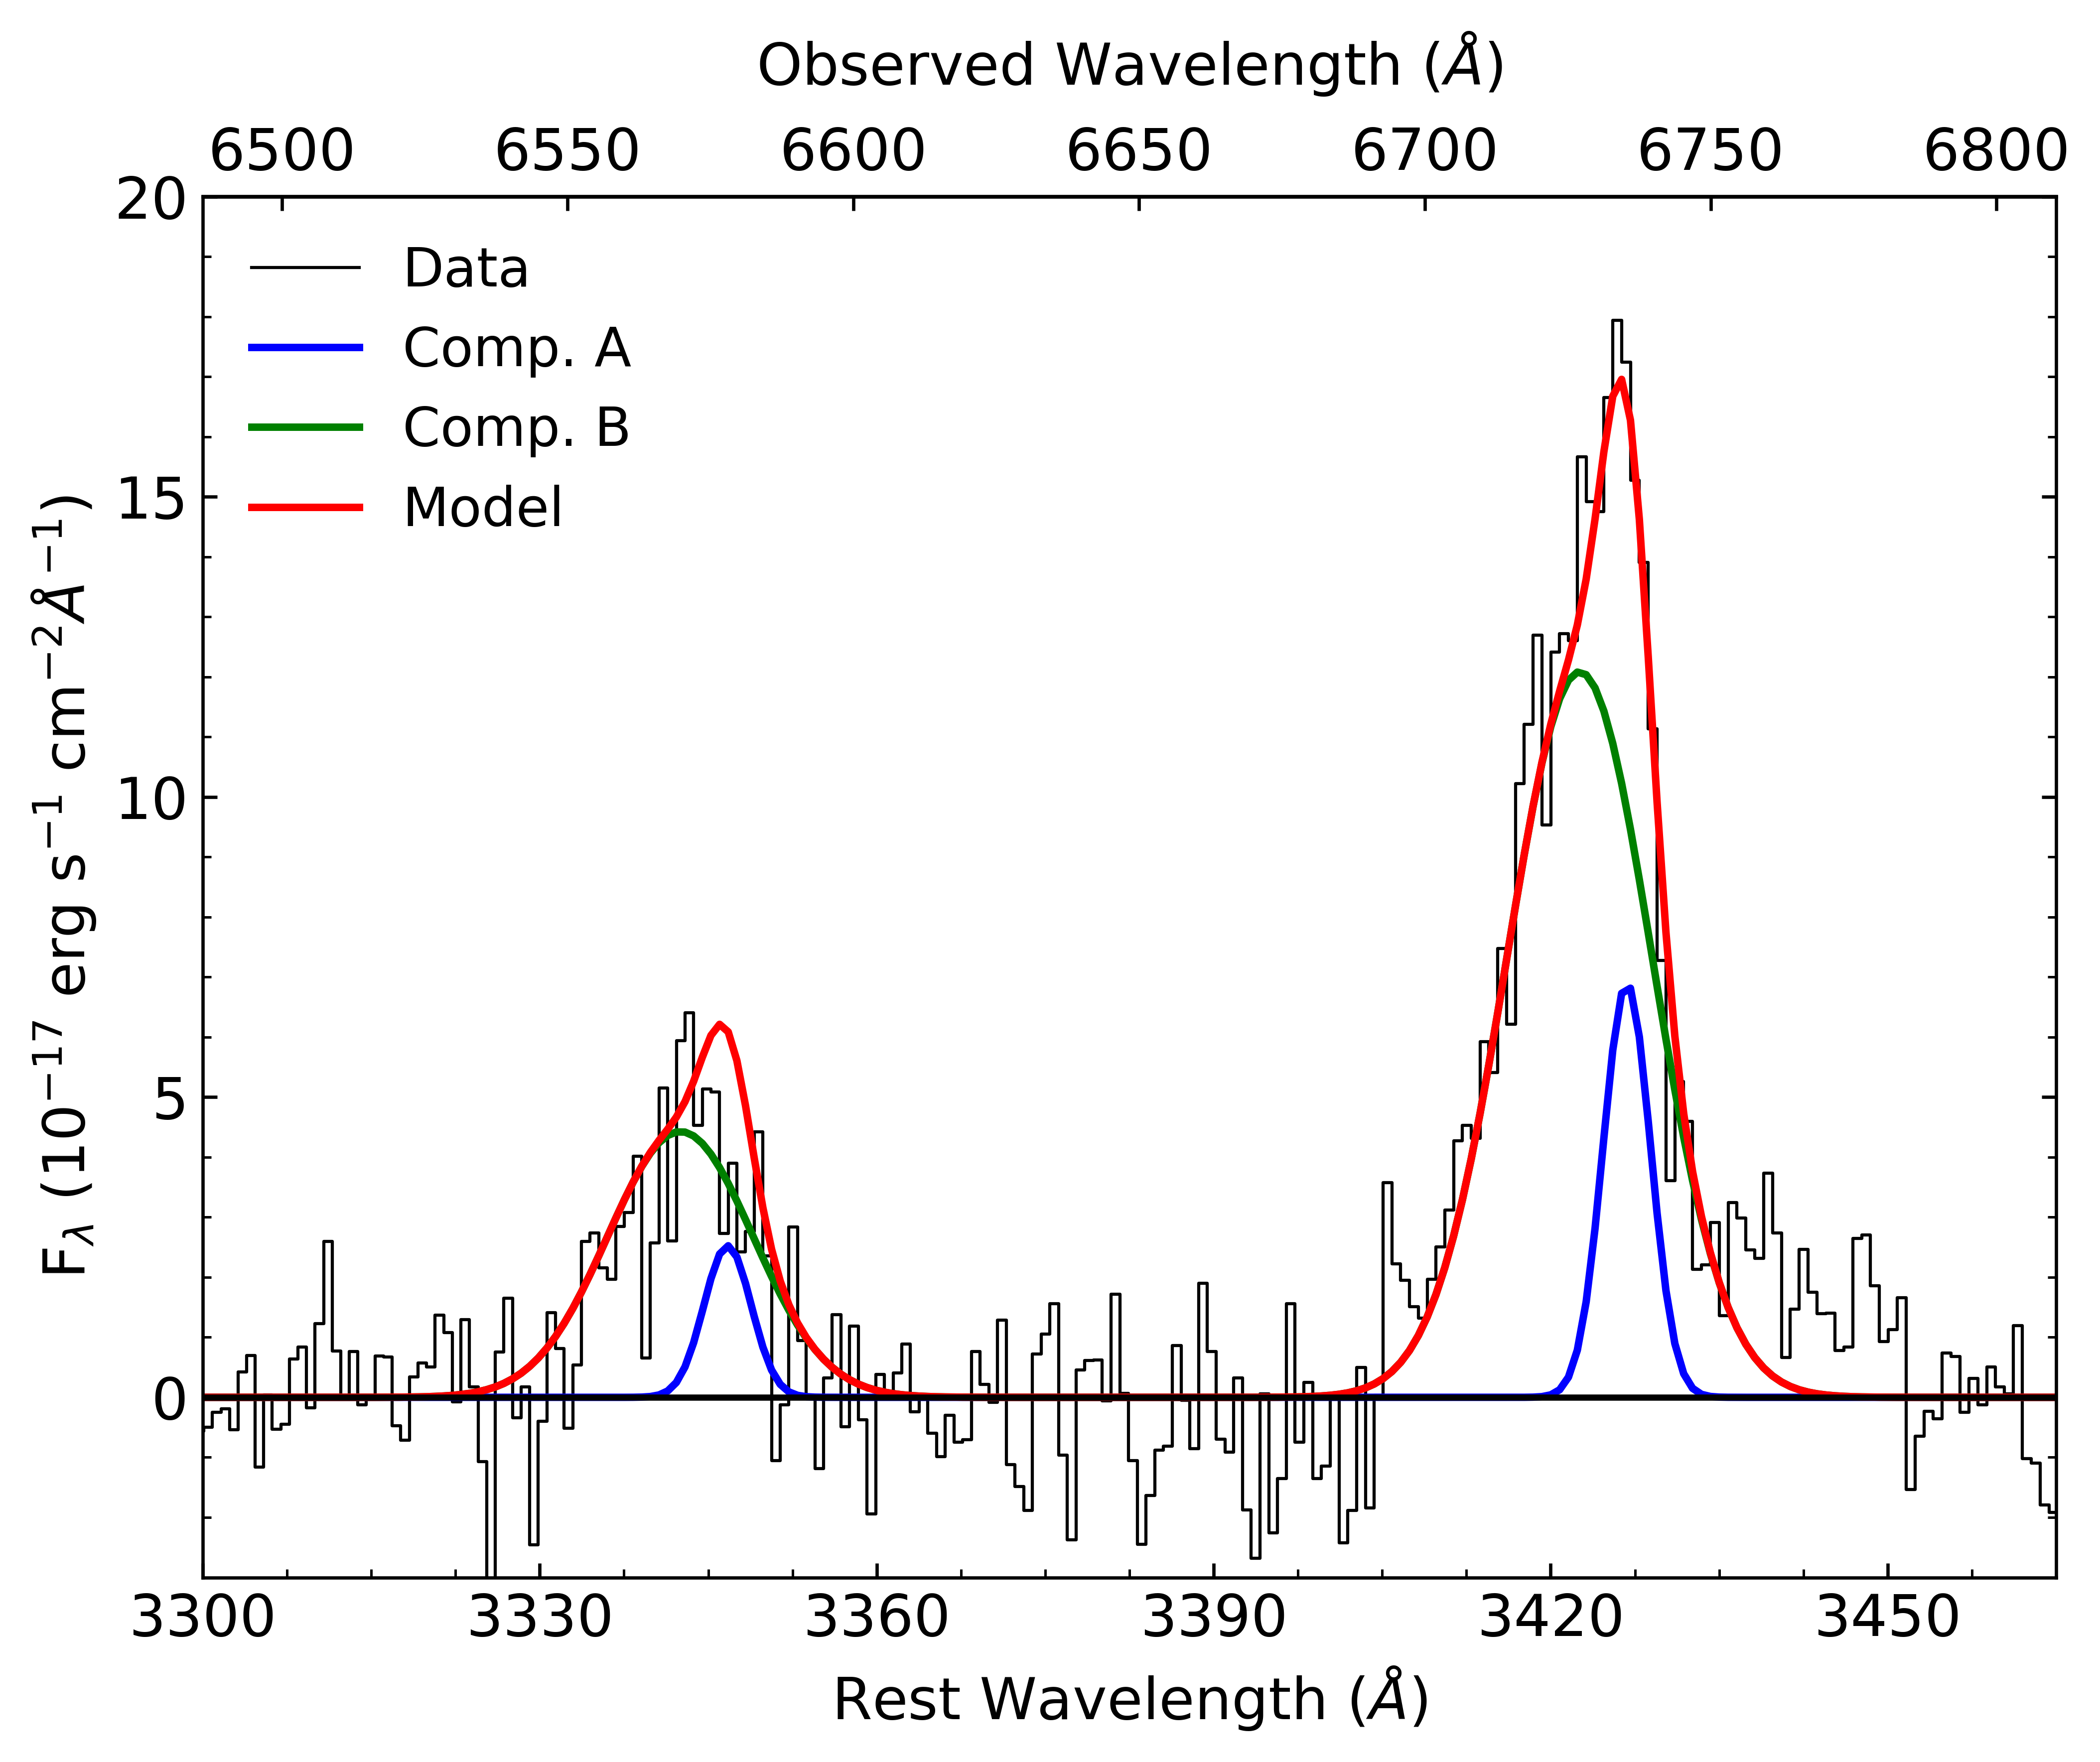
Fig 5: Continuum subtracted SDSS spectrum of the [Ne v] re-
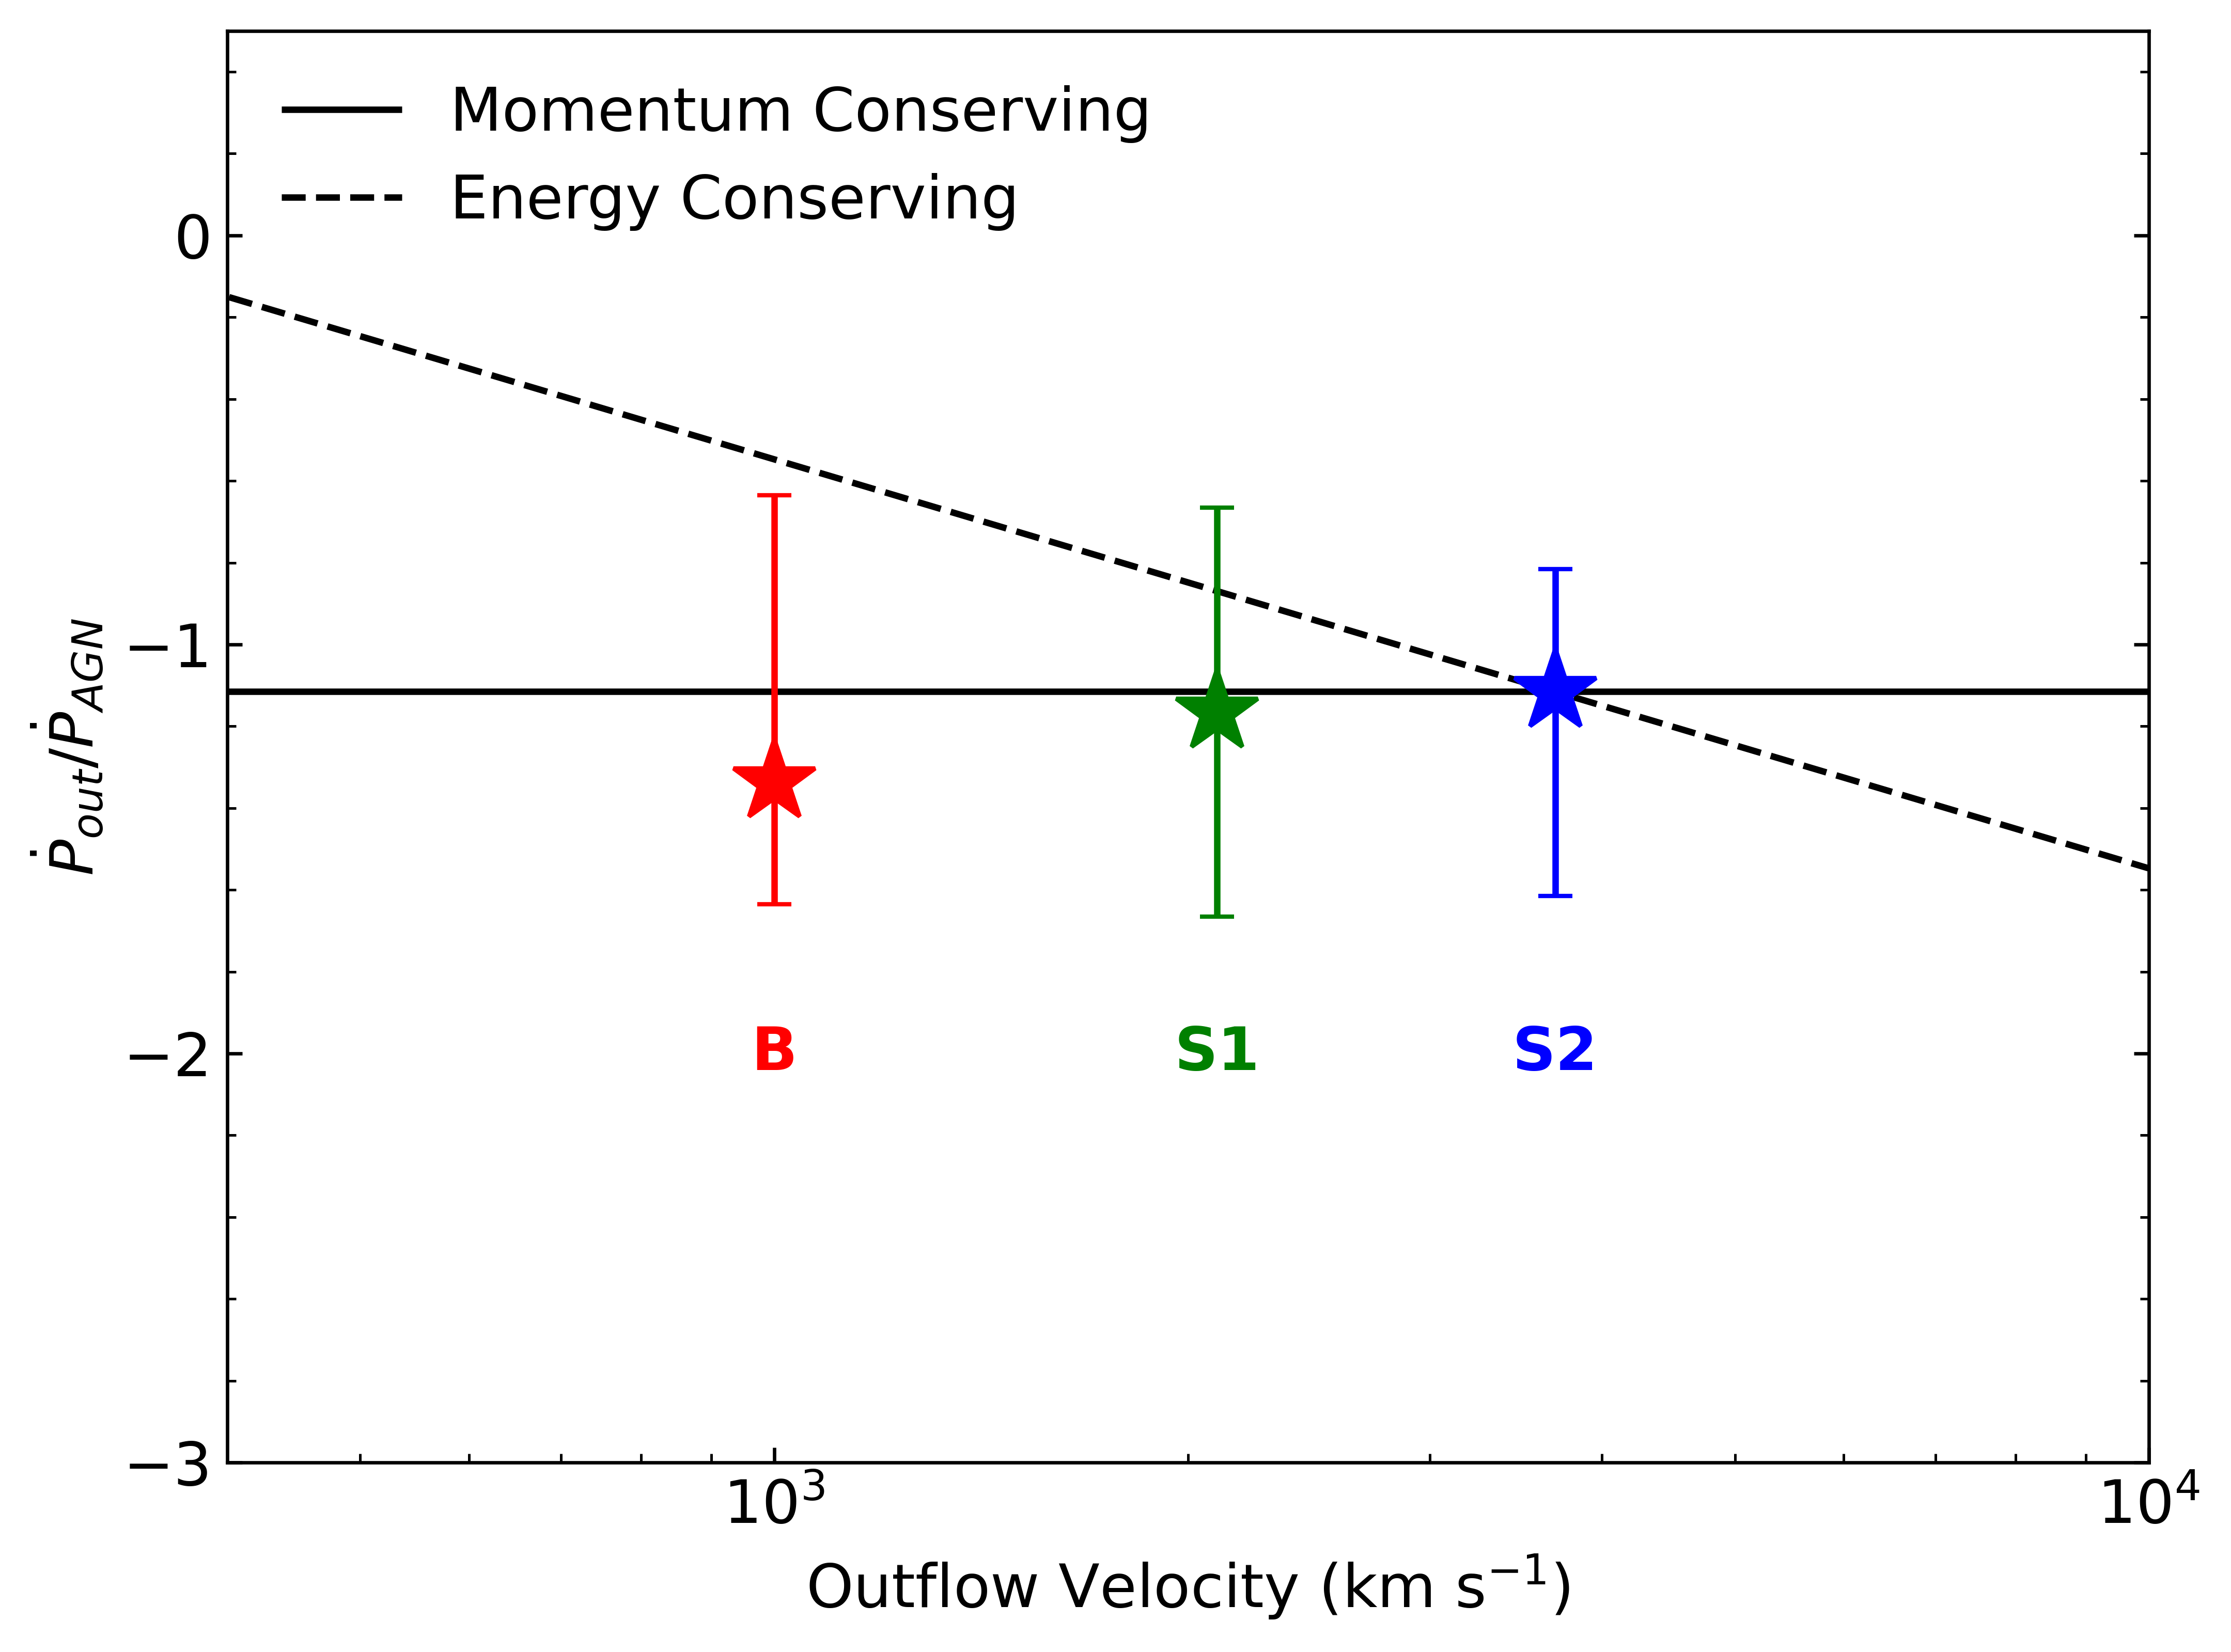
Fig 6: Ratio of the outflow momentum fluxes ( ˙Pout) and the
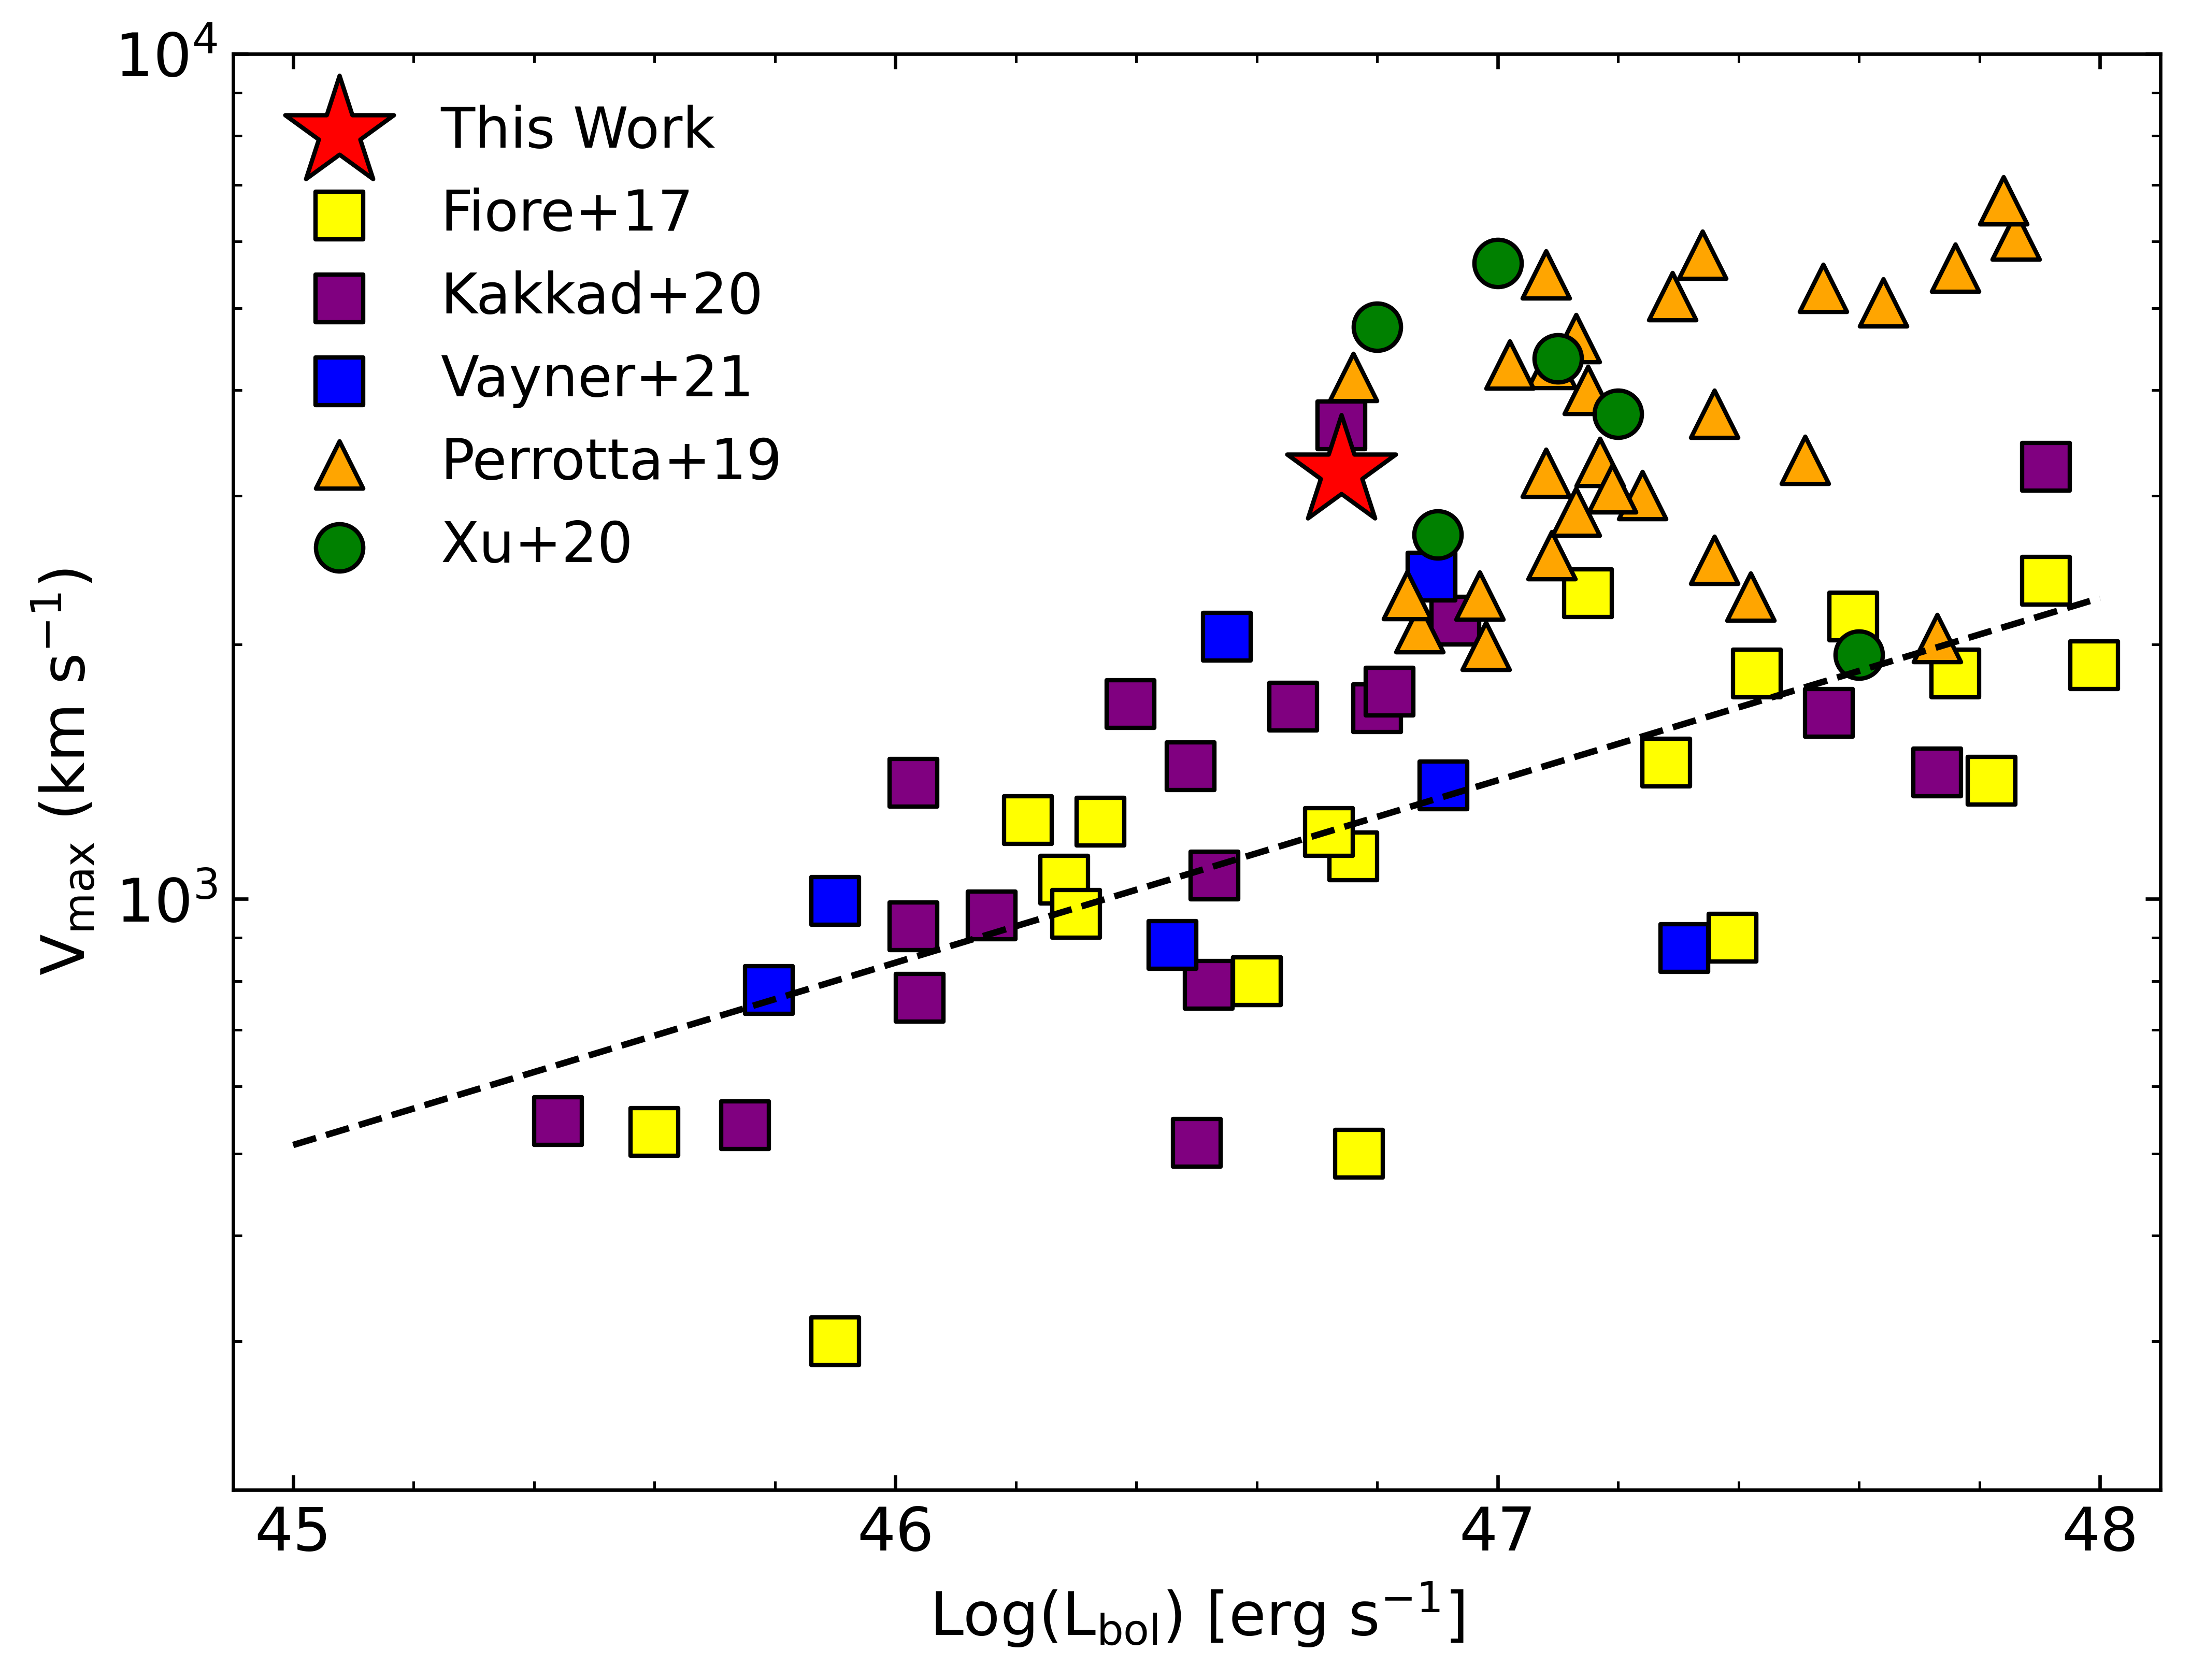
Fig 7: Maximum [O iii] outflow velocity as a function of Lbol.
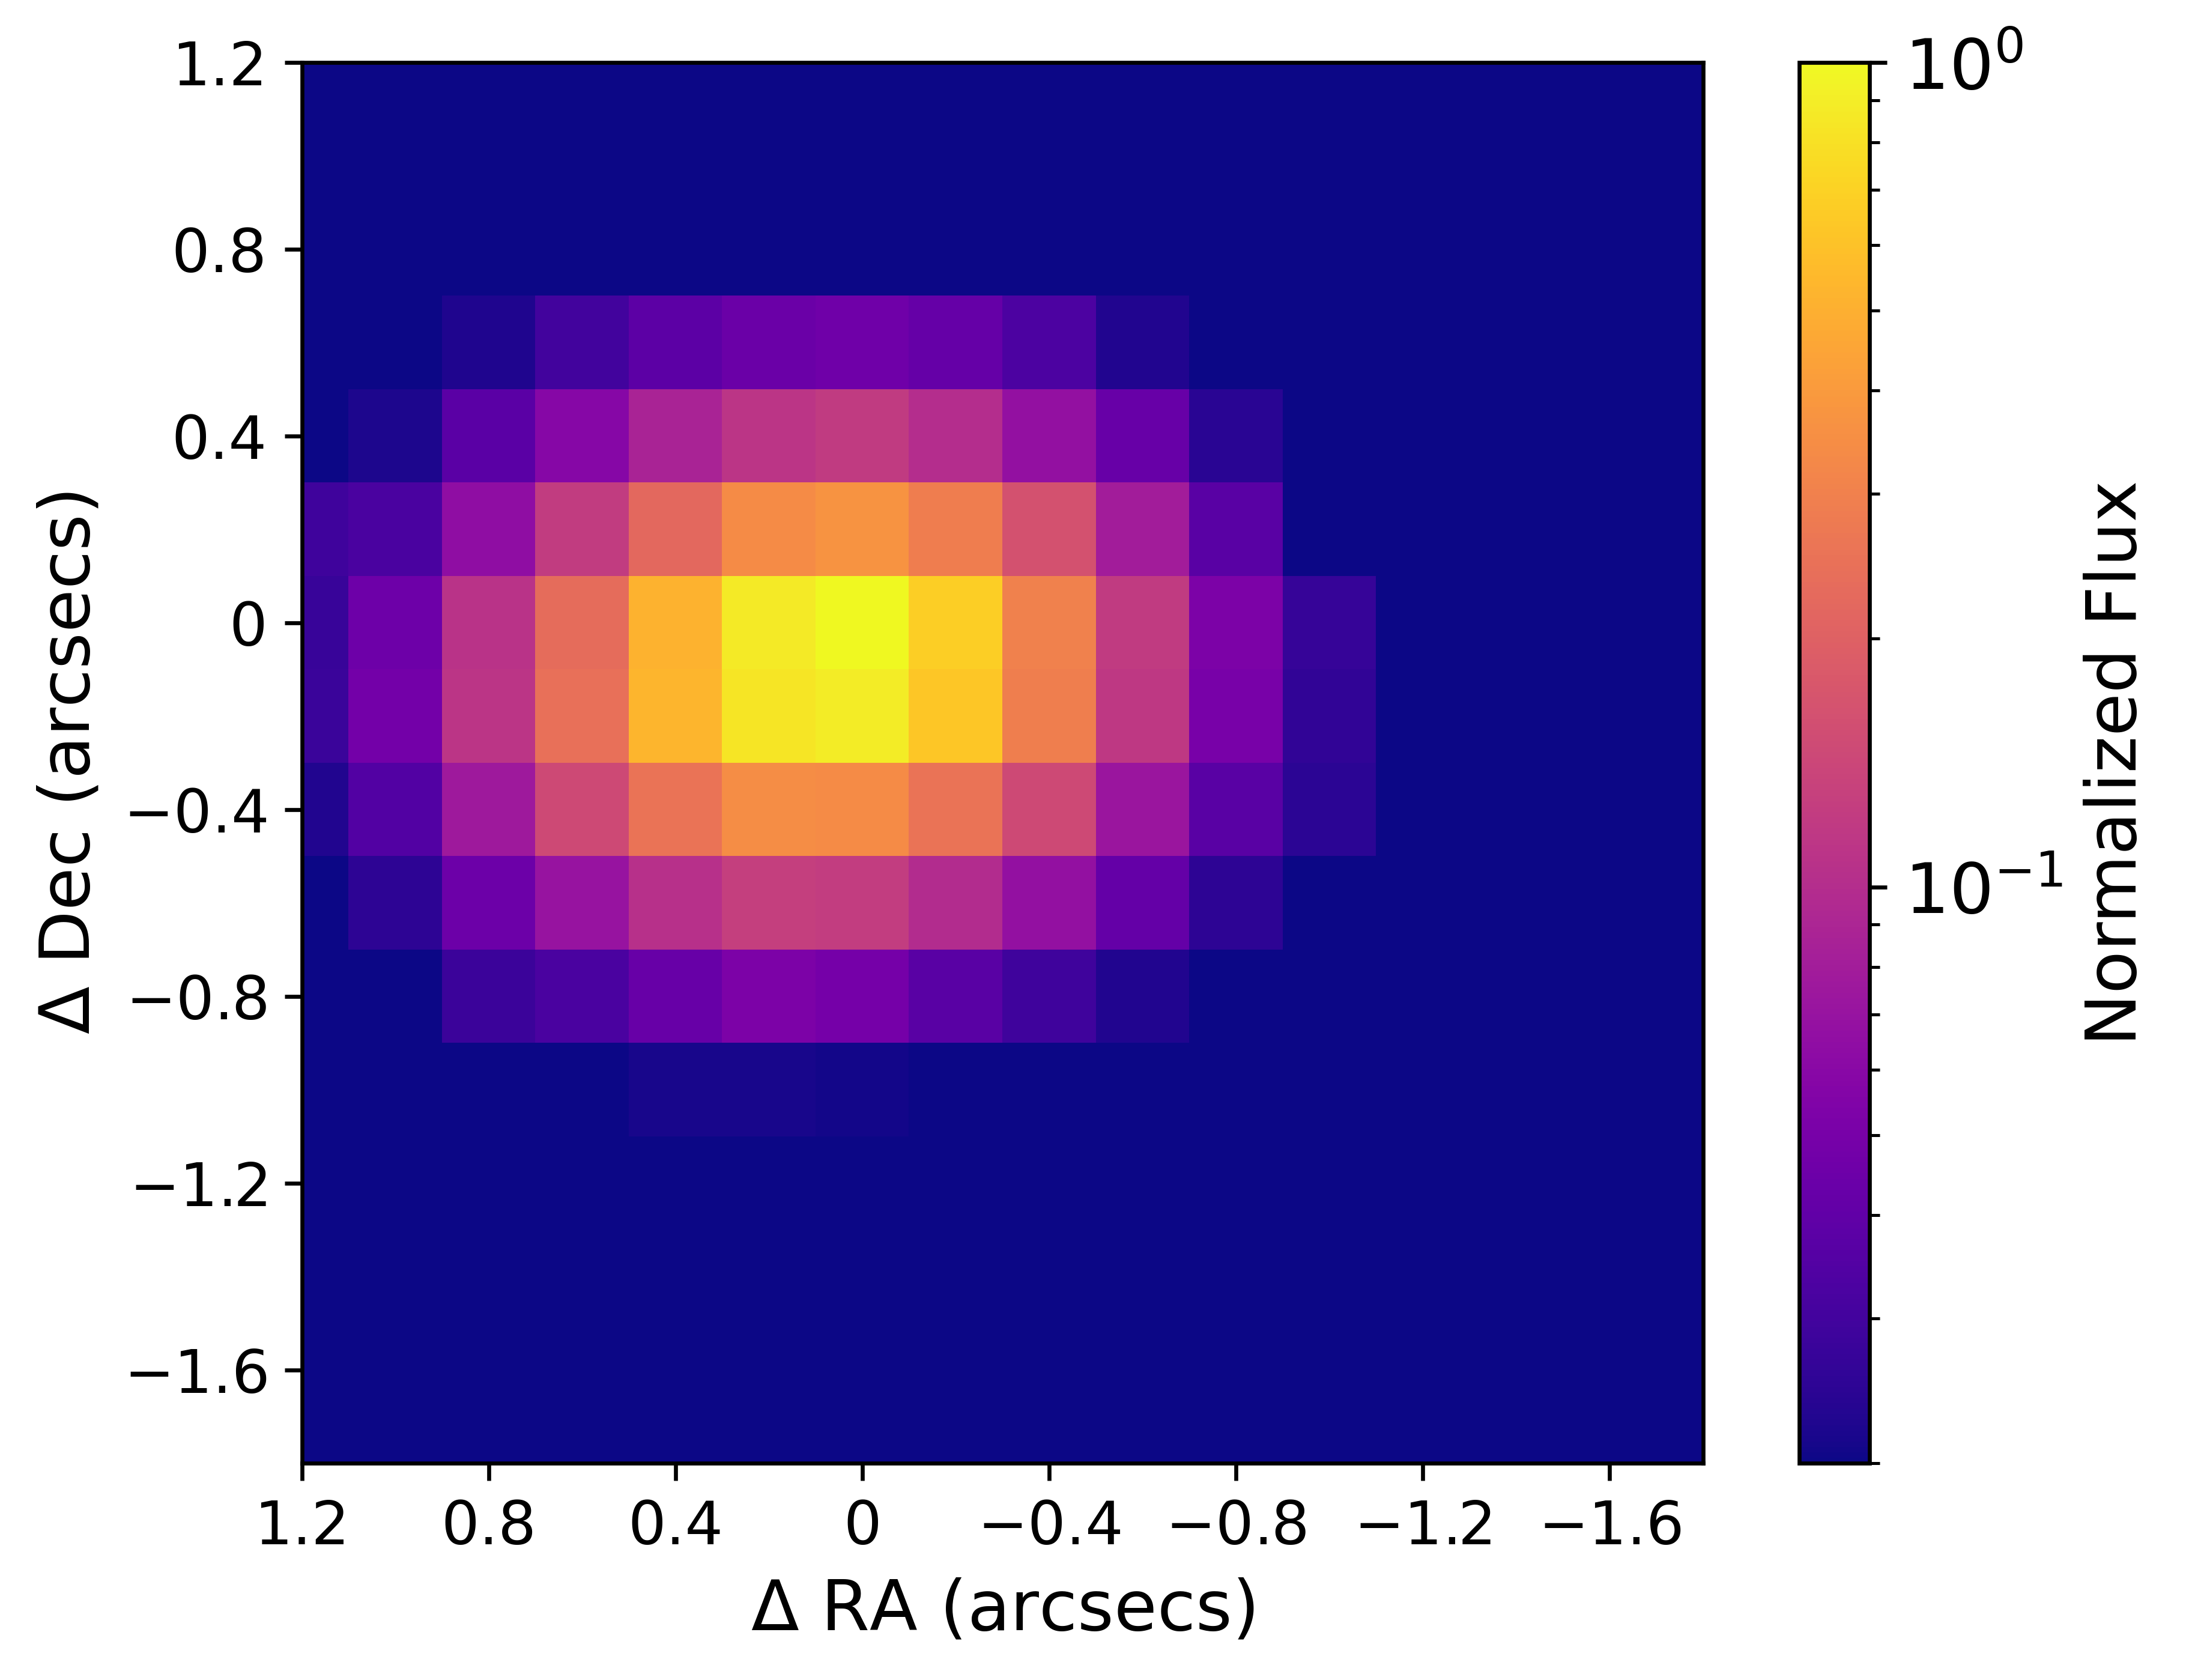
Fig 8: The empirical PSF template for PKS 0352 obtained using the line-free continuum region between 5070-5150 Å. We apply a circular
Limitations
- Electron density (ne) is not directly measured for KMOS emission data, assumed fiducially as 500 cm−3 with wide plausible range 100–1000 cm−3, introducing large uncertainties in mass and energetics.
- Geometric projection effects and unknown inclination of outflow introduce uncertainties in deprojecting line-of-sight velocities to intrinsic outflow speeds.
- Spatial resolution limits the ability to resolve the inner emission component C fully; only upper limits on size (Rmax ~2.4 kpc) are possible.
- The analysis focuses on ionized gas traced by [O III] and [Ne V]; molecular and neutral gas phases are not directly measured, possibly missing substantial outflow mass.
- PSF subtraction to isolate extended emission could be imperfect, potentially contaminating resolved flux measurements, especially close to the nucleus.
- No direct modeling of outflow geometry (conical, biconical, clumpy) is performed due to data limitations.
Open questions / follow-ons
- What is the detailed physical mechanism driving the deceleration and mass loading of the quasar outflow from ~10 pc to several kpc, e.g., interaction with clumpy ISM vs radiative losses?
- How do the molecular and neutral gas phases of the outflow connect spatially and energetically with the ionized phases traced here?
- What are the intrinsic 3D geometries and covering factors of the different outflow components, and how do projection effects bias velocity measurements?
- Do such multi-scale, multi-phase outflows universally represent sustained AGN feedback cycles in luminous quasars, or is PKS 0352 atypical?
Why it matters for bot defense
Although this paper focuses on astrophysical quasar outflows and AGN feedback rather than computer security or bot detection, the multi-scale, multi-phase analysis method offers an analogy for layered detection and tracing of complex threats across scales. Bot defense and CAPTCHA practitioners can appreciate the value of combining disparate observational modalities (here absorption and emission lines) to piece together a coherent temporal and spatial picture of a complex phenomenon evolving across orders of magnitude—a principle useful when designing detection systems that must operate jointly on short-lived low-level signals and larger scale aggregate behaviors. The rigorous statistical decomposition approach (BEAT and Bayesian model selection) also exemplifies how careful modeling and uncertainty quantification improves interpretation of noisy, blended signals, relevant to robust bot detection pipelines. In sum, this work exemplifies careful multi-dimensional data fusion and model-driven interpretation at large scale, principles valuable for advanced CAPTCHA and bot detection research.
Cite
@article{arxiv2606_16967,
  title={ Mapping a Quasar Outflow from Parsec to Kiloparsec Scales: A Combined HST Absorption and VLT Emission Investigation },
  author={ Mayank Sharma and Travis C. Fischer and Manuela Bischetti and Nahum Arav and Fabrizio Fiore and Chiara Feruglio and Manoj Ghosh },
  journal={arXiv preprint arXiv:2606.16967},
  year={ 2026 },
  url={https://arxiv.org/abs/2606.16967}
}