
Time-frequency localization of bird calls in dense soundscapes
Source: arXiv:2606.10407 · Published 2026-06-09 · By Simen Hexeberg, Fanghui Tong, Hari Vishnu, Mandar Chitre
TL;DR
This work addresses the limitation of most bioacoustic classifiers that only predict species presence in broad time windows without precisely localizing bird vocalizations in time and frequency. The authors reformulate bird call detection as an object detection problem on spectrograms and apply YOLOv11 models to identify and localize individual bird calls in dense tropical soundscapes from Singapore. They introduce a new evaluation metric, Intersection over Minimum (IoMin), to better handle ambiguous acoustic event boundaries inherent in bioacoustic data. The best YOLO model nearly doubles the baseline energy-based detector's F1-score on in-distribution data (81.8% vs. 42.1% IoMin@50) and outperforms it on out-of-distribution data from Hawaii (58.6% vs. 48.6%), demonstrating strong localization and generalization capabilities. Additionally, they release an open-source browser-based annotation tool, BirdWatch, designed for efficient bounding box annotation and playback within spectrograms.
Key findings
- The best YOLO model (YOLO11l) achieves 81.8% IoMin@50 F1-score on Singapore (in-distribution) test data versus 42.1% for the baseline TFE detector.
- On out-of-distribution Hawaii data, YOLO11x achieves 58.6% IoMin@50 F1-score compared to 48.6% for the TFE baseline, showing better generalization to unseen soundscapes.
- Using IoMin as an evaluation metric better reflects detection quality in the presence of ambiguous annotation boundaries than standard IoU; in some cases IoU yields 19.1% but IoMin yields 57.6% F1-score on Hawaii data.
- YOLO models suppress false positives from non-bird sounds like insect noise and human speech more effectively than the baseline method (Fig. 1).
- Smaller YOLO models (e.g. YOLO11n with 2.6M parameters) perform within two and a half percentage points of the largest model (YOLO11x) while requiring an order of magnitude fewer computational resources, enabling edge deployment.
- Annotation boundary ambiguity and annotation errors in the Hawaii dataset impact quantitative metrics but qualitative inspection supports strong detection performance.
- Applying standard YOLO augmentations including horizontal and vertical flips improved generalization despite acoustic implausibility.
- Overlapping 6-second spectrogram windows with 1-second overlap and masked edges were used to prevent data leakage.
Threat model
The adversary is the naturally complex and dense acoustic environment containing overlapping bird calls, non-bird sounds (insects, human speech, anthropogenic noise), and ambient noise, which pose detection challenges. There is no active adversary or intentional attack. The model must discriminate bird vocalizations from these confounders and cope with ambiguous annotation boundaries and varying SNR. The adversary cannot alter training data or annotations maliciously.
Methodology — deep read
The threat model assumes passive acoustic recording of dense bird soundscapes, with an adversary that is simply nature/noise variation and labeling ambiguity; no active adversary or data poisoning is considered. The goal is precise localization of bird vocalizations in time-frequency to support downstream ecological analyses.
Data consists of two main labeled datasets. The Singapore dataset (in-distribution) has 4h25m audio from two sites (SBG1, SBG2) with 18,095 bounding box annotations for bird calls, all annotated in a 0.5-12 kHz spectrogram frequency band. Audio was recorded at 44.1 kHz and segmented into 6-second windows with 1-second overlap. Data was split by groups of 10 such windows into train (7), validation (1), and test (2) sets, masking overlap regions to avoid leakage.
The out-of-distribution dataset from Hawaii uses ~51 hours of audio from 4 sites, originally with over 59k annotations over 27 species, simplified here to a single positive "bird" class with 81,691 bounding boxes after cropping, splitting, and deduplicating due to overlapping windows. Sample rate was 32 kHz, with STFT parameters scaled accordingly.
Spectrograms were generated using STFT with parameters chosen so time and frequency dimensions form roughly square images (1024 x 1024). Frequency range was clipped to 0.5-12 kHz. Log-power spectrograms were clipped to 1st-99.8th percentile and gamma corrected (γ=0.85). To fit YOLO’s three channel input, the spectrogram was converted to RGB using the magma colormap.
YOLOv11 models (nano, small, medium, large, extra-large) pretrained on COCO images were fine-tuned on the Singapore training set for up to 300 epochs with batch size 16, early stopping with 50-epoch patience, using default learning rate 0.01 and weight decay 5e-4. Five seeds were used for each model. Training used standard YOLO augmentations including flips despite their acoustic unnaturalness, based on preliminary experiments.
Evaluation used standard detection metrics adapted to acoustic signals. An important innovation was the Intersection over Minimum (IoMin) metric defined as the intersection area over the minimum of predicted and ground truth bounding box areas, better capturing partial but correct vocalization hits than traditional IoU, which penalizes under-detection. Duplicate true positives for the same ground truth were ignored (not counted as false positives). Metrics reported include mean average precision (mAP) at 50% IoMin and IoU thresholds, and maximum F1-score along precision-recall curves.
The baseline method was an unsupervised energy-based Time-Frequency Event (TFE) detector that normalizes spectrogram bins and performs watershed segmentation plus heuristic filtering to find candidate events without labeled training.
Quantitative results are reported on both Singapore (ID) and Hawaii (OOD) test sets. Qualitative analysis includes examples of annotation issues and noise sources. Model behavior and failure modes are illustrated through spectrogram bounding box visualizations.
The annotation tool BirdWatch was developed as an open-source browser-based interface allowing bounding box drawing, listening to time-frequency cropped audio via boxes, editing annotations, and evaluating model performance visually by overlaying TPs/FPs/FNs. It exports annotations in YOLO format. Code and tool are publicly available.
An example end-to-end workflow: An audio recording is segmented into overlapping 6s windows, converted to RGB spectrogram images, input to the YOLO model, which predicts bounding boxes for bird calls in time-frequency. The bounding boxes are evaluated against manual labels using IoMin metric, and false positives and negatives are visualized in BirdWatch for quality control and model tuning. This pipeline enables precise localization of thousands of vocalizations in dense tropical acoustic environments.
Technical innovations
- Reformulating bird vocalization detection as an object detection task on spectrogram images using YOLOv11 models.
- Introducing Intersection over Minimum (IoMin) as a novel evaluation metric tailored to the ambiguous boundaries of acoustic vocalization annotations, improving true positive identification versus standard IoU.
- Developing BirdWatch, an open-source browser-based annotation tool integrating time-frequency constrained audio playback with bounding box annotation and visualization compatible with YOLO workflows.
- Demonstrating effective application of standard YOLO augmentations (including reflections) in spectrogram domain to improve model generalization despite acoustic implausibility.
Datasets
- Singapore dataset — 18,095 bounding boxes over 4h25m audio — recordings from two sites in Singapore Botanic Gardens, 44.1 kHz sampling rate, annotated with bounding boxes for bird calls.
- Hawaii dataset — 81,691 bounding boxes over ~51 hours audio — recordings from four sites in Hawaii, 32 kHz sampling rate, public BirdSet benchmark dataset, used here for out-of-distribution evaluation.
Baselines vs proposed
- TFE detector baseline (nonlearnable energy-based): Singapore F1 IoMin@50 = 42.1% vs YOLO11l 81.8%
- TFE detector baseline: Hawaii F1 IoMin@50 = 48.6% vs YOLO11x 58.6%
- YOLO11n (smallest model): Singapore F1 IoMin@50 = 81.7% vs YOLO11l 81.8% (close performance with much fewer parameters: 2.6M vs 25.2M)
- YOLO11l: Singapore F1 IoU@50 = 66.5%, Hawaii F1 IoU@50 = 19.1%
- YOLO11l: Singapore F1 IoMin@50 = 81.8%, Hawaii F1 IoMin@50 = 57.6%
Figures from the paper
Figures are reproduced from the source paper for academic discussion. Original copyright: the paper authors. See arXiv:2606.10407.
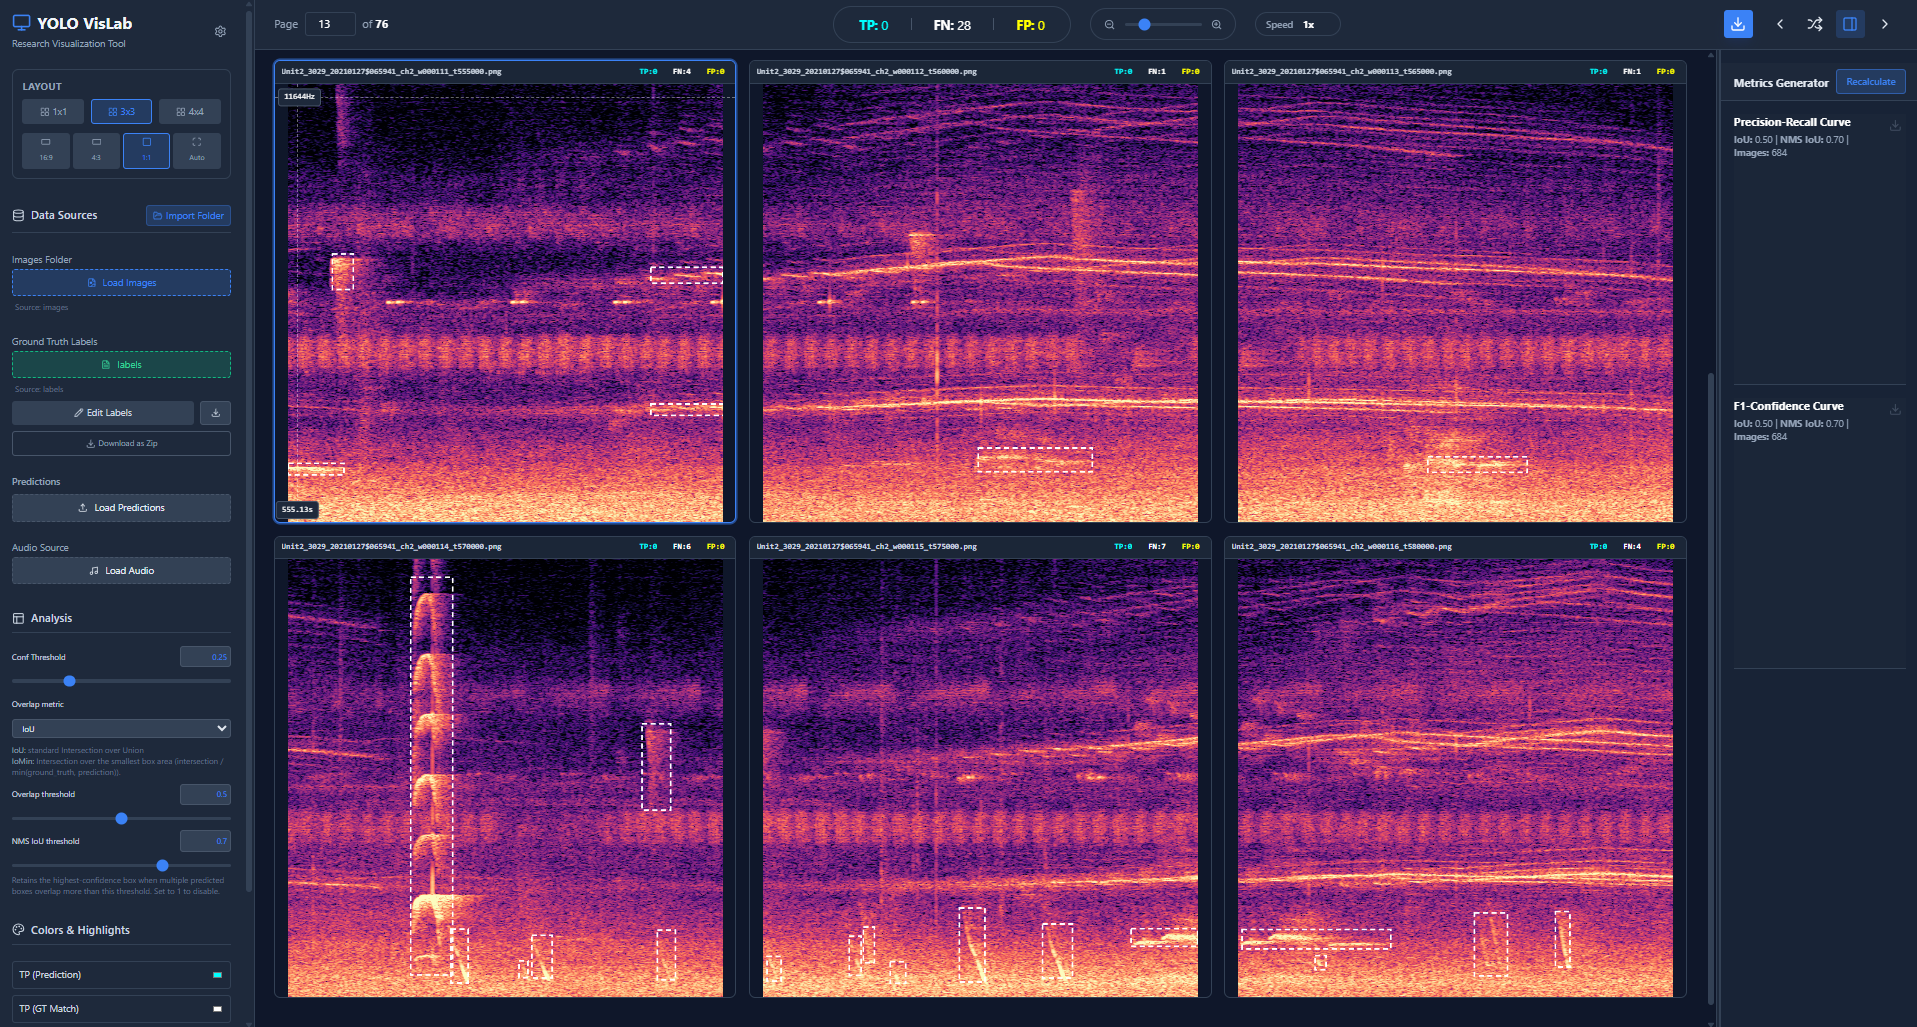
Fig 1: Two common failure modes of the TFE detector on a test set recording from Singapore (left), and the corresponding
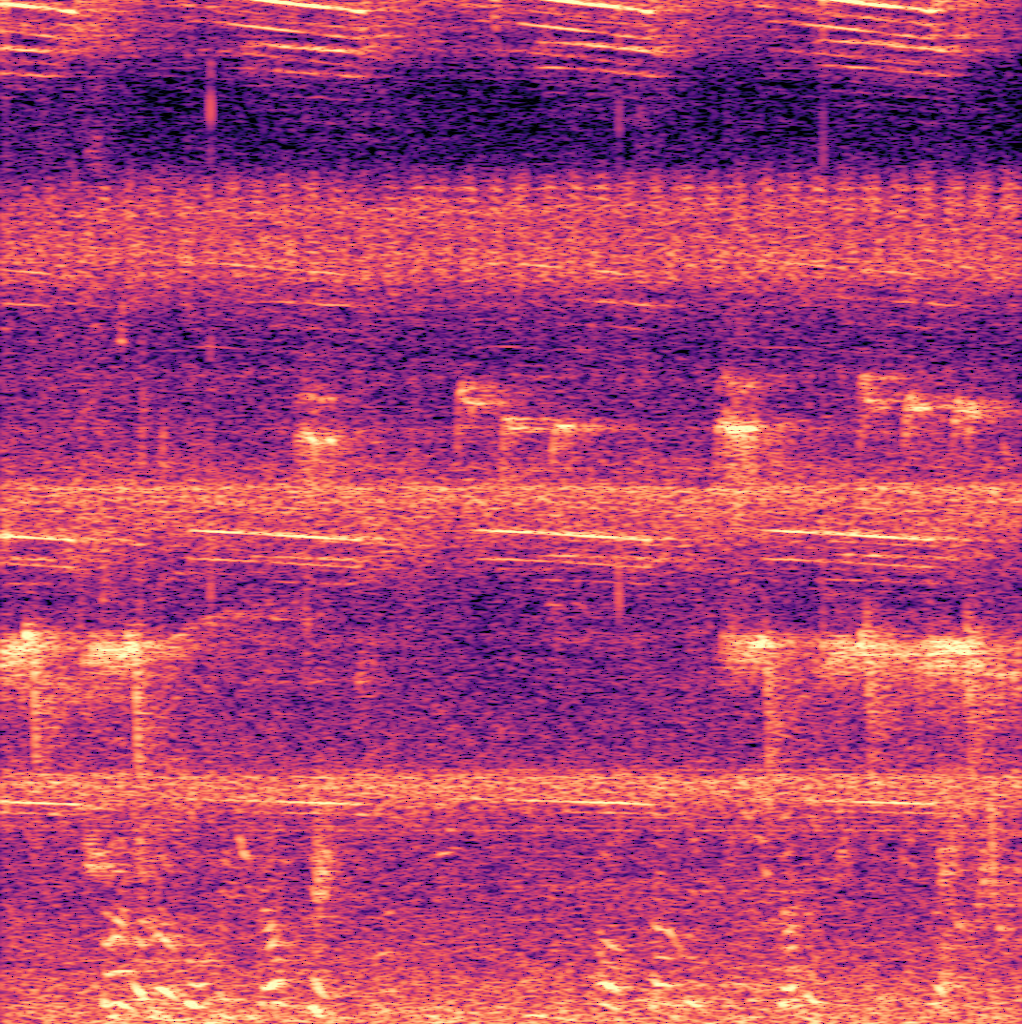
Fig 2: Interface of the open-source annotation tool BirdWatch

Fig 3: The two recording locations in the Singapore Botanic
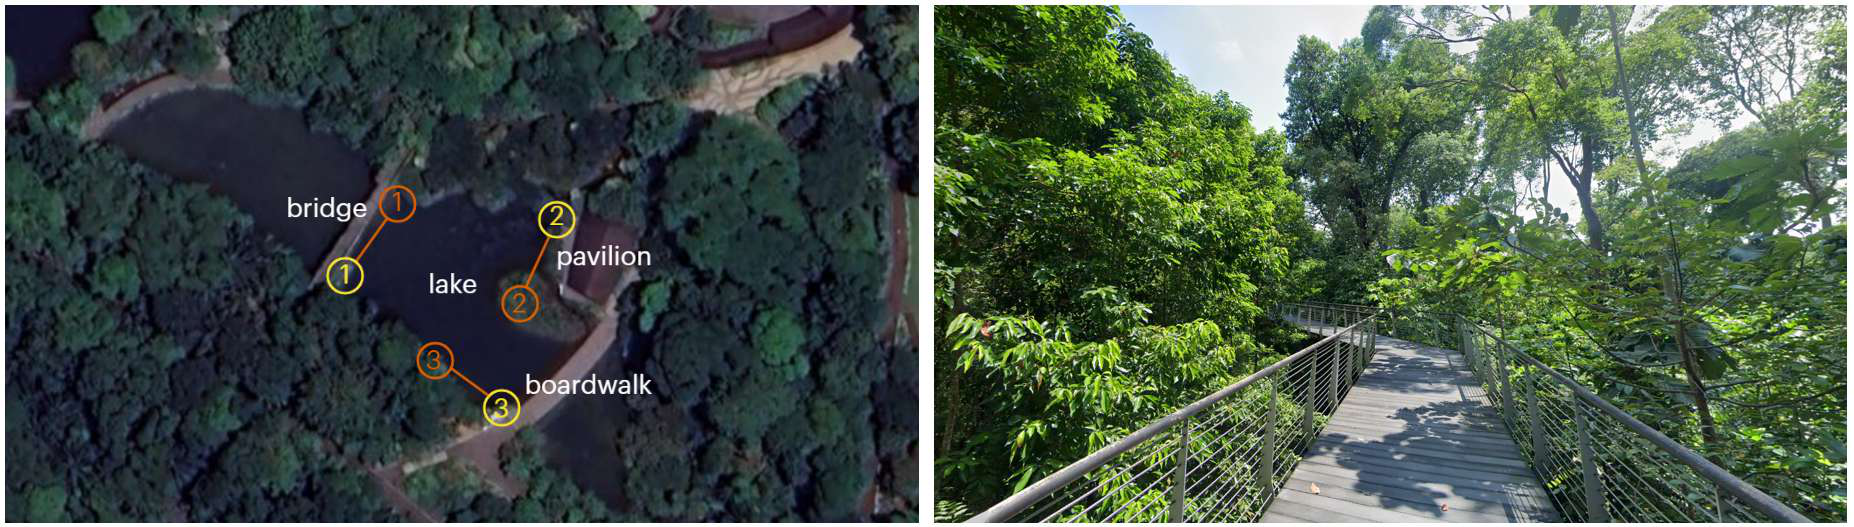
Fig 4: Illustration of the data split strategy for the Singapore dataset. Recordings are converted to 6-second spectrograms
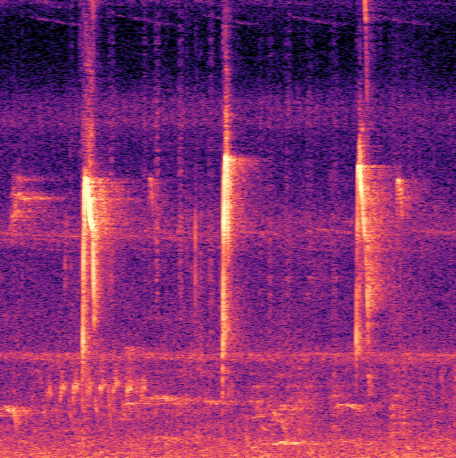
Fig 5: Example illustrating where the standard definition of
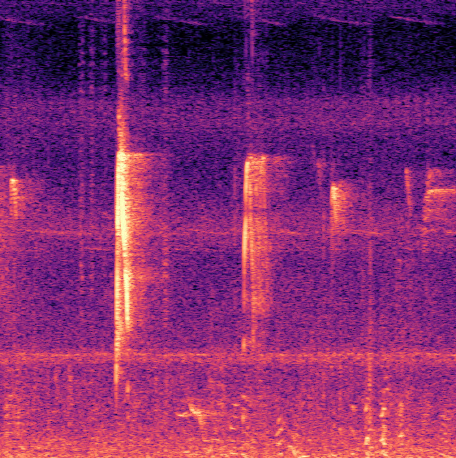
Fig 6: Precision-recall curves. YOLO models show significant
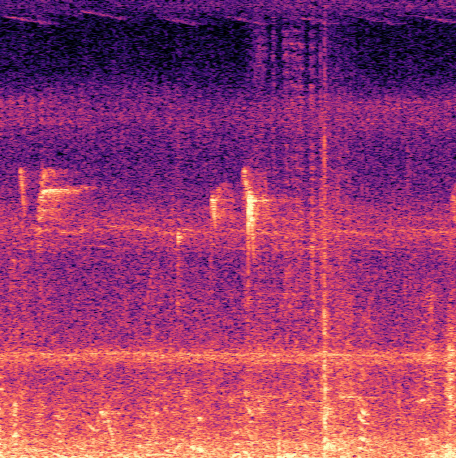
Fig 7: Examples from the Hawaii dataset illustrating how annotation discrepancies affect performance metrics.
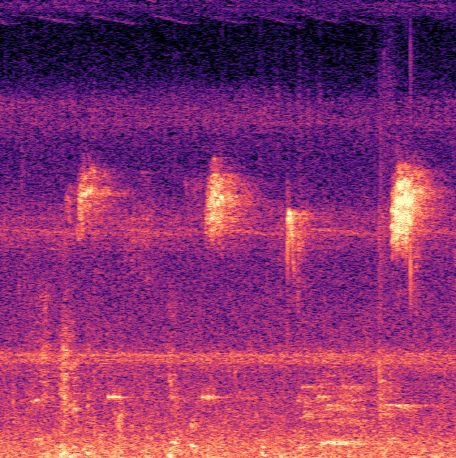
Fig 8: F1 scores using IoMin > 0.5 for different YOLO
Limitations
- Training data is geographically and ecologically narrow (two Singapore sites), limiting generalization as seen in out-of-distribution performance drop on Hawaii data.
- Annotation ambiguity and errors affect quantitative evaluation; annotation boundaries are subjective and incomplete annotations exist.
- The evaluation metric IoMin does not penalize over- or under-extended predictions, providing an upper bound but potentially inflating scores.
- Standard YOLO augmentations include spectrogram flips with no physical acoustic sense, potentially limiting model interpretability.
- No adversarial robustness evaluation or testing under extreme noise or overlapping calls beyond natural variability.
- The study focuses solely on binary bird/non-bird detection without species classification.
Open questions / follow-ons
- How can training on large, diverse open-source datasets (e.g., Hawaii + Singapore, other BirdSet subsets) improve generalization to new geographic regions?
- What time-frequency representations beyond log-STFT (e.g., mel-scale, wavelets, PCEN) best support fine-grained detection and localization of vocalizations using object detection models?
- Can multi-class detection models be built to simultaneously localize and classify multiple bird species in dense soundscapes?
- How might semi-supervised or synthetic data augmentation approaches using isolated vocalizations improve model robustness and reduce manual annotation effort?
Why it matters for bot defense
For bot-defense engineers considering audio-based human verification, this work presents a novel application of object detection methods to precisely localize and identify short acoustic events amidst dense and noisy backgrounds. The methodological innovations—treating acoustic event detection as an image object detection problem on spectrograms, along with a new evaluation metric (IoMin) tailored to boundary ambiguity—reflect challenges similar to distinguishing legitimate human interactions from noise or attacks in highly overlapping, transient signal domains. While focused on bioacoustics, the approach of converting 1D temporal signals to 2D representations for localized detection could inform design of audio CAPTCHA systems that must isolate and verify distinct sound tokens in complex soundscapes. The model size and inference cost trade-offs are also relevant when deploying real-time detection on low-resource edge devices common in bot defense scenarios. Finally, the open-source annotation tool could aid in creating labeled datasets for audio CAPTCHAs or human verification systems that require bounding box-level precision.
Cite
@article{arxiv2606_10407,
  title={ Time-frequency localization of bird calls in dense soundscapes },
  author={ Simen Hexeberg and Fanghui Tong and Hari Vishnu and Mandar Chitre },
  journal={arXiv preprint arXiv:2606.10407},
  year={ 2026 },
  url={https://arxiv.org/abs/2606.10407}
}