
Waiting at the front door: Continuous monitoring of latency in the host network stack
Source: arXiv:2606.02057 · Published 2026-06-01 · By Simon Sundberg, Anna Brunstrom, Simone Ferlin-Reiter, Jesper Dangaard Brouer, Toke Høiland-Jørgensen
TL;DR
This paper addresses the challenge of continuously monitoring latency within the host network stack as modern networks approach sub-millisecond latencies. While prior work primarily measures end-to-end latency or uses heavy-weight or sampling-based approaches, there has been a lack of tools that enable low-overhead, always-on observation of latency buildup within the Linux host kernel network stack. The authors present netstacklat, a novel, software-only monitoring tool leveraging Linux’s SKB timestamping and eBPF tracing to measure cumulative latency at multiple ingress points from early IP processing through to application socket reads. They demonstrate that netstacklat can capture detailed latency distributions at 4 probe points under 144 distinct HTTP workload scenarios involving Nginx and Apache, with only a 0.81% average CPU overhead and a 6% inflation to tail latency—orders of magnitude lower overhead and latency impact than previous tools that can increase latency by over 100%. Finally, they share initial real-world deployment insights from Cloudflare’s global CDN, illustrating netstacklat’s ability to detect rising host latency under increasing load and anomalous latency events over extended periods.
Key findings
- Netstacklat aggregates latency at 4 kernel stack probe points: ip-start, tcp/udp-start, socket-enqueued, and socket-read.
- In a testbed with Mellanox ConnectX-5 100GbE NICs, netstacklat adds approximately 225 nanoseconds of overhead per probe per SKB.
- Across 144 HTTP workloads (Nginx/Apache, server/reverse proxy, 1kB-1MB files, 9 concurrency levels), netstacklat uses 0.81% CPU on average on the Device under Test.
- Netstacklat inflated tail latency by only 6% compared to over 100% latency inflation from prior kernel tracing tools under heavy load.
- Netstacklat’s histogram aggregation approach enables continuous monitoring with fixed memory, avoiding per-packet data blowup.
- Filtering TCP head-of-line blocking delay excludes latency caused by out-of-order packet arrival, isolating host stack latency.
- Deployment at Cloudflare revealed host network latency increases correlated with server load and identified a 3-hour anomalous latency increase event.
- Latency distributions show very wide ranges with tail latency often varying by orders of magnitude across workloads (Figure 3).
Threat model
n/a - The paper does not present an explicit adversary model; rather, it assumes the role of an operator monitoring latency in a production host environment without malicious interference. The tool focuses on visibility rather than security against attackers.
Methodology — deep read
Threat model & assumptions: The work assumes a production server environment where continuous monitoring of the Linux kernel ingress network stack latency is needed, focusing on latency introduced locally in the host, excluding network-induced delays such as TCP head-of-line blocking. There is no direct adversary model, but the method targets visibility for operators to detect latency issues.
Data: The authors constructed a comprehensive testbed with a Device under Test (DuT) running either Nginx or Apache (normal and reverse proxy modes) serving files of sizes 1kB, 10kB, 100kB, and 1MB. Load was generated using the HTTP load generator 'oha' at 9 different concurrency levels (1 to 4000 connections), resulting in 144 workload combinations. Each test ran for 60 seconds and was repeated 9 times. Hardware included Intel Xeon CPUs (6-core and 10-core machines) and Mellanox 100GbE NICs. Linux kernel 6.8 was used.
Architecture / algorithm: Netstacklat leverages Linux kernel's SO_TIMESTAMPING_RX_SOFTWARE feature to attach an arrival timestamp to each packet’s SKB structure near the start of kernel receive processing. Using eBPF tracing programs attached with fentry/fexit at specific kernel functions in the ingress network stack, it observes each SKB at 4 key layers: ip-start, tcp/udp-start, socket-enqueued, and socket-read. At each probe, the latency is computed in-kernel as the difference between the current time and the SKB's arrival timestamp (no need to store past state per SKB). Latencies are aggregated into fixed-size exponential histograms directly inside the kernel to minimize overhead and limit data volume. To avoid misleading inflations from TCP head-of-line blocking (out-of-order segments held by the stack before reordering), netstacklat uses the socket’s out-of-order packet counters to exclude affected latency samples at socket-read.
Training regime: N/A (not a machine learning method).
Evaluation protocol: The tool was evaluated by measuring latency distributions at each probe point under the 144 workloads with 9 repeated runs each. Overhead was measured as additional CPU utilization on the DuT and the inflation in tail latency compared to no monitoring and vs other tools (lattrace, kaynos, pwru, retis). Latency distributions were plotted on a logit scale to illustrate tail effects. They also deployed netstacklat in production at Cloudflare to observe latency trends and detect anomalous events over time. Publicly released datasets, configuration files, and scripts are available for reproducibility.
Reproducibility: The netstacklat source code is publicly available on GitHub along with measurement datasets and experiment scripts. The testbed is configured with detailed software versions and workload instructions. The paper notes differences with prior kernel tracing methods and kernel modification requirements. Overall, netstacklat requires Linux kernel 6.2+ with eBPF and SO_TIMESTAMPING_RX_SOFTWARE enabled, and no kernel patching.
One concrete example: When a TCP packet arrives at the NIC, the kernel timestamps the SKB early (ip-start). As it traverses the IP and TCP layers, and eventually is enqueued to the socket buffer (socket-enqueued), netstacklat probes capture the cumulative latency at each stage by measuring now minus the original SKB timestamp. When the application calls read(), the socket-read probe captures latency including scheduling delays before delivery to user space, excluding samples where out-of-order TCP segments may cause inflated delays. Latency values are accumulated in per-CPU histograms aggregated periodically for monitoring outputs. This allows operators to pinpoint if latency build-up occurs early in IP processing, TCP handling, within the socket queues, or in application scheduling.
Technical innovations
- Leveraging the Linux kernel’s existing SKB software receive timestamp (SOF_TIMESTAMPING_RX_SOFTWARE) combined with eBPF fentry/fexit probes to compute cumulative latency in-kernel without per-packet external state.
- In-kernel aggregation of latency measurements into fixed-size exponential histograms per CPU core enabling continuous monitoring with limited overhead.
- Introduction of a filtering mechanism that excludes latency samples potentially inflated by TCP head-of-line blocking using per-socket out-of-order packet counters.
- Selecting four stable, logical, cumulative network stack probe points enabling detailed breakdown of latency buildup from IP layer through to application socket read.
Datasets
- HTTP Workload Dataset — 144 workload combinations (Nginx/Apache normal & proxy, 1kB-1MB files, 9 concurrency levels) — collected in-house testbed
- Cloudflare Production Deployment Data — Real-world latency traces from global CDN servers — internal production data (partial insights shared)
Baselines vs proposed
- No monitoring baseline: tail latency inflation = 0%
- Netstacklat: tail latency inflation under heavy load = 6%
- Lattrace: tail latency inflation under heavy load > 100%
- Kaynos, pwru, retis: monitoring overheads significantly higher than netstacklat (exact numbers in Section 6, evaluation)
- CPU utilization on DuT: netstacklat averages 0.81% across all workloads
Figures from the paper
Figures are reproduced from the source paper for academic discussion. Original copyright: the paper authors. See arXiv:2606.02057.
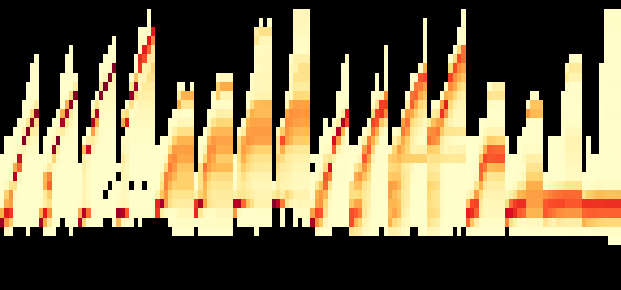
Fig 4: Latency (y-axis) for each of the 144 workload combi-

Fig 5: Kendall correlation between end-to-end (e2e) la-

Fig 12: The latency distribution for each of the 144 work-
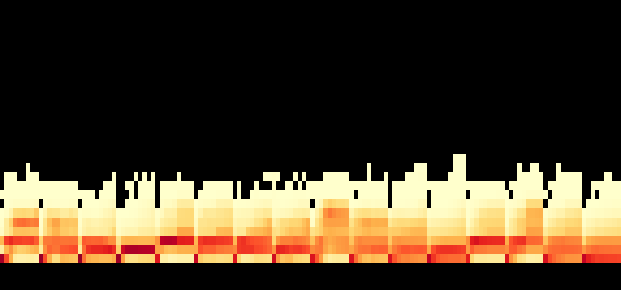
Fig 13: Per-interface tcp-socket-read latency for each of
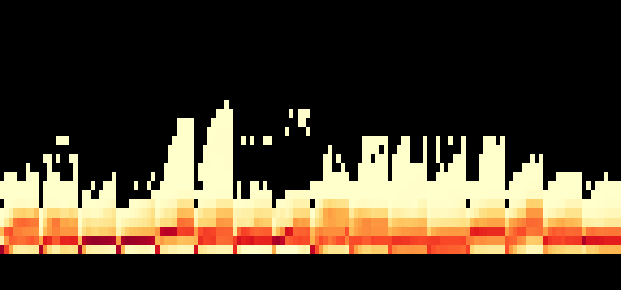
Fig 14: End-to-end latency reported by the load generator

Fig 15: shows the average RPS achieved for the different work-
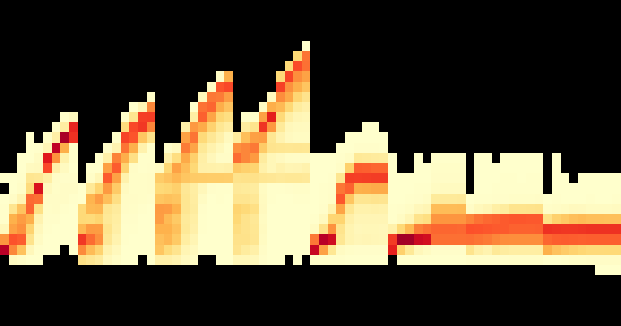
Fig 16: shows how the average CPU utilization on the DuT varies

Fig 17: Average received packet rate at the DuT for each
Limitations
- Netstacklat excludes TCP head-of-line blocking to isolate host stack latency, which may omit relevant delays in some contexts.
- Aggregation into exponential histograms introduces up to ±33.3% relative error in quantile latency estimates due to bin granularity.
- Evaluation does not cover adversarial or attack workloads, focusing on benign HTTP server scenarios.
- Workloads used standard unoptimized Nginx/Apache defaults rather than tuning configurations for latency.
- Current probe points focus on ingress stack only; egress path latency is not measured.
- Results rely on Linux kernel 6.8+ features; applicability on older kernels is limited.
Open questions / follow-ons
- How to extend the approach to accurately monitor latency on the egress network stack path?
- Could fine-grained adaptive histogram binning or alternative data structures improve latency quantile accuracy while maintaining low overhead?
- What is the impact of netstacklat on latency and overhead under adversarial or malformed traffic patterns?
- Can the tool be integrated with application-level tracing frameworks to correlate host stack latency with wider distributed system latencies?
Why it matters for bot defense
For bot-defense engineers and CAPTCHA infrastructure practitioners, understanding host network stack latency and its variability is critical for diagnosing sources of request processing delays that can affect user experience and detection accuracy. Netstacklat’s approach enables continuous, low-overhead monitoring of inbound packet processing latency inside the host, helping teams pinpoint whether latency bottlenecks arise from kernel processing, TCP/IP stack delays, or application scheduling. This insight can guide optimizations in server configuration, kernel tuning, or application code to reduce unpredictable latency that might otherwise blur noise/bot signatures. Furthermore, the tool’s ability to detect subtle, multi-hour latency anomalies in production offers value for proactive monitoring and alerting to prevent degradations affecting CAPTCHA challenge delivery or validation timing. While netstacklat is focused on infrastructure-level monitoring rather than direct bot detection, it provides foundational visibility that complements bot detection signals by clarifying latency sources at the host stack level.
Cite
@article{arxiv2606_02057,
  title={ Waiting at the front door: Continuous monitoring of latency in the host network stack },
  author={ Simon Sundberg and Anna Brunstrom and Simone Ferlin-Reiter and Jesper Dangaard Brouer and Toke Høiland-Jørgensen },
  journal={arXiv preprint arXiv:2606.02057},
  year={ 2026 },
  url={https://arxiv.org/abs/2606.02057}
}