
AlphaTransit: Learning to Design City-scale Transit Routes
Source: arXiv:2605.28730 · Published 2026-05-27 · By Bibek Poudel, Sai Swaminathan, Weizi Li
TL;DR
The Transit Route Network Design Problem (TRNDP) involves sequentially constructing bus route networks where the impact of each route addition is only measurable after completing the full network, introducing delayed feedback and complex route interactions such as transfer bottlenecks and redundancies. This paper presents AlphaTransit, a novel framework combining Monte Carlo Tree Search (MCTS) with a learned neural policy-value network to guide city-scale transit route design. The policy proposes route extensions, the value network estimates downstream network quality, and MCTS uses these predictions for efficient lookahead search, avoiding costly simulator calls at every node. AlphaTransit is evaluated on a new Bloomington, Indiana benchmark with realistic road topology and census-based travel demand under both mixed and full transit modal split scenarios. It significantly improves service rate and operational efficiency metrics over strong baselines including end-to-end reinforcement learning (RL) and pure MCTS without learning.
AlphaTransit achieves service rates of 54.6% (mixed demand) and 82.1% (full demand) on Bloomington, outperforming end-to-end RL by 9.9% and 11.4%, respectively, and pure MCTS by 2.5% and 11.2%. It also improves bus utilization and route efficiency while maintaining manageable computational cost by running MCTS with learned priors and values instead of relying on expensive simulator rollouts within the search tree. The approach generalizes reasonably to a larger Laval network benchmark with no retraining. The results demonstrate that coupling learned policies and value estimations with MCTS lookahead provides a more effective training signal for the challenging sparse-reward routing task than either RL or search alone.
Key findings
- AlphaTransit attains a mean service rate of 54.64% under mixed demand (α=0.3) and 82.08% under full demand (α=1.0) on the Bloomington network.
- Relative to end-to-end RL without search, AlphaTransit improves service rate by 9.9% (α=0.3) and 11.4% (α=1.0).
- Relative to pure MCTS without learned priors or values, AlphaTransit improves service rate by 2.5% (α=0.3) and 11.2% (α=1.0).
- AlphaTransit achieves highest bus utilization (22.1%) and second-highest route efficiency under mixed demand, and best wait time, route efficiency, and bus utilization under full demand.
- Under a fixed compute budget (Niter=500 MCTS simulations), AlphaTransit’s use of learned policy and value estimates keeps per-decision runtime to seconds, whereas pure MCTS requires hundreds to thousands of seconds.
- AlphaTransit covers fewer nodes and less route distance than end-to-end RL (117 vs. 138 nodes, 120.8 km vs. 142.3 km) while serving more demand with smaller fleet size (80 vs. 86 buses).
- On cross-city transfer to the larger Laval network, AlphaTransit trained on Bloomington achieves 90.72% service rate under full demand, outperforming end-to-end RL at 55.03%.
- Increasing MCTS search depth beyond 400 simulations per decision degrades performance, indicating an optimal computational budget for search complexity.
Threat model
n/a — The study focuses on combinatorial optimization of transit route networks under stochastic passenger demand and simulator feedback, rather than adversarial or security threats.
Methodology — deep read
The study tackles the Transit Route Network Design Problem (TRNDP) as a finite-horizon Markov Decision Process (MDP) where an agent sequentially selects route extensions to construct a set of bus routes on a known road graph. The threat model is not adversarial but focuses on efficiently solving a combinatorial optimization with delayed and sparse simulator feedback.
The dataset is a realistic benchmark based on the Bloomington, Indiana street network with 143 nodes and 243 edges, populated by a census-derived origin-destination (OD) trip demand matrix. Two demand splits are evaluated: mixed demand (α=0.3) where 30% of trips use transit, and full demand (α=1.0). A larger transfer test uses the Laval, Canada network with 632 nodes and 1,971 edges, not used for training.
The AlphaTransit architecture uses a shared Graph Attention Network version 2 (GATv2) backbone to produce node embeddings from graph connectivity, edge features, per-node attributes including partial route construction state, and demand data. A policy head outputs logits over feasible next-hop nodes masked to exclude invalid route extensions. A value head aggregates global graph features via max and mean pooling and outputs a scalar value estimating the expected final network quality from the current partial design.
At each route construction step, AlphaTransit runs Monte Carlo Tree Search (MCTS) using the learned policy to guide prior probabilities and the value network to evaluate leaf states without simulator rollouts, significantly speeding up search. Search uses the PUCT algorithm combining exploitation and exploration with a tuning parameter. Visit counts define a search-improved policy that samples the next route extension. Once a full set of routes is constructed, a mesoscopic traffic simulator (UXsim) evaluates the entire network using metrics weighted in a scalar multi-objective reward balancing passenger coverage, wait and travel times, transfer rate, fleet size, bus utilization, and route overlap.
Training proceeds in a loop sampling episodes with MCTS-based policies, storing state and improved action distributions, then updating the policy-value network via a combined cross-entropy and value regression loss to mimic MCTS search targets and predict final rewards. Reward shaping methods (delta coverage and early stopping penalties) are used in the end-to-end RL baseline for comparison. The final construction horizon is Tmax = K(Lmax-1) = 16*13 = 208 node extensions maximum per episode.
Evaluation metrics include service rate (% of demand served), journey time, transfer rate, route efficiency (passengers per km), bus utilization, and fleet size. Ablations compare AlphaTransit with pure MCTS using uniform priors and full rollouts, end-to-end RL without search guidance, heuristic baselines like Demand Coverage and Shortest Path, metaheuristics (Genetic Algorithm, Bee Colony Optimization), and neural evolutionary algorithms combining learned heuristics and metaheuristics. Cross-city transfer is tested by applying the Bloomington-trained model to the Laval network without retraining.
AlphaTransit training runs for approximately 1 million environment steps with 500 MCTS simulations per decision. The system uses parallel workers and single CPU-worker per run for MCTS. Policy network size and search budget are varied for compute-quality tradeoff analysis. The complete code and benchmark dataset are publicly released. Some hyperparameter and architectural details (e.g., exact GAT block counts, embedding sizes) are provided in appendices but overall design follows a principled neural MCTS framework inspired by AlphaZero-style planning but adapted to simulator-defined, stochastic, delayed rewards.
A concrete example episode involves sequentially extending 16 routes from a transit center hub with simple-path constraints, using MCTS guided by the policy-value net to choose each next node from feasible neighbors, and receiving a terminal simulator reward estimating network performance after constructing all routes and assigning frequencies via the max-load rule. This reward directs policy-value network updates to improve future search quality.
Technical innovations
- Coupling Monte Carlo Tree Search with a learned neural policy-value network to enable efficient decision-time lookahead in transit route design without simulator rollouts in the search tree.
- Formulating transit route construction as a sequential Markov decision process with graph-structured state inputs processed by a GATv2 backbone, enabling generalization over realistic urban road networks.
- Introducing a new Bloomington TRNDP benchmark with realistic road topology and census-derived demand for empirical evaluation of bus network design algorithms under mixed and full transit demand.
- Designing a multi-objective terminal reward combining passenger service metrics (coverage, wait time, transfers) and operator constraints (fleet size, overlap, utilization) balanced via tunable weights.
Datasets
- Bloomington TRNDP benchmark — 143 nodes, 243 edges — publicly released at https://github.com/poudel-bibek/AlphaTransit
- Laval network — 632 nodes, 1971 edges — derived from Holliday et al. [24] benchmark
Baselines vs proposed
- End-to-End Reinforcement Learning: service rate = 44.7% (approximate from relative gains) vs AlphaTransit 54.64% (mixed demand)
- Pure Monte Carlo Tree Search (uniform priors + full rollouts): service rate = 53.3% vs AlphaTransit 54.64% (mixed demand)
- Genetic Algorithm: lower service rate than AlphaTransit (exact value unspecified)
- Bee Colony Optimization: lower service rate than AlphaTransit (exact value unspecified)
- Neural Evolutionary Algorithm: performance lower than AlphaTransit (exact values unspecified)
- Random Walk and Demand Coverage heuristics: much lower service rates (approx. 30-70%) than AlphaTransit
- Cross-city transfer on Laval: End-to-End RL service rate = 55.03%, AlphaTransit 90.72% (full demand)
Figures from the paper
Figures are reproduced from the source paper for academic discussion. Original copyright: the paper authors. See arXiv:2605.28730.
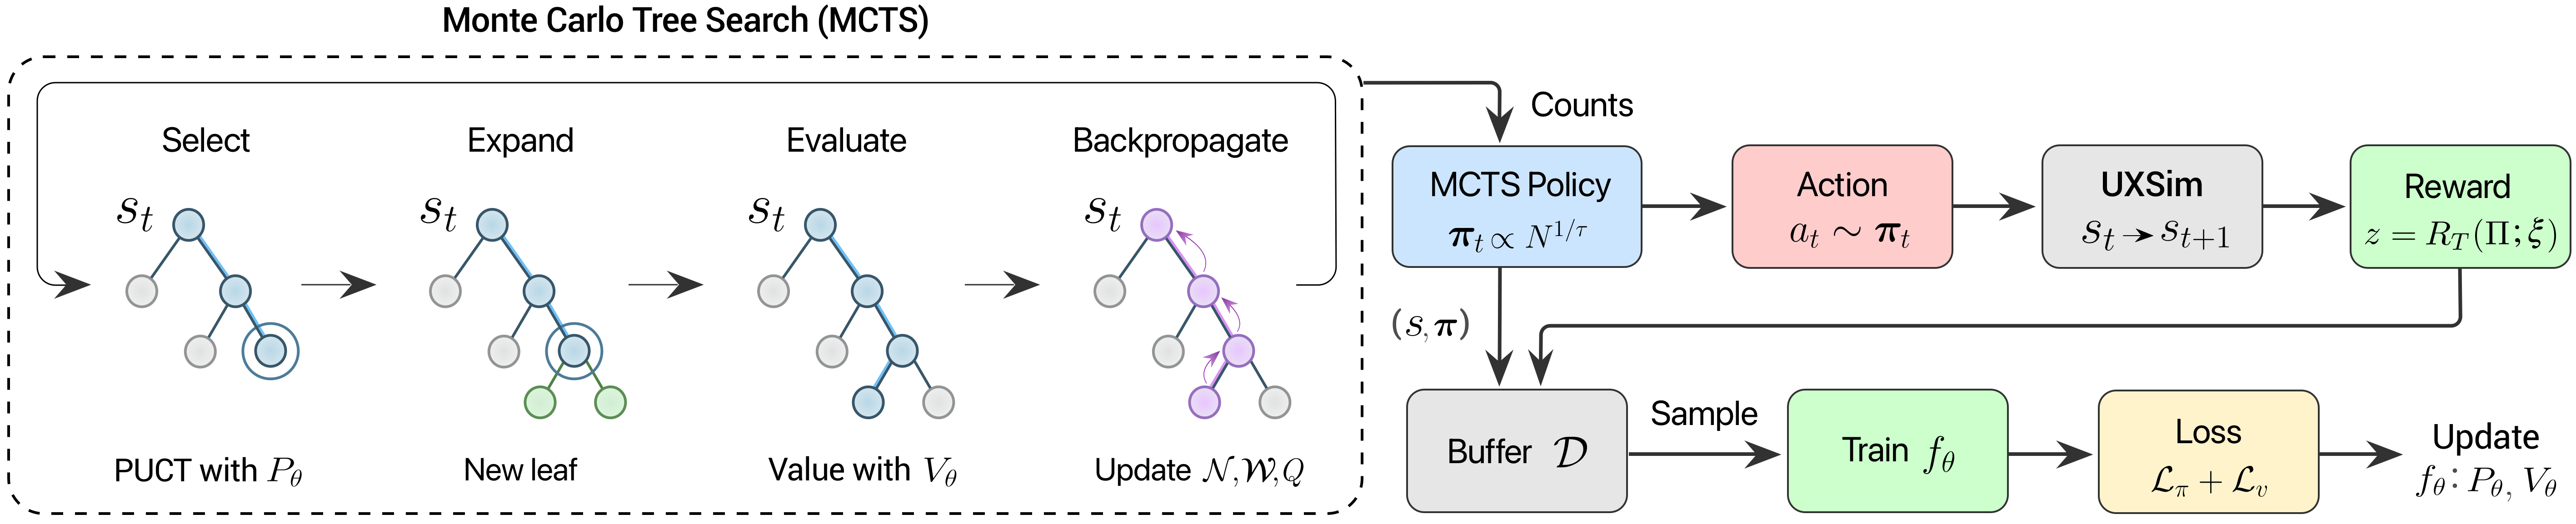
Fig 2: AlphaTransit overview. At each route-construction state st, MCTS uses the policy-value

Fig 7: The Bloomington, Indiana transportation network (∼152.3 km2). The demand map shows

Fig 8: Learning dynamics and search cost under full demand (α = 1.0). LEFT: Curves average
Limitations
- The method is currently tested only on two city networks (Bloomington and Laval), limiting conclusions about scalability to very large metropolitan areas.
- The approach relies on mesoscopic simulation and approximate frequency assignment rather than joint route-frequency optimization, which may not capture all operational constraints.
- The terminal reward weights are manually chosen and may require tuning for different cities or policy preferences.
- AlphaTransit’s training and MCTS inference incurs significant compute costs, limiting rapid re-planning or real-time applications.
- There is no explicit evaluation against adversarial or worst-case demand shifts to test policy robustness.
- The model assumes complete knowledge of the road network and OD demand, which may be unavailable or noisy in practice.
Open questions / follow-ons
- How well does AlphaTransit scale to larger city networks with thousands of nodes and multiple transit modes?
- Can the framework extend to joint route and frequency optimization or other operational parameters?
- What is the impact of noisy or uncertain OD demand data on policy performance and robustness?
- How can the approach incorporate equity and accessibility objectives beyond service rate and efficiency?
Why it matters for bot defense
While AlphaTransit addresses transit network design rather than bot detection or CAPTCHA, it illustrates key principles for combinatorial decision-making under delayed sparse feedback and complex system interactions. Its approach combining learned policy-value networks with Monte Carlo Tree Search to guide sequential decisions under sparse terminal rewards can inspire analogous designs in bot-defense contexts, such as optimizing multi-step interaction policies against evolving adversaries. The use of graph attention networks to encode structured state and the reliance on simulator-based evaluation with learned lookahead are also transferable techniques for systems requiring sequential multi-agent interaction planning with high computational cost per evaluation. However, operational differences mean direct application to CAPTCHA or bot-defense domains would require careful adaptation.
Cite
@article{arxiv2605_28730,
  title={ AlphaTransit: Learning to Design City-scale Transit Routes },
  author={ Bibek Poudel and Sai Swaminathan and Weizi Li },
  journal={arXiv preprint arXiv:2605.28730},
  year={ 2026 },
  url={https://arxiv.org/abs/2605.28730}
}