
Designing Datacenter Power Delivery Hierarchies for the AI Era
Source: arXiv:2605.16255 · Published 2026-05-15 · By Grant Wilkins, Fiodar Kazhamiaka, Alok Gautam Kumbhare, Chaojie Zhang, Ricardo Bianchini
TL;DR
This paper addresses the critical challenge of designing datacenter power delivery hierarchies that remain efficient and scalable into the AI era, where rack power densities are rapidly increasing toward 1 MW per deployment. Traditional planning metrics based on installed megawatts or CapEx per MW ignore how power delivery hierarchies constrain deployable capacity over time, especially under redundancy, multi-resource constraints, and evolving hardware generations. The authors develop a comprehensive lifecycle evaluation framework that models rack arrivals, placement feasibility along hierarchical power delivery trees, resource stranding, harvesting, and decommissioning across multiple halls and years. Using production data from Microsoft Azure and workload projections for GPUs, compute, and storage racks, they simulate multi-year fleet evolution to quantify how power provisioning, topology (distributed vs block redundancy), deployment granularity, and workload mixes jointly impact deployable capacity, effective cost, and throughput. Key results demonstrate that seemingly similar power designs diverge significantly in usable capacity due to distinct stranding mechanisms: distributed redundancy suffers from reserve fragmentation reducing simultaneous headroom, whereas block redundancy creates quantization thresholds limiting placement. These factors cause CapEx differences over time that dwarf static commissioning cost gaps. Throughput per watt varies by over 20x across design and workload combinations. The paper highlights that AI datacenter design must optimize for deployable power capacity over decades, not just initial installed capacity or $/W, and proposes models and heuristics for managing hierarchical constraints in real deployment sequences.
Key findings
- Projected rack power density in AI deployments rises from ~150 kW in 2023 to nearly 1 MW by 2027 at Microsoft Azure.
- Distributed-redundant (e.g., 4N/3) and block-redundant (e.g., 3+1) topologies provision similar high-availability capacity (7.5 MW per hall) but differ in deployable capacity over time.
- Single-hall Monte Carlo simulations show similar UPS line-up stranding levels between 4N/3 and 3+1, but 8-year fleet lifecycle simulations reveal 3+1 accumulates significantly higher tail stranding, requiring 23 more halls to meet the same demand (Fig 5b).
- Higher placement granularity of larger GPU pods reduces inference cost per token by improving throughput efficiency, but only justifies higher infrastructure investment if power delivery design supports placement feasibility.
- Stranding in distributed redundancy arises from simultaneous headroom constraints across k parents (Equation 1), fragmenting deployable capacity as deployment quantum grows.
- Block redundancy stranding occurs at coarse divisibility thresholds of block capacity, causing sharp capacity cliffs as deployments slightly exceed line-up fractions (Equation 2).
- Variance minimization heuristics for rack placement reduce stranded capacity vs random or round-robin policies, especially for distributed-redundant designs (Fig 7).
- Simulation validated against 18 real Azure datacenters over 6 years matches median unused power within 6%, supporting framework fidelity (Fig 9).
Threat model
The adversary is not a malicious entity but rather the environmental and operational constraints imposed by fixed hierarchical power delivery infrastructure, redundancy requirements, and multi-resource limits that prevent hosting of arriving rack deployments. The 'attack' is stranding of capacity due to rigid topology and placement constraints. Operators cannot modify installed infrastructure easily and must manage evolving heterogeneous deployment sequences without breaching high availability or cooling constraints.
Methodology — deep read
The authors first define the threat model as constrained datacenter operators needing to deploy diverse rack workloads containing GPUs, general compute, and storage, with the adversarial scenario being capacity fragmentation limiting deployable power rather than active attacks. The power delivery hierarchy is modeled as a tree with components from grid to rack, including substations, UPS units, switchboards, row-level distribution, busbars, PDUs, and server PSUs. They study two common redundancy topologies: distributed redundancy (xN/y systems with shared reserve across active line-ups) and block redundancy (m+1 designs dedicating whole line-ups for failover).
Datasets originate from Microsoft Azure production data including historical rack deployments, power density distributions, and hardware lifetimes. They model a fleet of datacenter halls with thousands of racks, simulating multiple years (2025-2035) with projected growth envelopes for GPU, compute, and storage racks. Arrival sequences sample rack deployments according to hardware class power projections and SKU cluster distributions. They model power and cooling demands per rack, with cooling split by air and liquid cooling demands derived from power.
The core architecture is a custom simulation framework combining a placement simulator and cost and throughput models. Placement simulates rack assignments to rows within halls under hierarchical capacity constraints (power, cooling, space, networking), enforcing redundancies per topology. Deployments can be harvested (power oversubscription) and decommissioned following modeled lifetimes with Gaussian distributions. Four placement policies are compared: random, round robin, min utilization, and variance minimization, with the latter emerging best.
Training as such is not applicable, but the simulation is configured with input parameters for arrival rates, power distributions, cooling ratios, and CapEx models from Azure data and literature. Hardware generation evolves over time with rack power and pod size increasing per projections.
Evaluation uses two main modes: single-hall Monte Carlo trials to isolate power topology effects on deployed capacity and stranding under uniform deployments, and fleet-wide multi-year simulations modeling dynamic arrivals, hardware refresh, harvesting, and decommissions across multiple halls to capture long-term effects. Metrics collected include deployable capacity, stranded power fractions, effective CapEx ($/MW deployed), and workload throughput (inference tokens per second per watt). Baseline comparisons between distributed and block redundancy are made.
The framework is thoroughly validated against 18 real Azure datacenters over a six-year window, comparing distributions of unused power which match closely (median error <6%) despite real-world variance. This supports the model's fidelity at capturing hierarchical capacity constraints and stranding mechanisms. One concrete example is the 8-year fleet simulation comparing 4N/3 and 3+1: while both start at similar capacities, 3+1 accrues higher stranding tail risk due to power quantization at line-up granularity, requiring ~23% more halls built to host equal demand, almost doubling CapEx gap from 3% to ~6% over the lifecycle.
Technical innovations
- A lifecycle evaluation framework modeling hierarchical multi-resource capacity constraints, arrivals, harvesting, and decommissioning over multi-year datacenter fleets.
- Identification and quantification of distinct capacity stranding mechanisms in distributed vs block redundant power delivery topologies under increasing rack power and deployment quantum.
- Demonstration that deployable power capacity over time, not installed MW or static $/W, is the key metric for AI datacenter power delivery design evaluation.
- Integration of rack placement heuristics (variance minimization) that reduce capacity stranding in hierarchical redundancy constraints.
- Empirical use of production Azure data for power and workload projections to ground simulation in realistic operational settings.
Datasets
- Microsoft Azure rack deployment logs — 18 datacenters over 6 years (2020-2026) — internal production data
- Rack power distributions for compute and storage SKUs in Azure — thousands of racks — internal telemetry
- Projected GPU pod and rack power data from public vendor disclosures and industry reports
Baselines vs proposed
- 4N/3 distributed vs 3+1 block redundancy: initial cost $10M/MW vs $10.3M/MW; 8-year effective CapEx difference grows to 5.8% due to higher stranding in 3+1 (Fig 5b).
- Throughput per watt on LLM inference varies over 20x across different designs and rack projections (Fig 2).
- Placement policies in single-hall simulation: variance minimization reduces line-up stranding compared to random or round robin (Fig 7).
Figures from the paper
Figures are reproduced from the source paper for academic discussion. Original copyright: the paper authors. See arXiv:2605.16255.

Fig 3: Example of major components in a datacenter
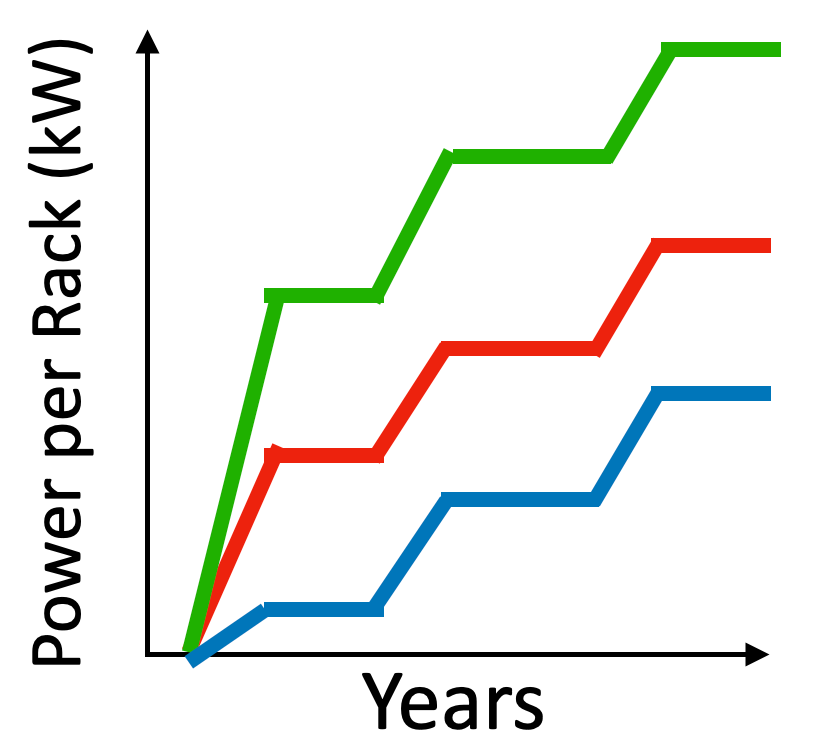
Fig 9: Validation of our simulator against historical rack
Fig 10: Deployment-trace generation pipeline. Stage (1)
Limitations
- Simulation assumes instantaneous new hall commissioning when existing capacity saturates, ignoring real-world construction lead times and operational disruptions.
- Workload throughput and power projections rely on public disclosures and stylized models which may not capture all emerging accelerator architectures or future hardware trends.
- The framework focuses on hierarchical capacity and redundancy constraints but omits direct modeling of outage probabilities or failure modes beyond standard Tier III/IV assumptions.
- Placement heuristics are limited to online policies; offline global placement with lookahead or stochastic optimization is not studied.
- Cooling and networking constraints are abstracted and fixed ratios assumed; real data centers may exhibit more complex correlation and bottleneck effects.
- The simulation is validated only against unused power distributions, not against other operational metrics such as latency or cost per workload.
Open questions / follow-ons
- How can dynamic or reconfigurable power delivery topologies mitigate capacity stranding as densities rise?
- What optimizations in global placement algorithms or mixing deployment granularities can further reduce stranding under hierarchical constraints?
- Can machine learning models better predict future capacity fragmentation patterns to inform adaptive power provisioning?
- How do outage and failure scenarios beyond standard Tier III/IV assumptions impact deployable capacity over lifecycle?
Why it matters for bot defense
For bot-defense and CAPTCHA practitioners, this paper offers insights into system-level resource constraints and capacity planning challenges in environments experiencing explosive workload growth and hardware evolution. Although focused on datacenter power delivery, the principles around multi-dimensional resource stranding, hierarchical placement constraints, and lifecycle modeling can inspire approaches to managing bursty, heterogeneous bot or CAPTCHA loads that share finite infrastructure resources like network, compute, or verification pipelines. The importance of considering deployable capacity over static provisioned capacity also applies to bot-defense infrastructure scaling under real-world operational dynamics. The variance-minimizing placement heuristic echoes load balancing approaches that can optimize resource use in defensive systems. Furthermore, recognizing how redundancy strategies influence resource fragmentation may guide design choices for distributed validation or challenge-serving networks to avoid over-committing or underutilizing infrastructure. Ultimately, understanding capacity stranding and how system evolution impacts throughput efficiency is essential for robust, cost-effective bot-defense at scale.
Cite
@article{arxiv2605_16255,
  title={ Designing Datacenter Power Delivery Hierarchies for the AI Era },
  author={ Grant Wilkins and Fiodar Kazhamiaka and Alok Gautam Kumbhare and Chaojie Zhang and Ricardo Bianchini },
  journal={arXiv preprint arXiv:2605.16255},
  year={ 2026 },
  url={https://arxiv.org/abs/2605.16255}
}