
Towards Affordable Energy: A Gymnasium Environment for Electric Utility Demand-Response Programs
Source: arXiv:2605.12462 · Published 2026-05-12 · By Jose E. Aguilar Escamilla, Lingdong Zhou, Xiangqi Zhu, Huazheng Wang
TL;DR
DR-Gym addresses a gap in reinforcement-learning environments for demand response at the electric-utility level. The paper argues that existing simulators are mostly device- or building-centric, while utility operators need a market-facing environment that combines wholesale price uncertainty, heterogeneous customer response, budget constraints, and explicit consumer-protection objectives. To fill that gap, the authors build an open-source Gymnasium-compatible environment where the agent chooses per-kWh bill credits, observes a 32-dimensional state, and is trained against a configurable multi-objective reward.
The main novelty is not a new RL algorithm, but a simulator design that tries to be realistic enough to expose the right sequential decision problem. The environment combines three model families: physics-based building load traces from CityLearn/ResStock, a wholesale-price generator with TOU structure plus AR(1) persistence and regime-switching spike storms calibrated to ERCOT/CAISO-style extremes, and a heterogeneous customer acceptance model with fatigue. Their experiments are proof-of-concept: PPO learns a policy that beats simple heuristics on episode reward and reduces consumer tail risk, suggesting the environment is learnable and useful as a benchmark, though the paper is careful not to claim state-of-the-art control performance.
Key findings
- The observation space is a 32-dimensional hourly vector that includes time, aggregate demand, wholesale price, a 4-step price forecast, temperature, 4 stress indicators, budget state, last credit, 10 building loads, and a 5-step demand history.
- The action is continuous per-kWh credit issuance over [0, 0.10] $/kWh, with a default daily budget drawn from N($100, $20) and 0.95 rollover across days.
- The market model’s AR(1) component is set to ρ = 0.90 and σε = $0.020/kWh, and the paper reports simulated first-order autocorrelation ρ̂1 ≈ 0.85, matching literature ranges of 0.78–0.93 for CAISO/PJM/Nord Pool.
- Regime-switching spike storms are modeled with mean duration ≈ 7 hours (exit probability 0.15/h), and the simulated price cap is $9.50/kWh, aligned with ERCOT’s system-wide offer cap.
- At c = $0.05/kWh, the weighted-average customer acceptance rate is ≈ 0.65, which the authors say is consistent with the 20–72% acceptance range reported across 15 DR pilots.
- PPO trained for 2×10^6 environment steps (≈80,000 episodes) with Stable-Baselines3 hyperparameters clip ratio 0.2, entropy coefficient 0.01, rollout length 2048, 10 epochs/update, lr = 3×10^-4.
- In 100 evaluation episodes, PPO achieved statistically significantly higher mean episode reward than all four baselines (Welch’s t-test, p < 0.05).
- PPO reduced CVaR0.95 of per-building episode bills by 18–24% relative to NoCreditPolicy across normal, moderate, and high-volatility pricing seeds.
- PPO used 72–85% of the daily budget, versus 100% for UniformCreditPolicy and <40% for NoCreditPolicy, indicating selective rather than exhaustive credit issuance.
Threat model
The adversary is not a malicious attacker but an uncertain electricity market and heterogeneous customer population: the utility must choose credit offers without knowing future wholesale prices, extreme weather shocks, or how repeated incentives will fatigue customers. The utility is assumed to have access to current observable state features, but not to hidden future prices or perfect customer compliance; customers may accept or decline credit offers stochastically, and their behavior changes over time. The simulator does not model active adversaries manipulating signals, and the utility cannot directly control exogenous price spikes or weather conditions.
Methodology — deep read
The paper’s threat model is not an adversarial-security setup; it is an RL/control problem for an electric utility acting in a volatile wholesale market. The utility observes the current market state, selects a per-kWh bill credit, and receives delayed effects through customer participation, curtailment, utility revenue, and consumer tail risk. The implicit adversary is not a malicious attacker but exogenous uncertainty: price spikes, temperature extremes, heterogeneous and fatigued customers, and budget scarcity. The authors explicitly assume the utility cannot know future wholesale prices exactly, and that offline historical traces alone are insufficient because they do not capture closed-loop feedback from the utility’s own credit decisions.
Data provenance is a hybrid of public and synthetic sources. Building demand comes from CityLearn’s 2022 phase-1 dataset, which is based on EnergyPlus simulations over NREL ResStock archetypes; the paper treats these as read-only demand traces and says the simulator can in principle accept other demand-profile datasets. Wholesale prices are not sourced from live market feeds during training; instead, the market model is validated against CAISO day-ahead NP15 literature ranges and ERCOT day-ahead statistics. The authors generate an offline 4,380-step trajectory for validation (about 6 months) and a 7-day Uri-analog stress test. Customer response is not fit to a new dataset; it is parameterized from literature survey ranges, especially Faruqui and Sergici’s 15 pilot studies. There is no train/test split in the usual supervised-learning sense because the simulator is the environment; instead, the paper evaluates with fixed seeds and multiple evaluation episodes. The main state for hourly mode is 32-dimensional; 10 building loads are padded/truncated, and the rest encode temporal context, price forecasts, budget, and stress summaries.
Architecturally, DR-Gym is split into six modular components: BuildingSimulator, MarketModel, OpSavingsGenerator, CustomerResponse, GridStressCalculator, and Reward Computer, all wrapped by a Gymnasium environment. The agent action is a scalar credit ct in [0, 0.10] $/kWh. The environment computes retail revenue as (pretail − ct − pt) · Dt, with fixed pretail = $0.15/kWh, and consumer cost as (pretail − ct) · Dt. Demand is not simply exogenous: the paper adds demand-persistence feedback through a per-building exponential decay multiplier mi,t+1 = mi,t·γ + (1−δi,t)(1−γ), where γ = 0.9 and δi,t is the fractional reduction from the accepted credit offer. Importantly, acceptance is always computed against raw baseline demand, not the multiplier-adjusted demand, to avoid compounding reductions unrealistically. The wholesale price model decomposes pt into a TOU base, AR(1) persistence ξt = ρξt−1 + εt, and a two-state Markov spike process; spike entry probability is increased during on-peak hours and at extreme temperatures. They also optionally include a price-elasticity term that feeds recent aggregate reductions back into future prices, but the default is λ = 0, so the core experiments do not depend on that feedback.
The customer model uses four archetypes: price-sensitive, eco-conscious, neutral, and reluctant. For building i of type k, acceptance is modeled as paccept_i,t = p̄k · fi,t · σ(−κk(ct−0.05)), where p̄k is the base acceptance rate, κk is credit sensitivity, and fi,t is a fatigue factor that decays with repeated activations and recovers otherwise. If accepted, the load reduction ri,t is drawn from a Gaussian with archetype-specific mean and standard deviation. The paper says the archetype parameters are calibrated to literature ranges: base accept rates and reduction magnitudes are chosen to sit within Faruqui and Sergici’s reported DR pilot ranges, and the fatigue decay is qualitatively motivated by prior behavioral work. Grid stress is represented by three sigmoid-based indicators for demand, price, and thermal stress, combined into an overall stress score. Reward is a weighted sum of revenue, consumer cost, grid stress, and an optional risk term; for the experiments, they use weights (0.3, 0.5, 0.2, 0.3) and Conditional Value-at-Risk as the risk measure.
For training, they run PPO from Stable-Baselines3 with clip ratio 0.2, entropy coefficient 0.01, 2048 steps per rollout, 10 epochs per update, and learning rate 3×10^-4. Training lasts 2×10^6 environment steps, which the authors equate to about 80,000 one-day episodes in hourly mode with N = 50 buildings. They fix a random seed for reproducibility, but the paper does not report multi-seed training averages or sensitivity to initialization. Evaluation is against four hand-designed baselines: NoCreditPolicy, UniformCreditPolicy, RuleBasedPolicy, and BudgetAwareRulePolicy. The paper measures mean episode reward and CVaR0.95 of per-building episode bills, and uses Welch’s t-test over 100 evaluation episodes to claim significance at p < 0.05. One concrete end-to-end example is the NoCreditPolicy baseline: on each hour it issues ct = 0, which preserves utility revenue in normal hours because pretail exceeds wholesale price, but it leaves households fully exposed to price spikes, producing the worst consumer tail risk; PPO instead learns to allocate credits selectively in high-stress intervals and to preserve budget for longer spike storms.
Reproducibility is partial. The paper is explicit that the environment is open-source and Gymnasium-compatible, and it is designed to plug into Stable-Baselines3, CleanRL, or Ray RLlib. It also provides validation snapshots and cites the external datasets and libraries it depends on. However, from the provided text, I cannot verify whether code, frozen weights, or exact config files are fully released, and the customer model, budget model, and some calibration choices remain literature-informed defaults rather than fitted estimates. The evaluation is convincing as a benchmark demonstration, but not a complete reproducibility package in the strict sense.
Technical innovations
- A Gymnasium-compatible, utility-level demand-response environment that models bill-credit issuance rather than device-level HVAC or battery scheduling, unlike CityLearn, Sinergym, Grid2Op, or Pymgrid.
- A regime-switching wholesale price generator that combines TOU structure, AR(1) persistence, and clustered spike storms calibrated to extreme-market behavior instead of i.i.d. jumps.
- A heterogeneous customer-acceptance model with fatigue and archetype-specific sensitivity, extending earlier logistic incentive-response models to a multi-building closed loop.
- A configurable multi-objective reward with an explicit risk-aware term based on CVaR, allowing consumer-protection objectives to be optimized alongside revenue and grid stress.
Datasets
- CityLearn challenge 2022 phase 1 / EnergyPlus / NREL ResStock — not stated in paper; building-load source used as replayed hourly profiles — public dataset
- CAISO day-ahead locational marginal prices (NP15 North hub) — not stated in paper; used for validation snapshots — public market data via gridstatus
- ERCOT day-ahead market statistics / Winter Storm Uri benchmarks — not stated in paper; used for calibration and validation ranges — public/literature benchmark
Baselines vs proposed
- NoCreditPolicy: mean episode reward = lower than PPO vs proposed: statistically significantly lower (Welch’s t-test p < 0.05 over 100 evaluation episodes)
- UniformCreditPolicy: mean episode reward = lower than PPO vs proposed: statistically significantly lower (Welch’s t-test p < 0.05 over 100 evaluation episodes)
- RuleBasedPolicy: mean episode reward = lower than PPO vs proposed: statistically significantly lower (Welch’s t-test p < 0.05 over 100 evaluation episodes)
- BudgetAwareRulePolicy: mean episode reward = lower than PPO vs proposed: statistically significantly lower (Welch’s t-test p < 0.05 over 100 evaluation episodes)
- NoCreditPolicy: CVaR0.95 consumer bills = higher than PPO vs proposed: 18–24% reduction relative to NoCreditPolicy
- UniformCreditPolicy: budget use = 100% vs proposed: 72–85%
- NoCreditPolicy: budget use = <40% vs proposed: 72–85%
Figures from the paper
Figures are reproduced from the source paper for academic discussion. Original copyright: the paper authors. See arXiv:2605.12462.
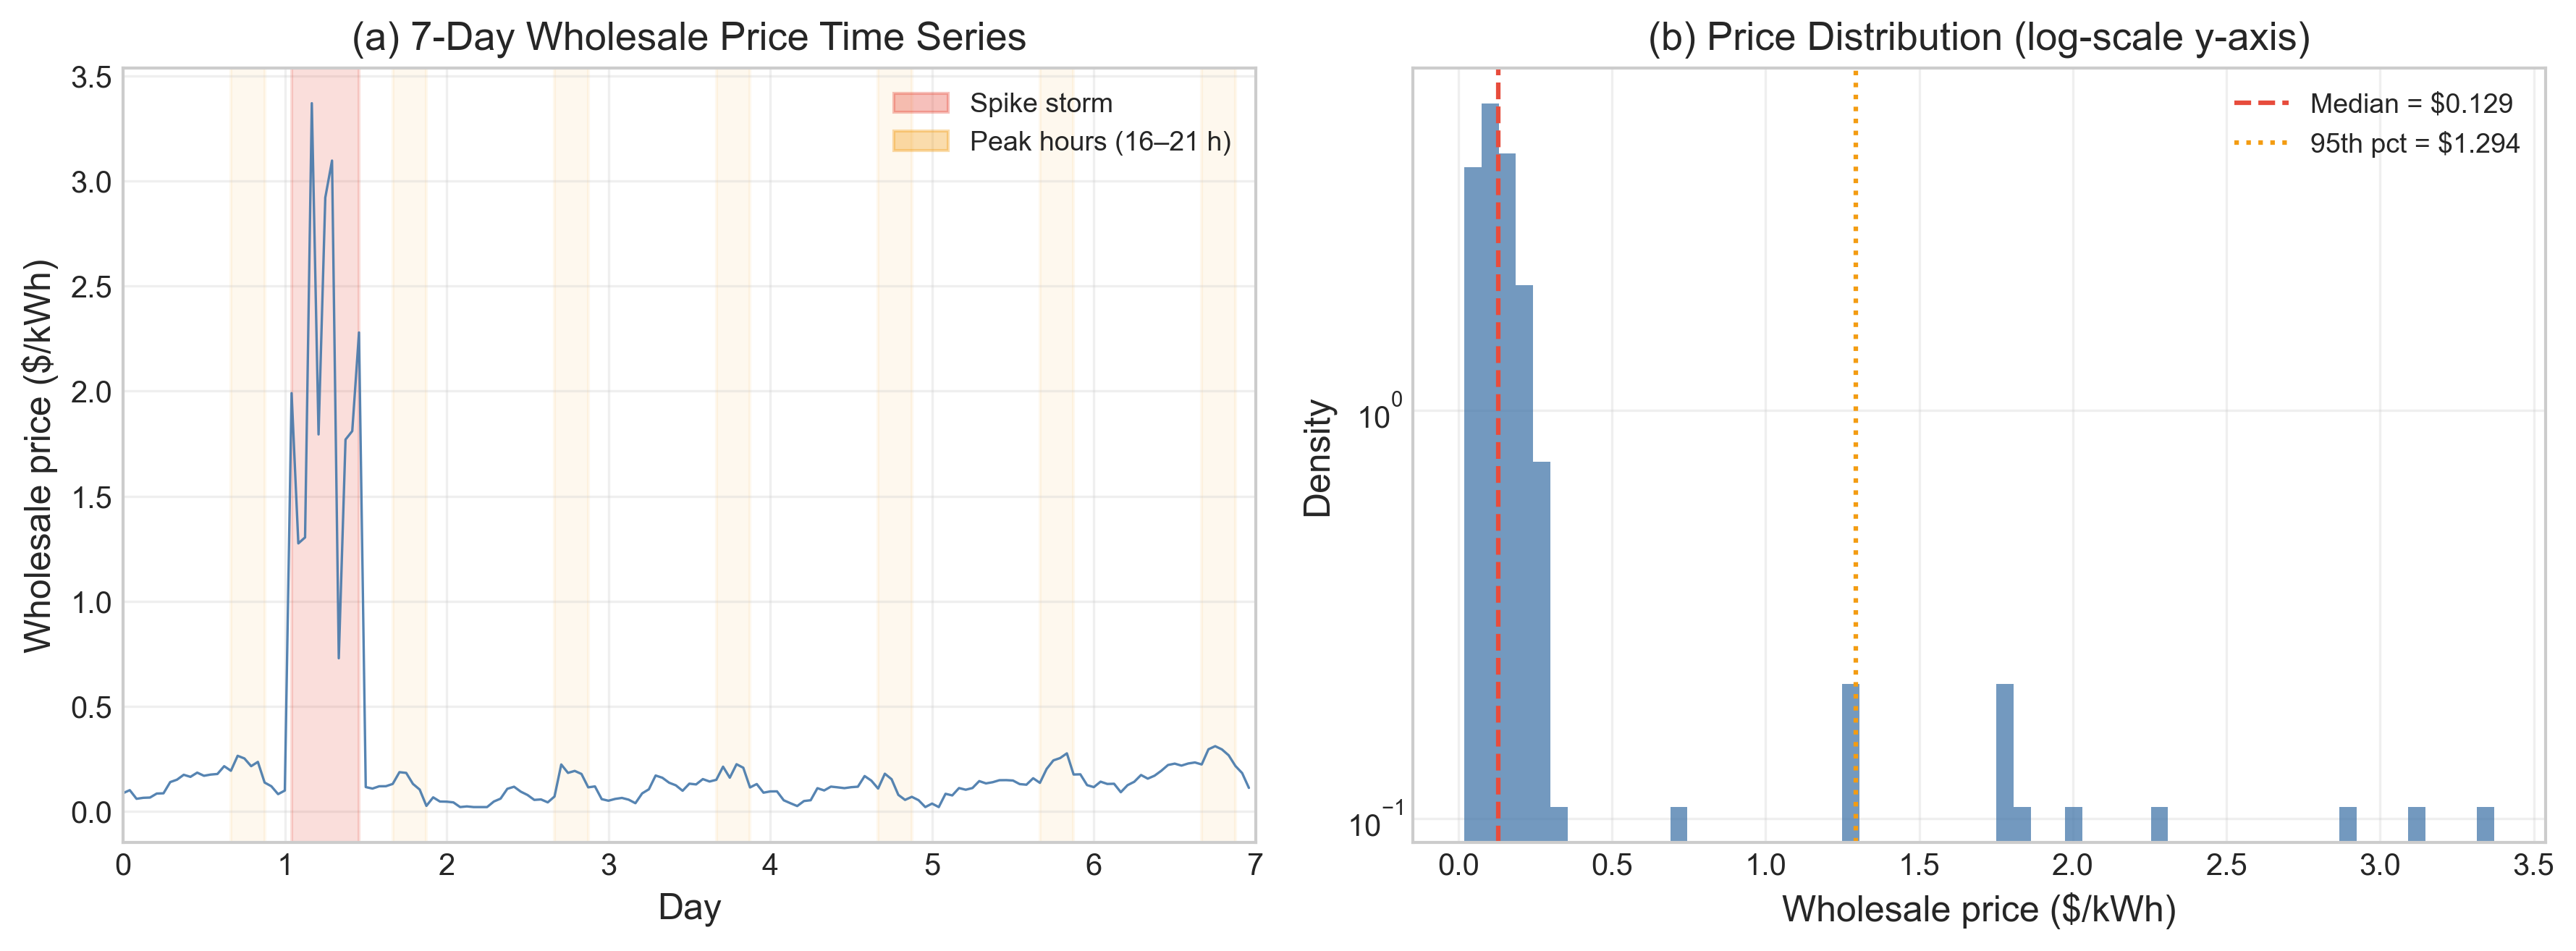
Fig 3: Wholesale price dynamics produced by the DR-Gym market model. (a) A representative
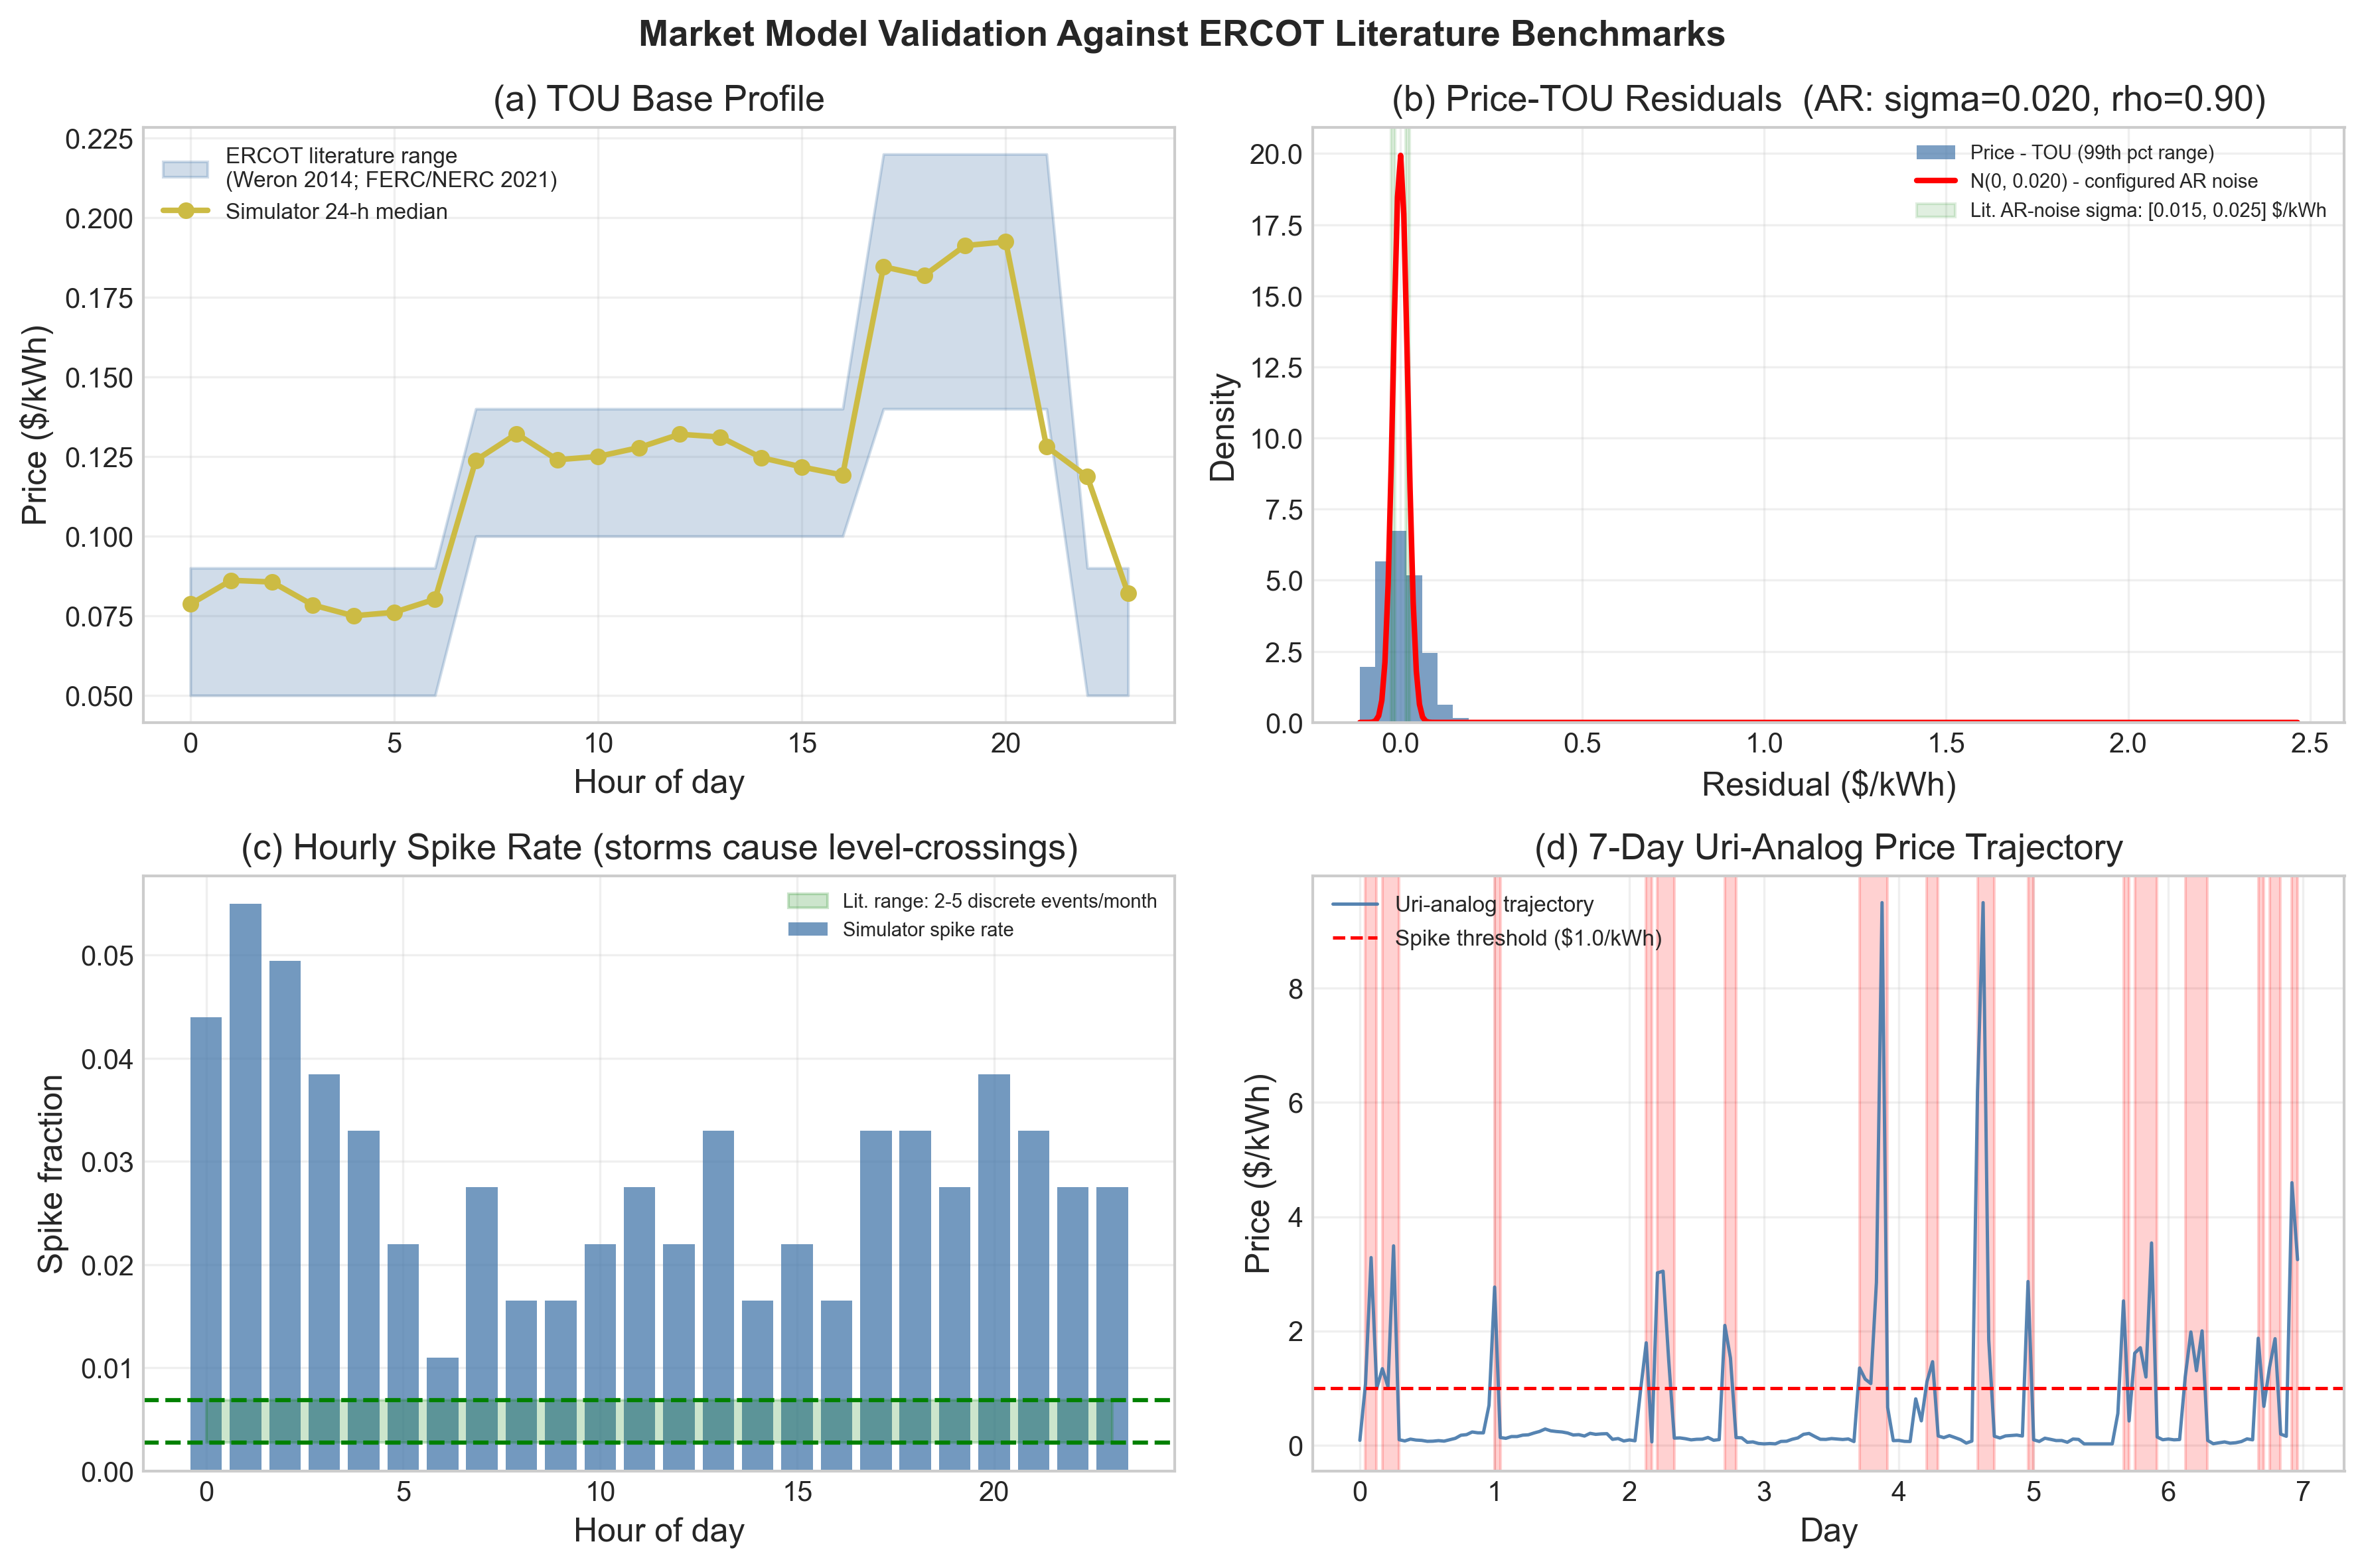
Fig 4: Market model validation against ERCOT day-ahead market statistics. (a) Simulator 24-h
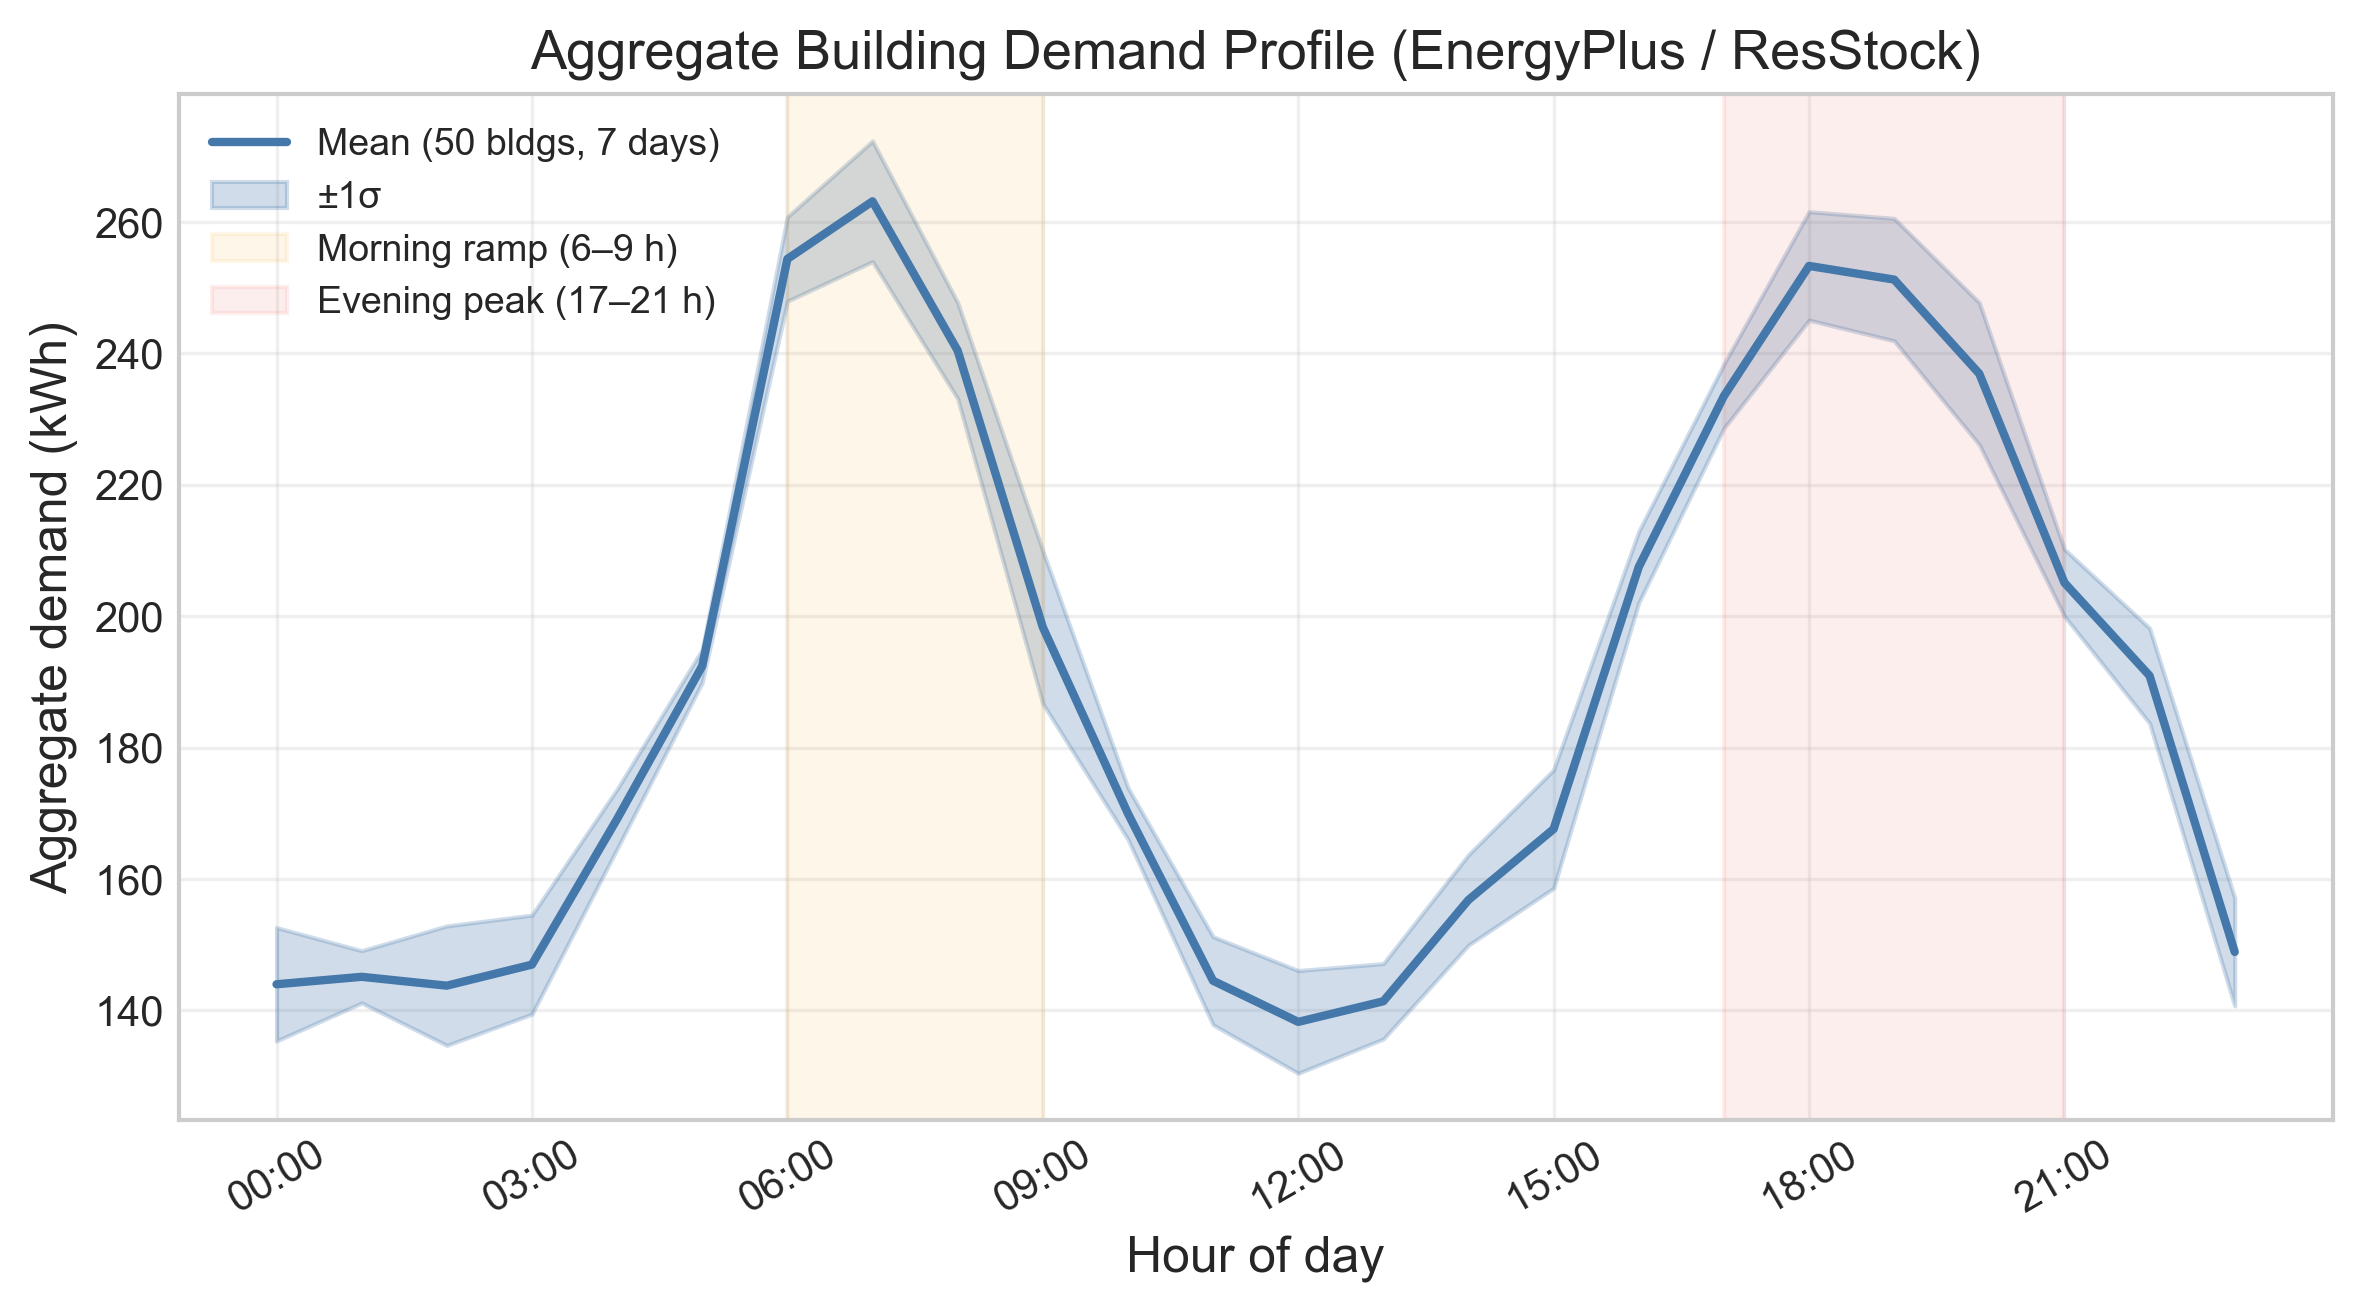
Fig 5: Aggregate building demand profile: mean and standard deviation across 50 buildings
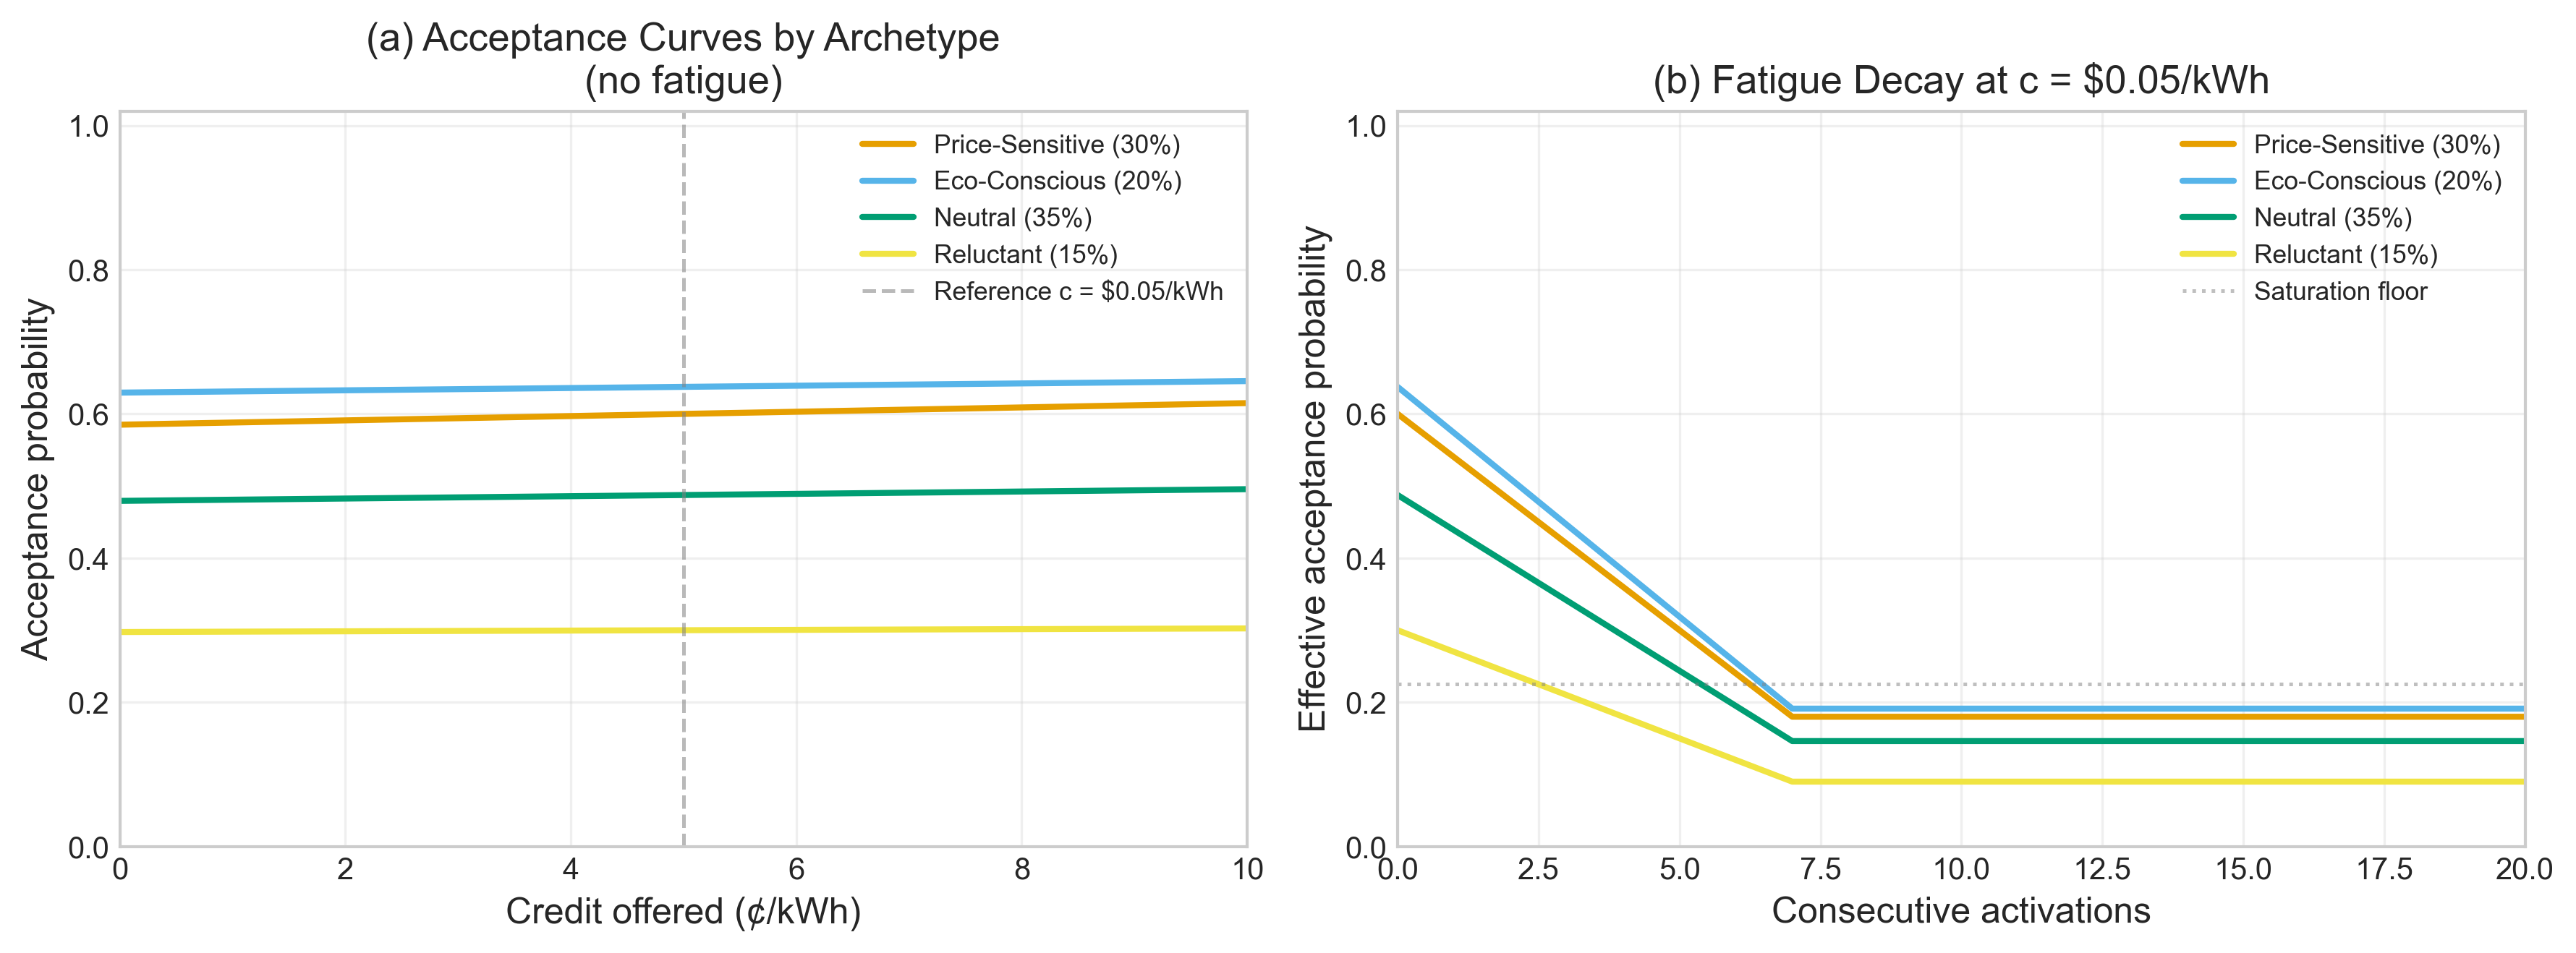
Fig 6: Customer response model validation.
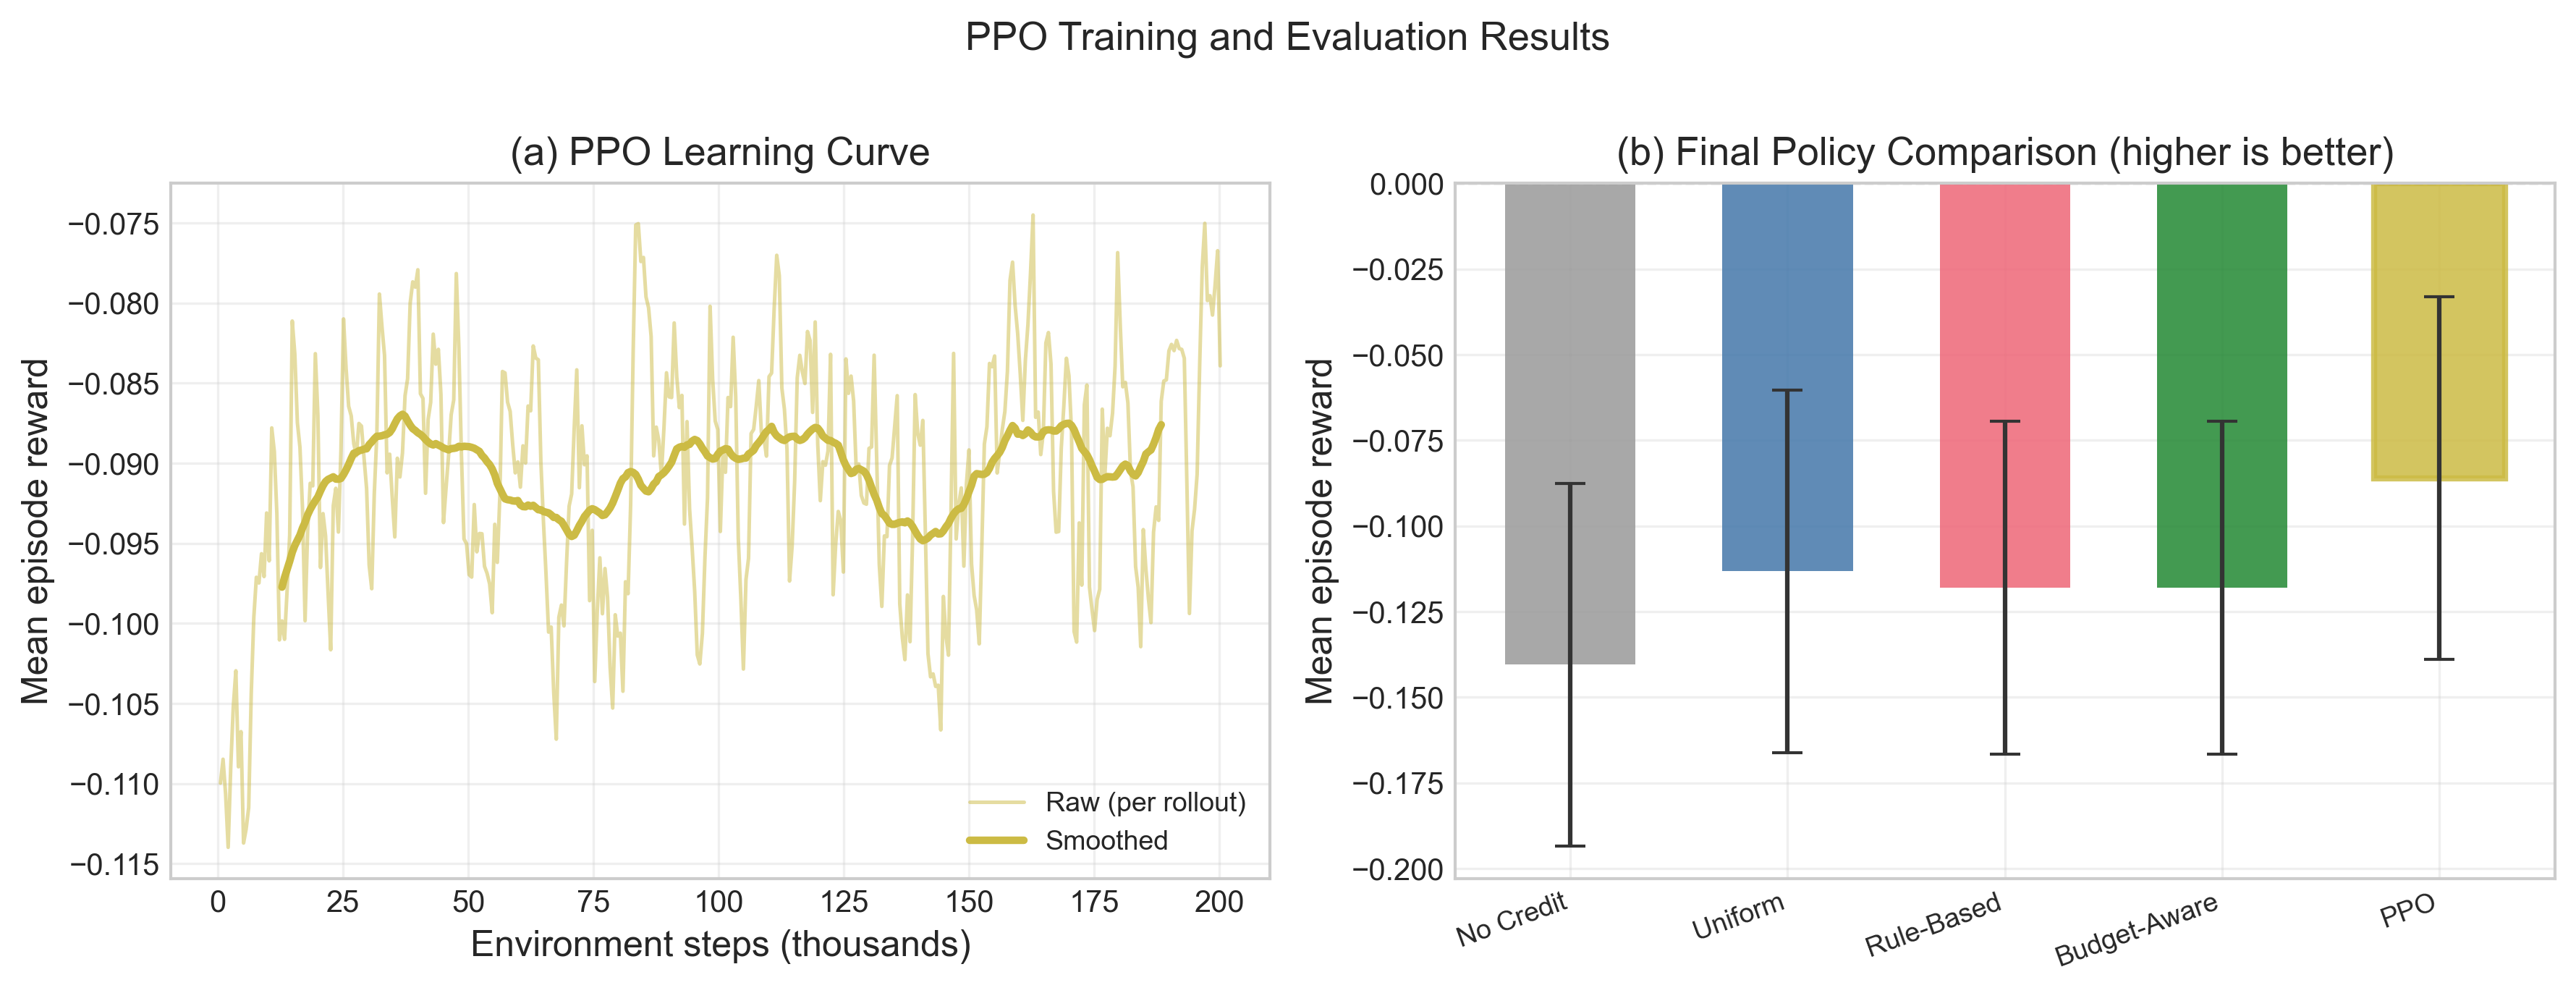
Fig 7: PPO learning and final evaluation. (a) PPO episode reward during training (smoothed).
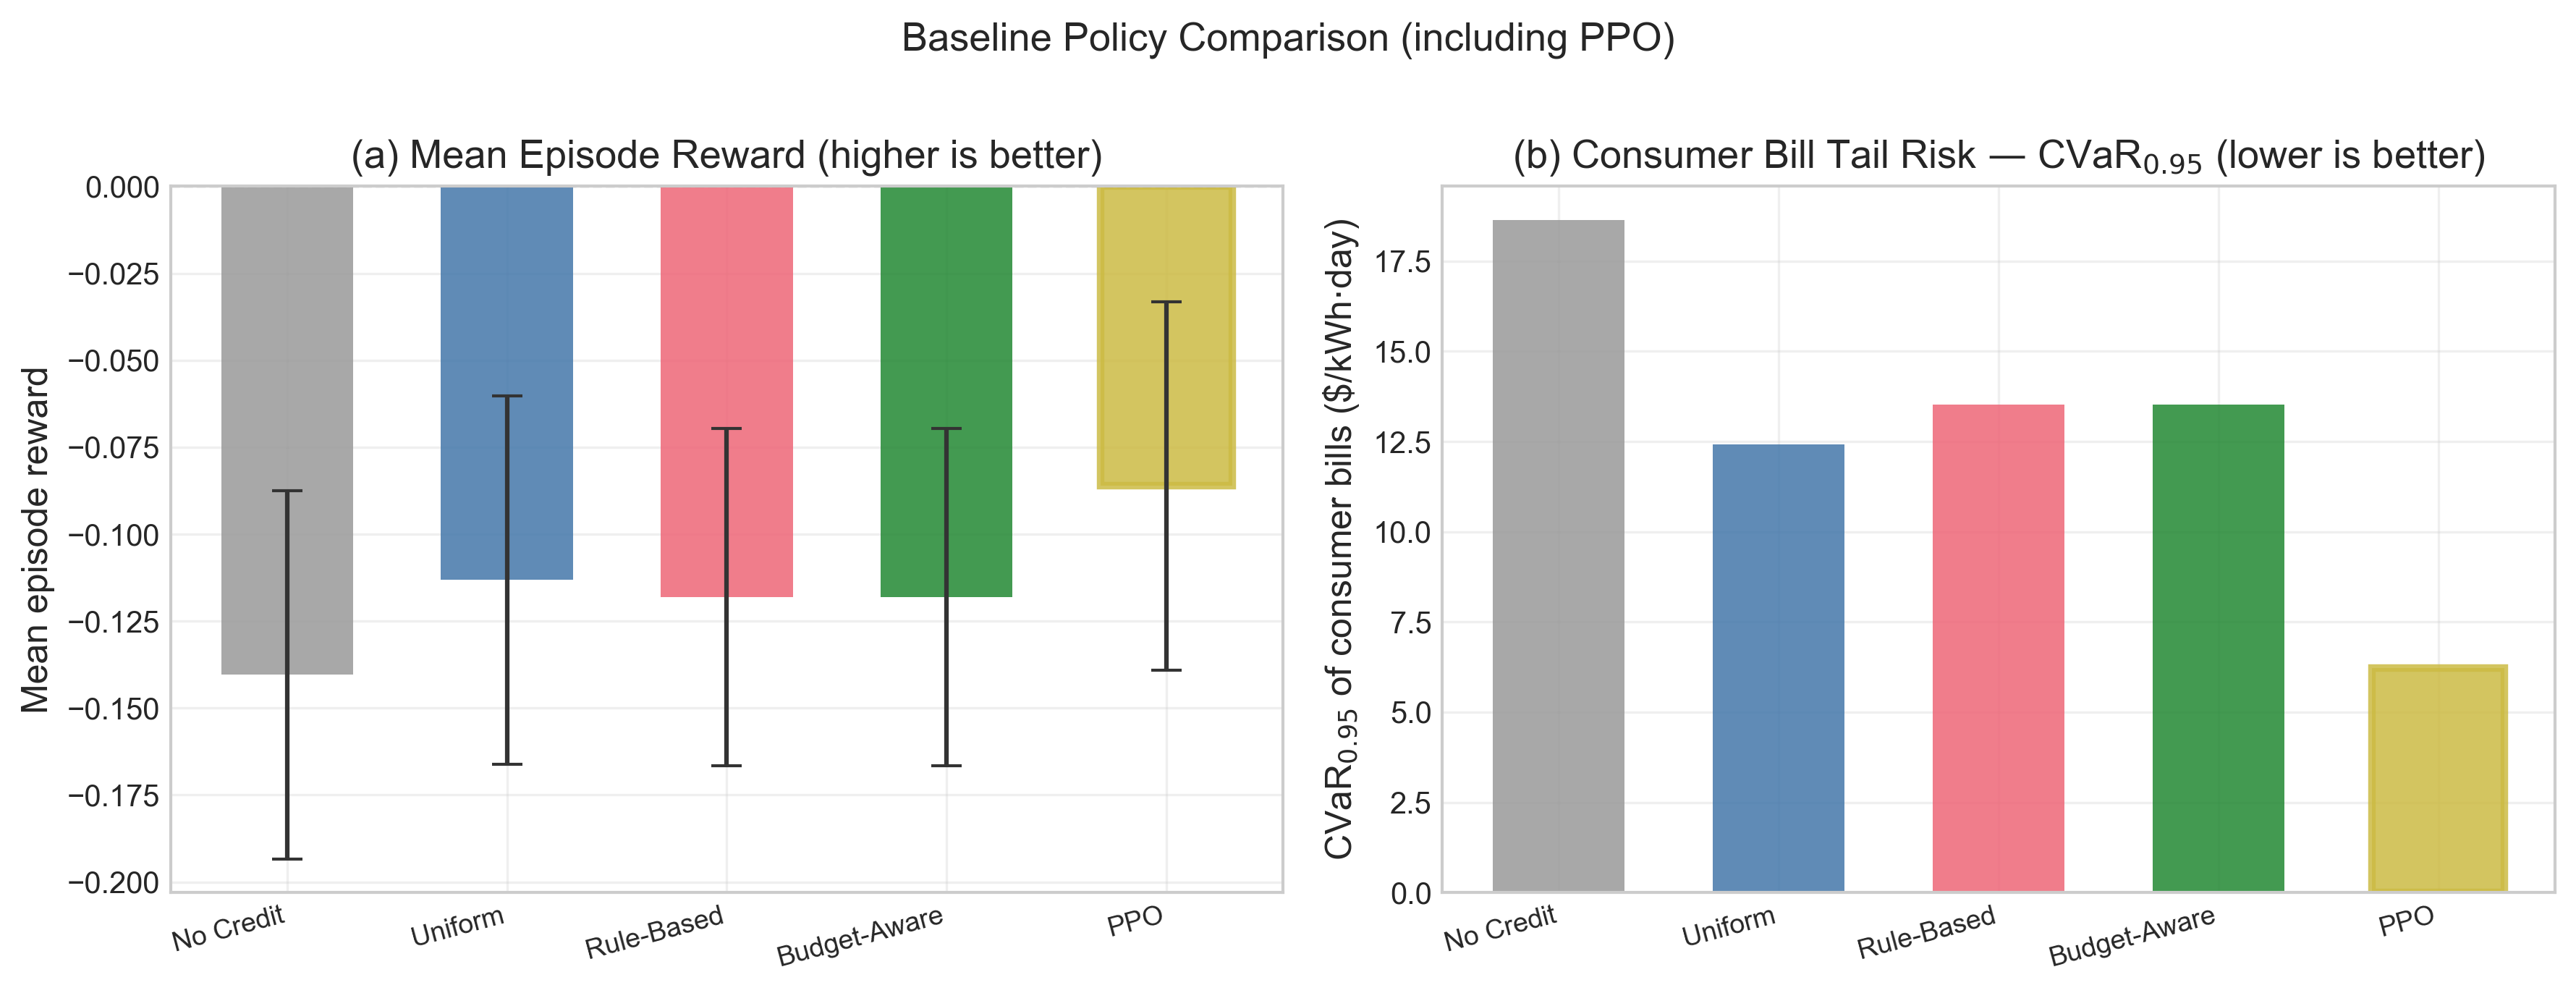
Fig 8: Baseline and PPO policy comparison over 50 evaluation episodes. (a) Mean episode
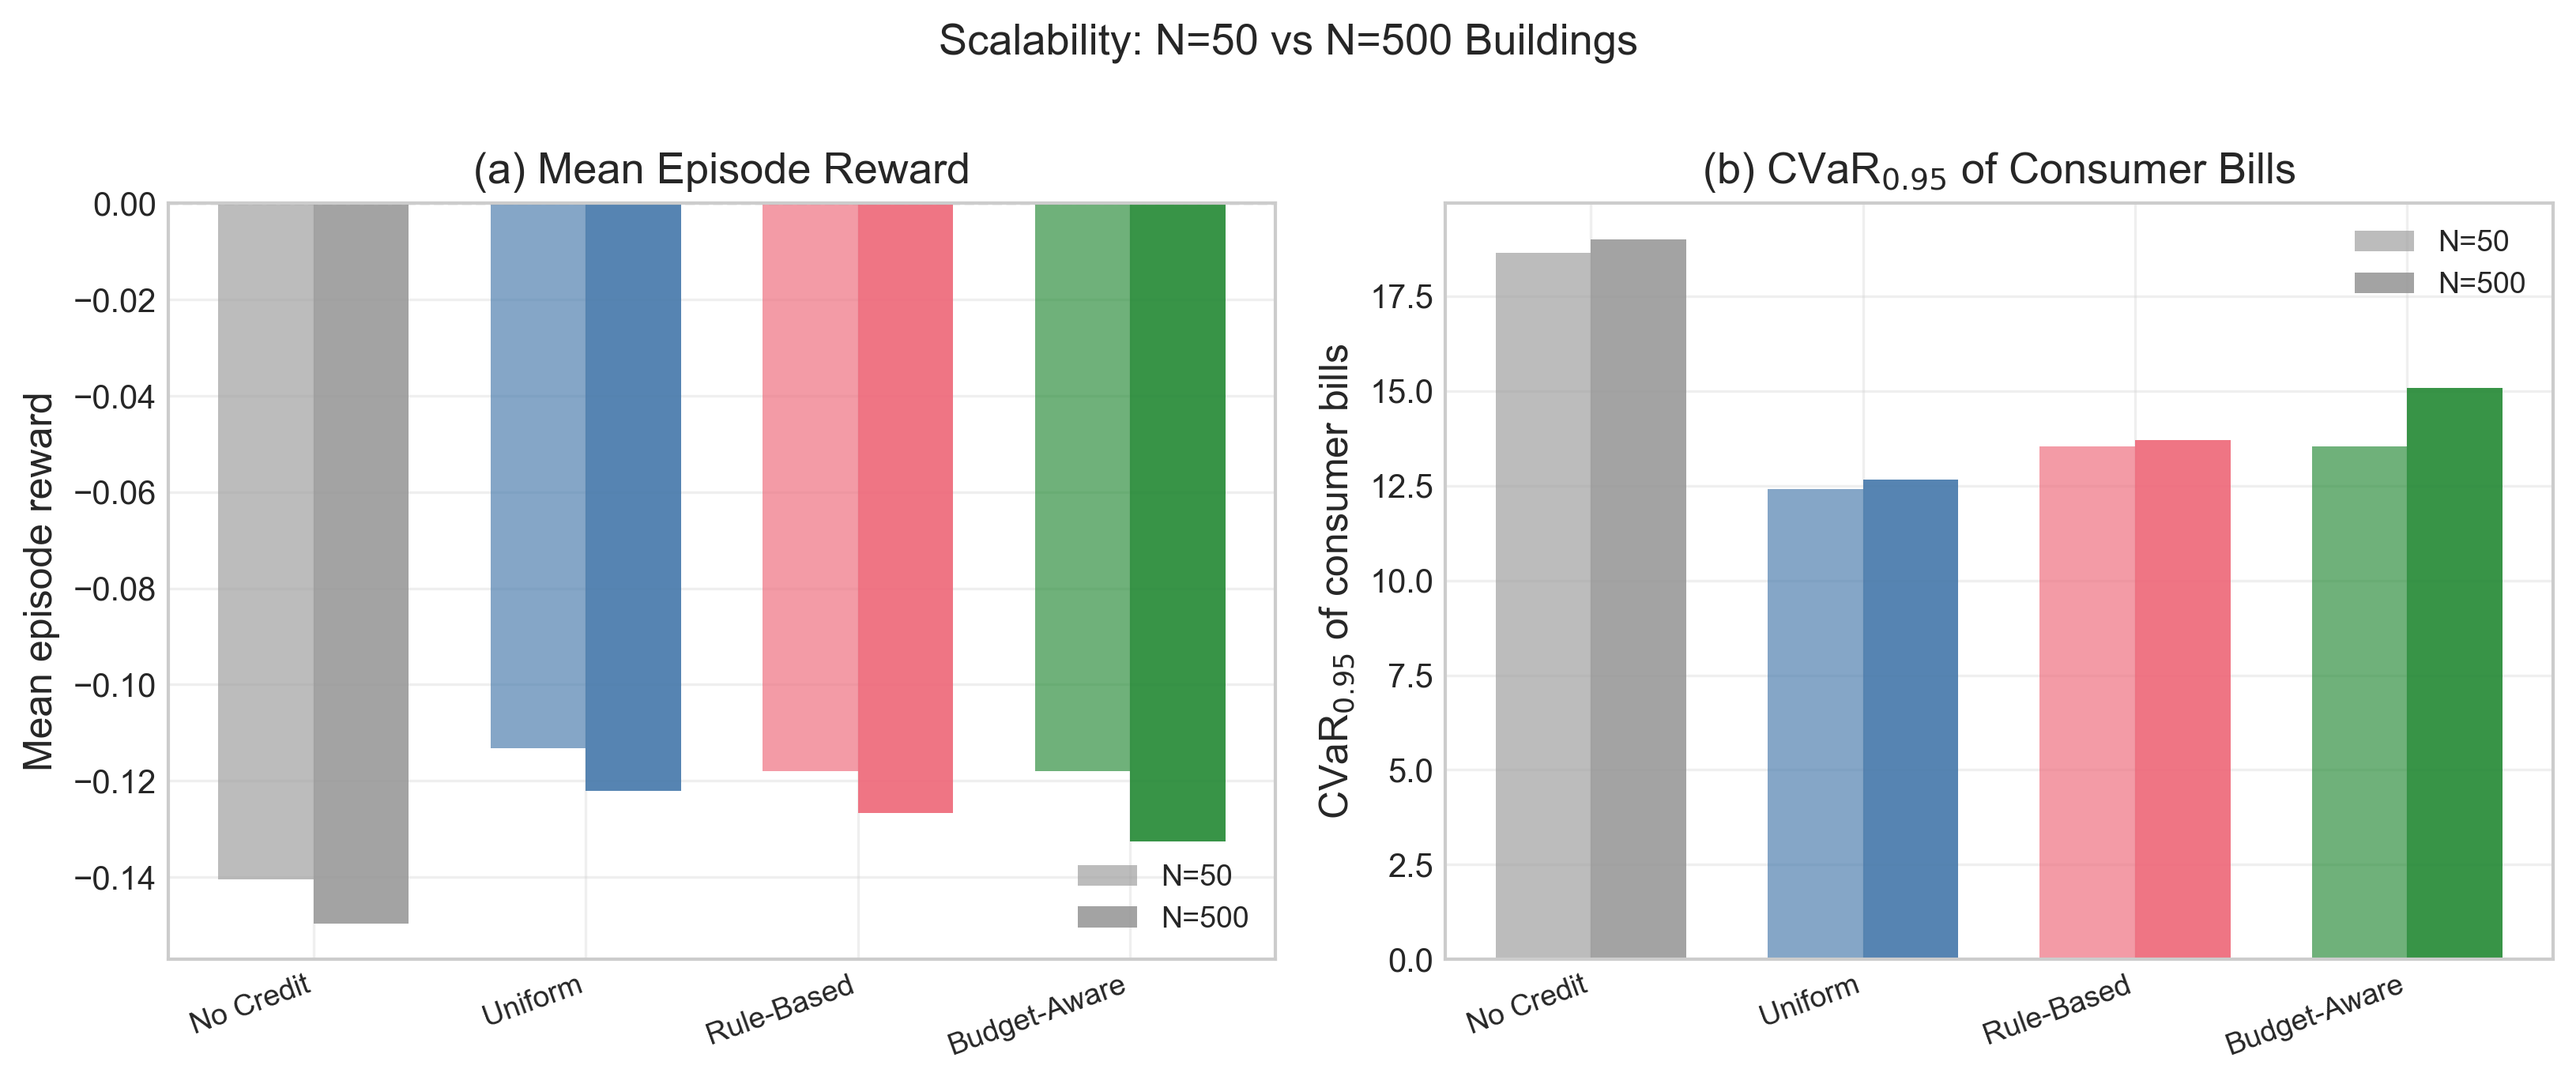
Fig 10: Scalability ablation: baseline policy performance at N = 50 (primary) and N = 500
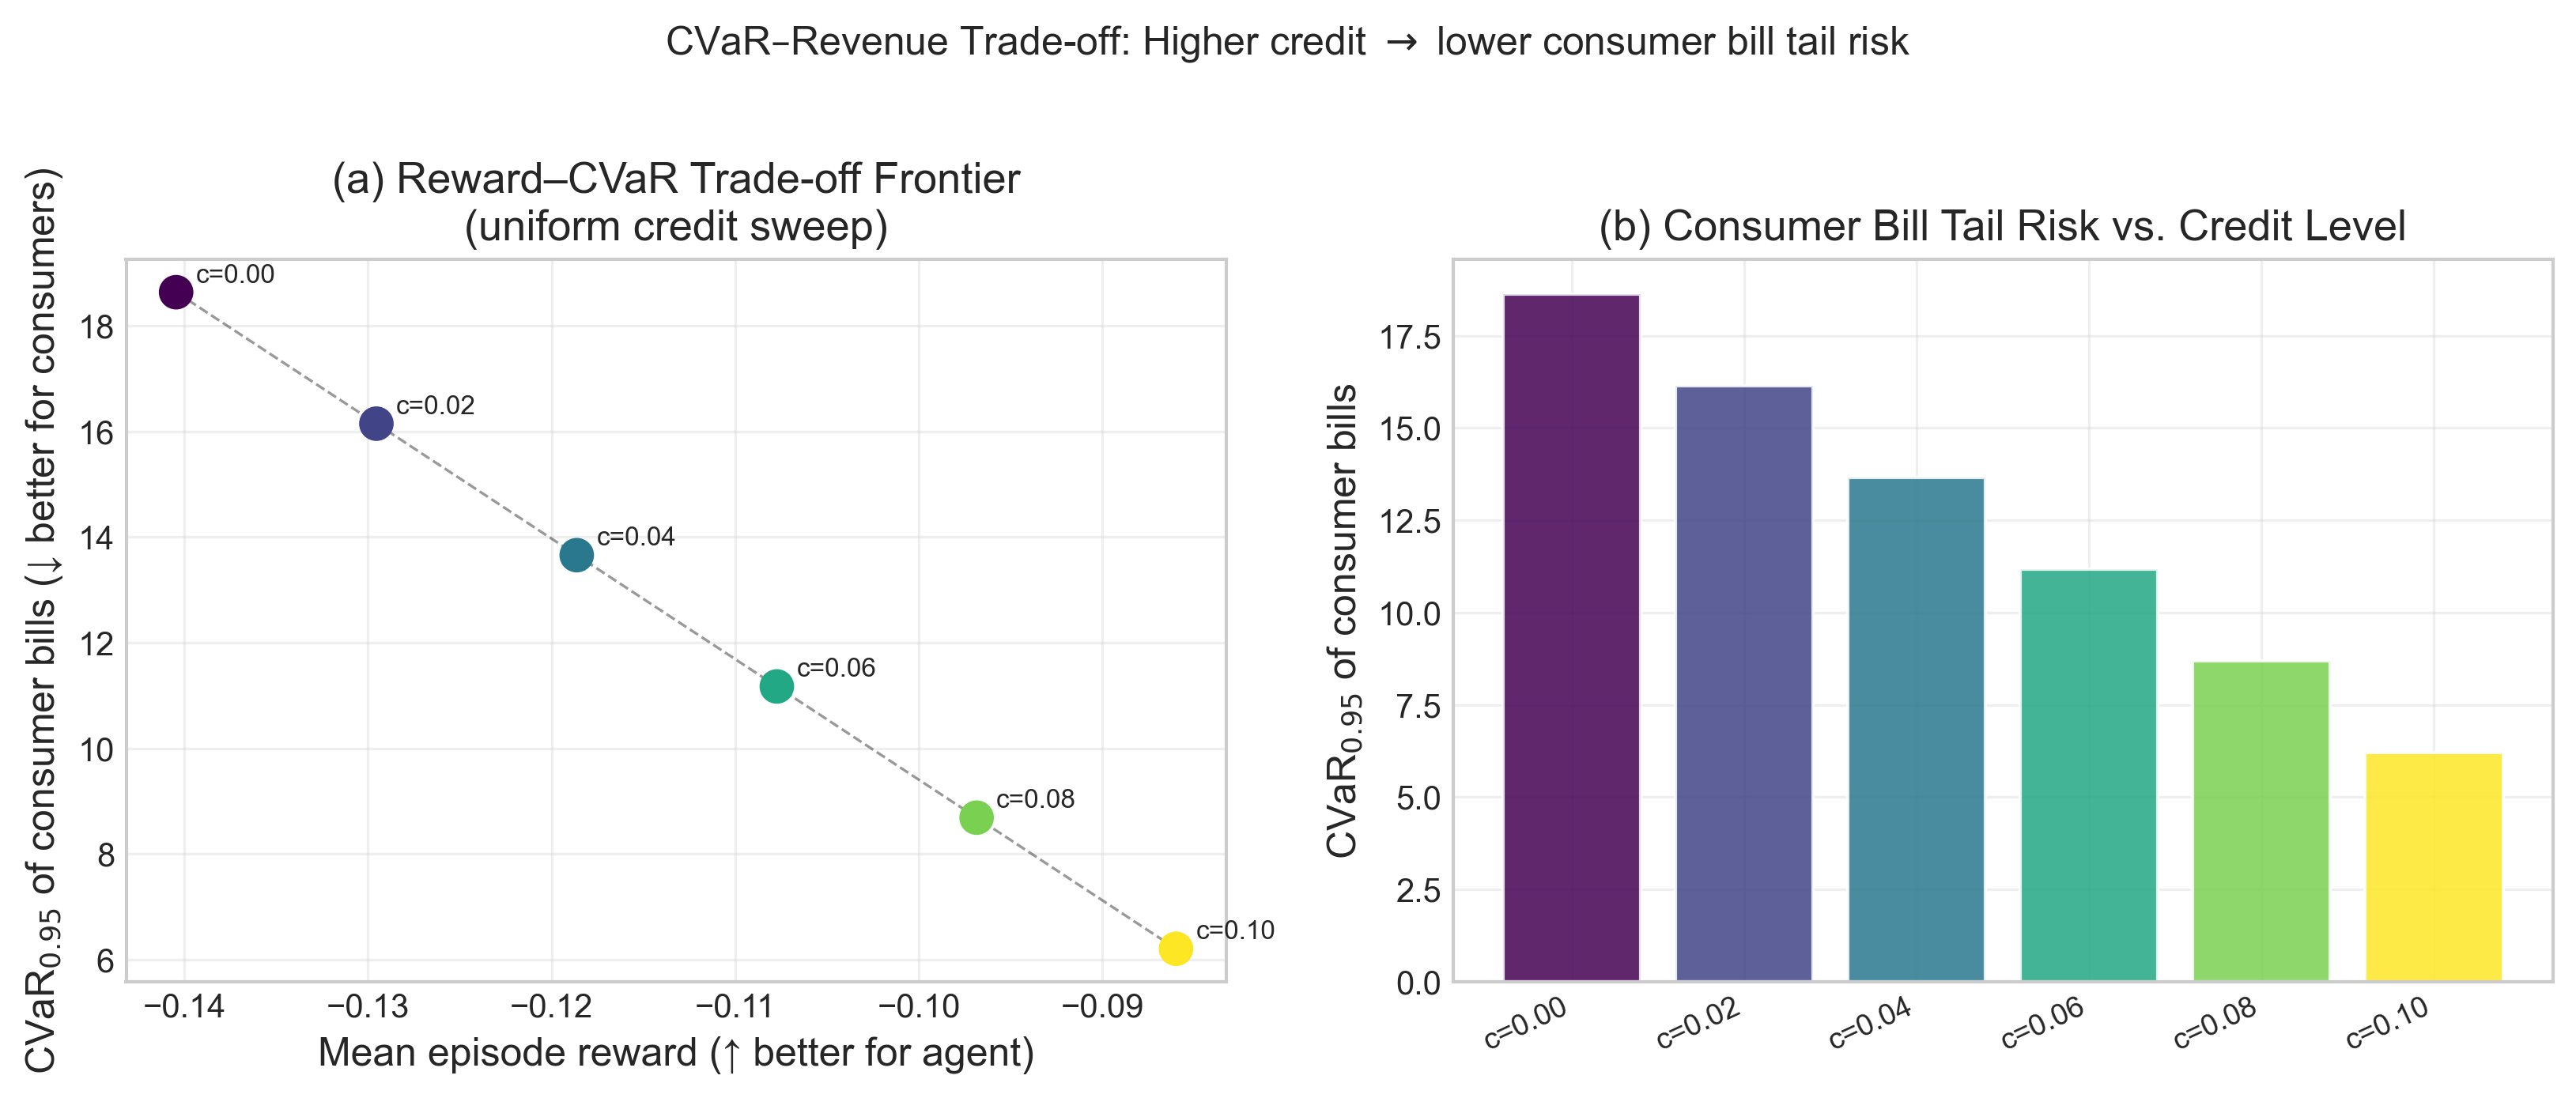
Fig 11: CVaR–reward trade-off analysis.
Limitations
- The core feedback parameters gamma = 0.9 and lambda = 0 are literature-informed defaults, not empirically calibrated to a deployed DR program.
- Customer archetypes are taken from survey ranges rather than fit to a specific utility dataset, so real acceptance heterogeneity may differ.
- The PPO experiments are a proof-of-concept only; the paper does not benchmark dedicated risk-aware algorithms such as CVaR-PPO, WCSAC, or distributional RL.
- Evaluation is on simulated episodes and validation snapshots, not on a real-world held-out utility deployment or prospective field trial.
- The paper reports significance with Welch’s t-test but does not provide confidence intervals, effect sizes, or multi-seed training variance in the excerpted text.
- The optional price-elasticity feedback is disabled by default, so some market interaction effects are only partially explored.
Open questions / follow-ons
- How well do the calibrated acceptance and fatigue parameters transfer to real DR program logs from a specific utility or ISO territory?
- Would risk-aware RL methods like CVaR-PPO or distributional RL learn materially better consumer-tail-risk trade-offs than vanilla PPO under the same simulator?
- How sensitive are the learned policies to the price-spike regime parameters, especially spike entry/exit rates and the temperature boost?
- Can the price-elasticity feedback term be empirically calibrated so that the simulator captures closed-loop market effects from large-scale DR participation?
Why it matters for bot defense
For a bot-defense or CAPTCHA practitioner, the main takeaway is methodological rather than domain-specific: the paper is building a closed-loop environment where actions change the future data distribution. That is directly relevant to anti-abuse systems, because rate limits, challenge difficulty, friction, and risk scoring all feed back into attacker behavior and user fatigue. A static log-replay benchmark would miss those dynamics just as offline historical DR traces miss utility-customer feedback.
If you were designing a bot-defense simulator, this paper is a useful template for separating observable state, action, delayed response, and configurable risk objectives. The key lesson is to make the environment modular enough to swap in different behavioral models and stressors, then evaluate policies not just on average success but on tail risk and budget/fairness-like constraints. For CAPTCHA/abuse mitigation, that suggests benchmarking policies under repeated challenge exposure, user exhaustion, and adversarial adaptation rather than only measuring single-turn solve rates.
Cite
@article{arxiv2605_12462,
  title={ Towards Affordable Energy: A Gymnasium Environment for Electric Utility Demand-Response Programs },
  author={ Jose E. Aguilar Escamilla and Lingdong Zhou and Xiangqi Zhu and Huazheng Wang },
  journal={arXiv preprint arXiv:2605.12462},
  year={ 2026 },
  url={https://arxiv.org/abs/2605.12462}
}