
Survey Footprint Explorer: A Browser-Based Interactive Tool for Visualizing and Cross-Matching Astronomical Survey Footprints
Source: arXiv:2605.11099 · Published 2026-05-11 · By S. L. Ahad, R. Brilenkov, J. E. Taylor
TL;DR
Survey Footprint Explorer is a browser-only application for visualizing and comparing sky coverage regions for major astronomical imaging surveys, and for testing whether catalogued sources fall inside one or more of those footprints. The paper’s core contribution is not a new astronomical algorithm but a practical integration layer: it combines Multi-Order Coverage (MOC) maps, two coordinated sky views, and client-side catalogue augmentation into a zero-install workflow that runs entirely in JavaScript/WebAssembly.
What is new here is the end-to-end workflow in the browser. Users can toggle among 13 built-in survey footprints, inspect overlaps in an interactive globe or a publication-style equirectangular map, upload their own MOC files, and augment CSV/TSV source catalogues with per-survey boolean membership columns. The authors emphasize that all intersection and membership computations happen locally in the browser via a WebAssembly-compiled Rust MOC engine. The reported result is primarily usability and capability: the tool supports sub-second overlap and membership calculations on tens of thousands of sources, and the current distributed footprint set has substantial overlap, with a summed area of 80,880.1 deg^2 but only 34,104.7 deg^2 union coverage.
Key findings
- The v2.5.0 footprint set includes 13 built-in surveys spanning X-ray to near-infrared, with exact MOC-defined areas ranging from 7.7 deg^2 (Roman HLTDS Deep) to 21,524.4 deg^2 (eRASS1).
- The paper reports 80,880.1 deg^2 as the sum of the individual survey areas, but only 34,104.7 deg^2 as the union coverage, showing extensive overlap among the included surveys.
- All overlap-area and per-source membership tests are computed client-side in a WebAssembly-compiled Rust MOC engine; no server computation is used for the core workflow.
- For a catalogue of 50,000 sources, the membership computation and CSV download complete in under two seconds on a typical laptop browser (Section 5.2, Fig. 3).
- The application supports both an Aladin Lite v2 globe and an SVG equirectangular projection, and the latter can be exported directly as a PDF from the browser.
- The tool can ingest CSV or TSV catalogues with case-insensitive ra/dec column detection and several fuzzy column-name variants such as radeg, decl, and declination.
- Custom user-supplied MOC FITS files participate in the same intersection and catalogue-membership pipeline as built-in survey footprints.
- The MOC files are stored in NUNIQ encoding with pre_v2=True, and survey orders are kept in the range 7–9, corresponding to roughly 28–7 arcmin pixel scales.
Threat model
The implicit user-facing threat model is benign local analysis: an astronomer wants to inspect survey footprints and cross-match catalogue positions without transmitting sensitive or proprietary data to a remote server. The application assumes a modern browser and no network access for core computation. It does not consider malicious catalogue content, adversarially crafted MOCs, or an active network attacker beyond the general benefit of avoiding server-side data upload. Because the system is browser-local, the main thing it cannot do is provide centralized multi-user computation or authoritative server-backed provenance checks for uploaded inputs.
Methodology — deep read
The paper is a software/system description rather than an empirical machine-learning study, so the relevant threat model is a local analysis user who wants to cross-match survey coverage and source coordinates without uploading data to a server. The core assumption is that the user has a modern browser and may have local CSV/TSV catalogues or MOC FITS footprints. There is no adversarial model in the security sense; instead, the key design constraint is zero-install usability and local privacy. The application explicitly keeps user catalogue data and any uploaded custom MOC only in the browser, optionally persisting state to localStorage on the same device. The system is meant to support astronomers doing survey-combination planning, footprint comparison, and target vetting.
The data layer is a curated set of 13 survey footprints encoded as MOC maps, each derived from a publicly available source product or published footprint definition. The paper distinguishes how each footprint was built: for example, KiDS is derived from KiDS-N and KiDS-S science-quality binary masks at 1 arcmin pixels; Euclid DR1 comes from the DR1 input HEALPix coverage map; HSC is assembled from rectangular field definitions in the LAMBDA footprint file; DES uses the DES polygon boundary from LAMBDA; UNIONS uses a released HEALPix footprint map in ugriz bands; DESI Legacy DR9 uses the current brick-union ingestion workflow; eRASS1 uses the SRG/eROSITA first all-sky survey tile catalogue; LSST WFD uses the Rubin scheduler area map with low-dust and Virgo regions; Roman HLWAS and HLTDS use project-local tiling models / ROTAC-approved tiling plans; and ACT Legacy is the union of the ACT EQU and South survey regions. Table 1 gives the exact distributed MOC areas and their citation sources. The paper is careful to note that these areas are definition-dependent and reflect the specific products distributed with the application rather than universal canonical survey extents.
Algorithmically, the application stores footprints as MOC FITS files using NUNIQ encoding and the pre_v2=True flag for compatibility with Aladin Lite v2. The authors use HEALPix-based MOC operations for exact set arithmetic on sky regions. The central engine is a WebAssembly-compiled Rust MOC library, which performs union, intersection, difference, overlap-area computation, and point-in-footprint testing in the browser. On the UI side, the tool has two synchronized visualizations: (1) an interactive sky globe through Aladin Lite v2, which natively renders MOC overlays on a canvas; and (2) a full-sky equirectangular SVG rendered with D3.js, where survey footprints are drawn from precomputed GeoJSON files rather than parsing FITS in the browser for that projection. A notable small implementation detail is the invisible “anchor moc” kept in the Aladin view so the widget does not collapse when no survey is selected.
The training regime section is not applicable because this is not a learned model. The closest analog is the implementation pipeline: footprints were generated offline from masks, polygons, and pointing lists using mocpy and HEALPix operations, then distributed as static assets. The frontend is vanilla JavaScript ES2022 modules with no build chain, bundler, or transpiler, and depends on Aladin Lite v2, D3.js v7, jsPDF 2.5, and jQuery 3.7 (for Aladin’s DOM event handling). The paper does not describe benchmarks, seeds, or hyperparameters because there is no stochastic training process. The only performance claim is operational: client-side intersection and membership checks are sub-second for overlaps, and a 50,000-row catalogue can be processed and downloaded in under two seconds on a typical laptop browser.
Evaluation is demonstrated through three worked use cases rather than a formal benchmark suite. Use Case A selects Euclid DR1, LSST WFD, and Roman HLWAS to quantify their common area and visualize the shared region in the two projections; the cross-match-only mode greys out the individual footprints and highlights only the intersection. Use Case B uploads a CSV catalogue with RA_deg and DEC_deg columns, detects coordinate columns, plots the sources, and appends boolean columns such as in_euclid_dr1, in_lsst_wfd, and in_roman_hlwas after running filterCoos() on the selected MOCs; the example states that 50,000 sources finish in under two seconds. Use Case C uploads a custom MOC FITS footprint and uses the same overlap and membership machinery against built-in surveys. There are no statistical tests, no cross-validation, and no comparison against a quantitative baseline in the paper; the evidence is qualitative UI demonstration plus one runtime example and the footprint summary in Table 1 / the summary section. Reproducibility is reasonably strong at the software level because the paper names the external libraries, the MOC encoding choice, and the public live application URL, but it does not provide a code repository snapshot, frozen release artifacts, or a benchmark dataset for the catalogue example.
Technical innovations
- A fully client-side MOC intersection and membership pipeline compiled from Rust to WebAssembly, replacing the usual server-side or local-Python workflow.
- A dual-projection footprint viewer that couples Aladin Lite v2’s interactive globe with a publication-ready equirectangular SVG map in a single-page app.
- Browser-side catalogue augmentation that detects RA/Dec columns, tests membership against selected survey MOCs, and exports a CSV with per-survey boolean flags.
- Support for user-uploaded FITS MOC footprints as first-class regions that participate in the same overlap and source-membership operations as built-in surveys.
Datasets
- Euclid DR1 footprint map — 1 MOC coverage map — public Euclid DR1 input HEALPix coverage map
- LSST WFD area map — 1 MOC coverage map — Rubin scheduler area map
- Roman HLWAS tiling plan — 88 pointings total, split into 5,314.0 deg^2 wide+medium and 35.6 deg^2 deep tiers — public RomanHLWASTools / ROTAC-approved tiling plan
- Roman HLTDS pointing model — 88 pointings total, 28.1 deg^2 full and 7.7 deg^2 deep — Roman user documentation / public community-defined surveys
- DESI Legacy Imaging DR9 brick-union product — 20,813.1 deg^2 — project-local ingestion workflow
- eRASS1 sky tile catalogue — 21,524.4 deg^2 — SRG/eROSITA first all-sky survey tile catalogue
- UNIONS released HEALPix footprint map — 6,194.2 deg^2 — public ugriz footprint map
- ACT EQU and South released hit maps — 11,245.0 deg^2 — LAMBDA Footprint Library / released 148 GHz HEALPix hit maps
Figures from the paper
Figures are reproduced from the source paper for academic discussion. Original copyright: the paper authors. See arXiv:2605.11099.
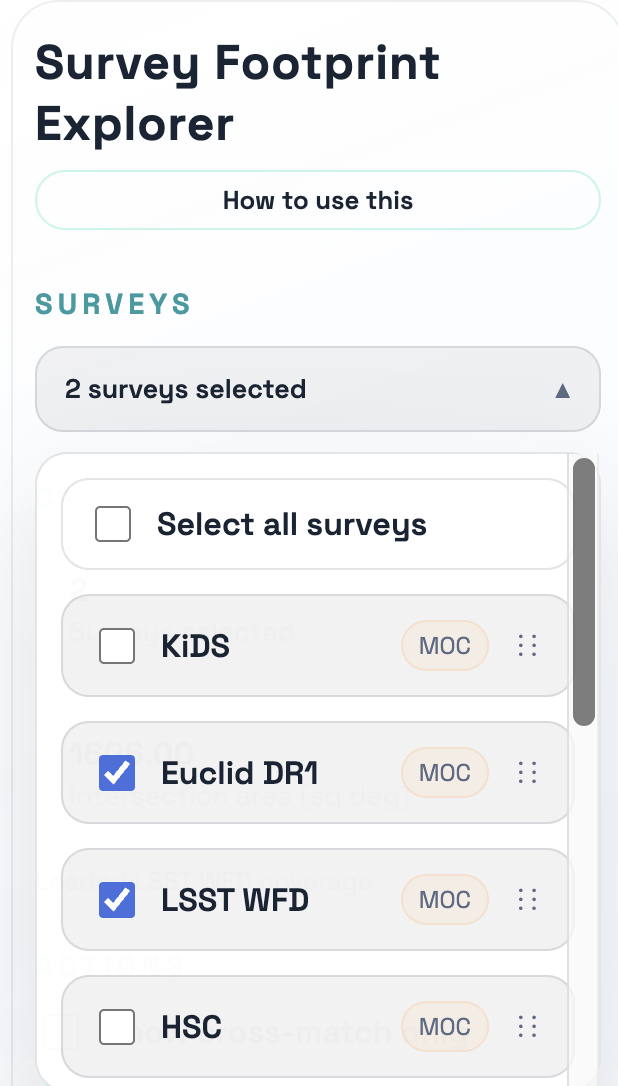
Fig 1: Survey selection.
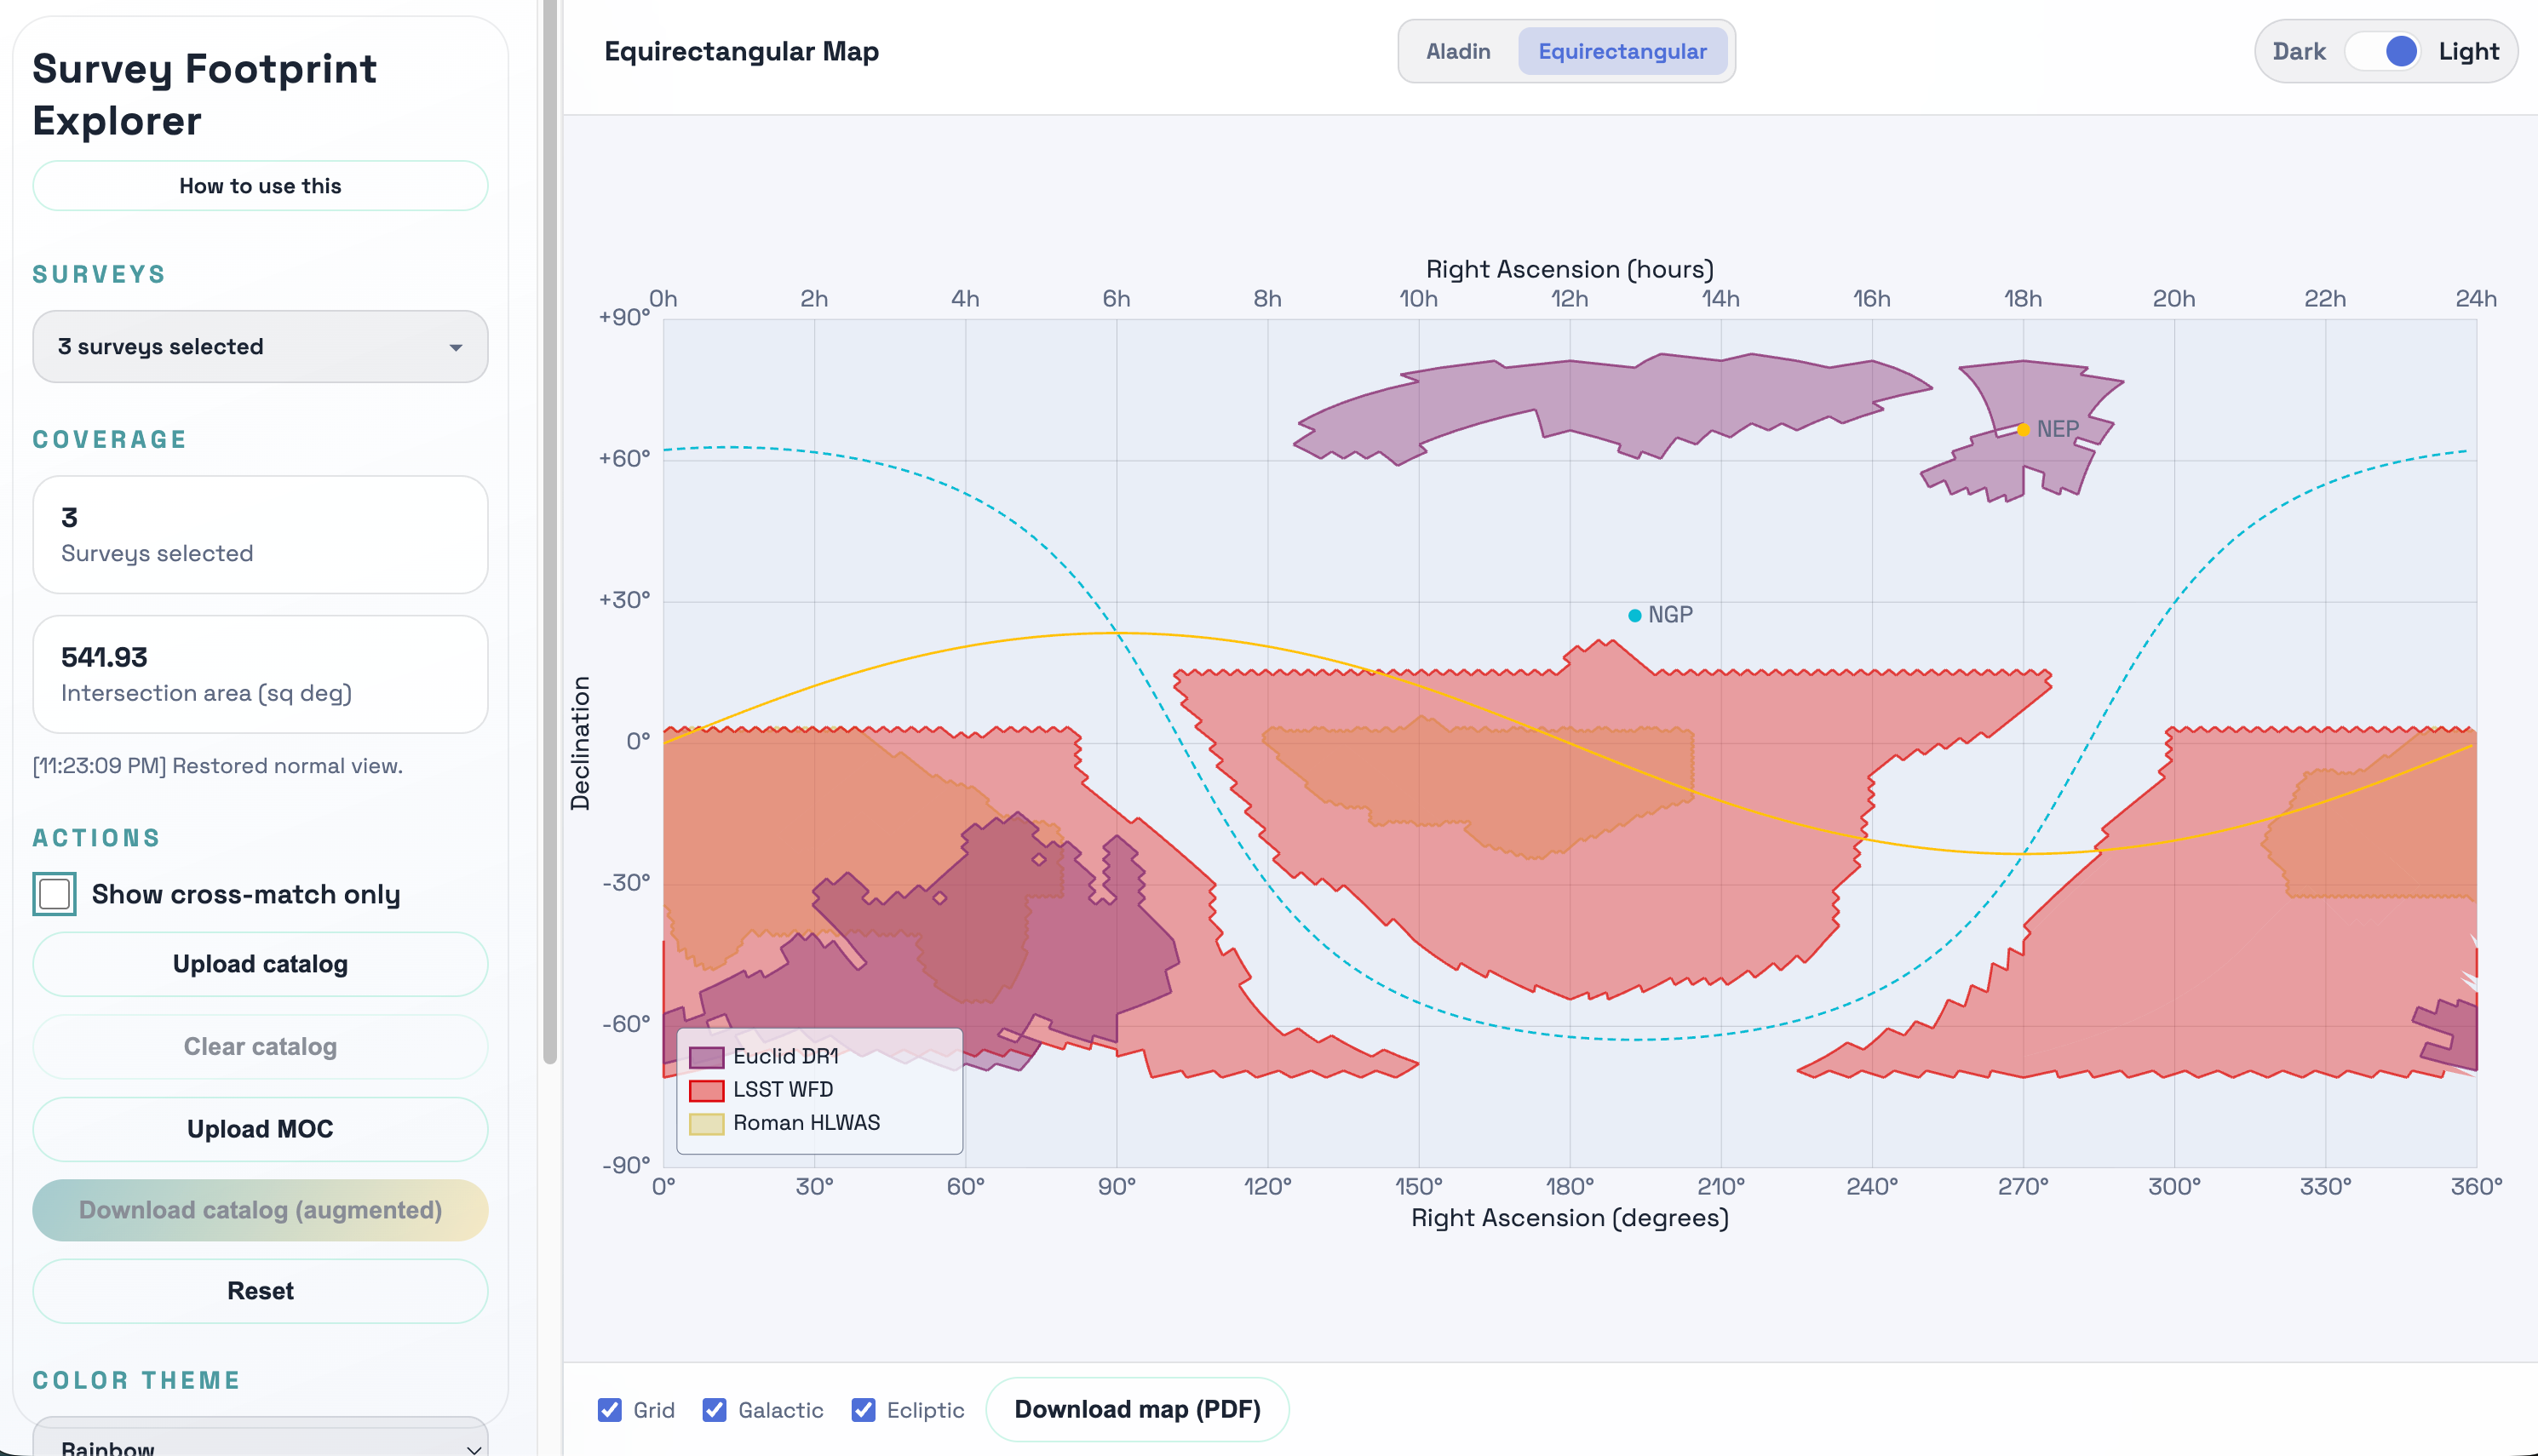
Fig 2: Use Case A: overlap quantification across Euclid DR1, LSST WFD, and Roman HLWAS.
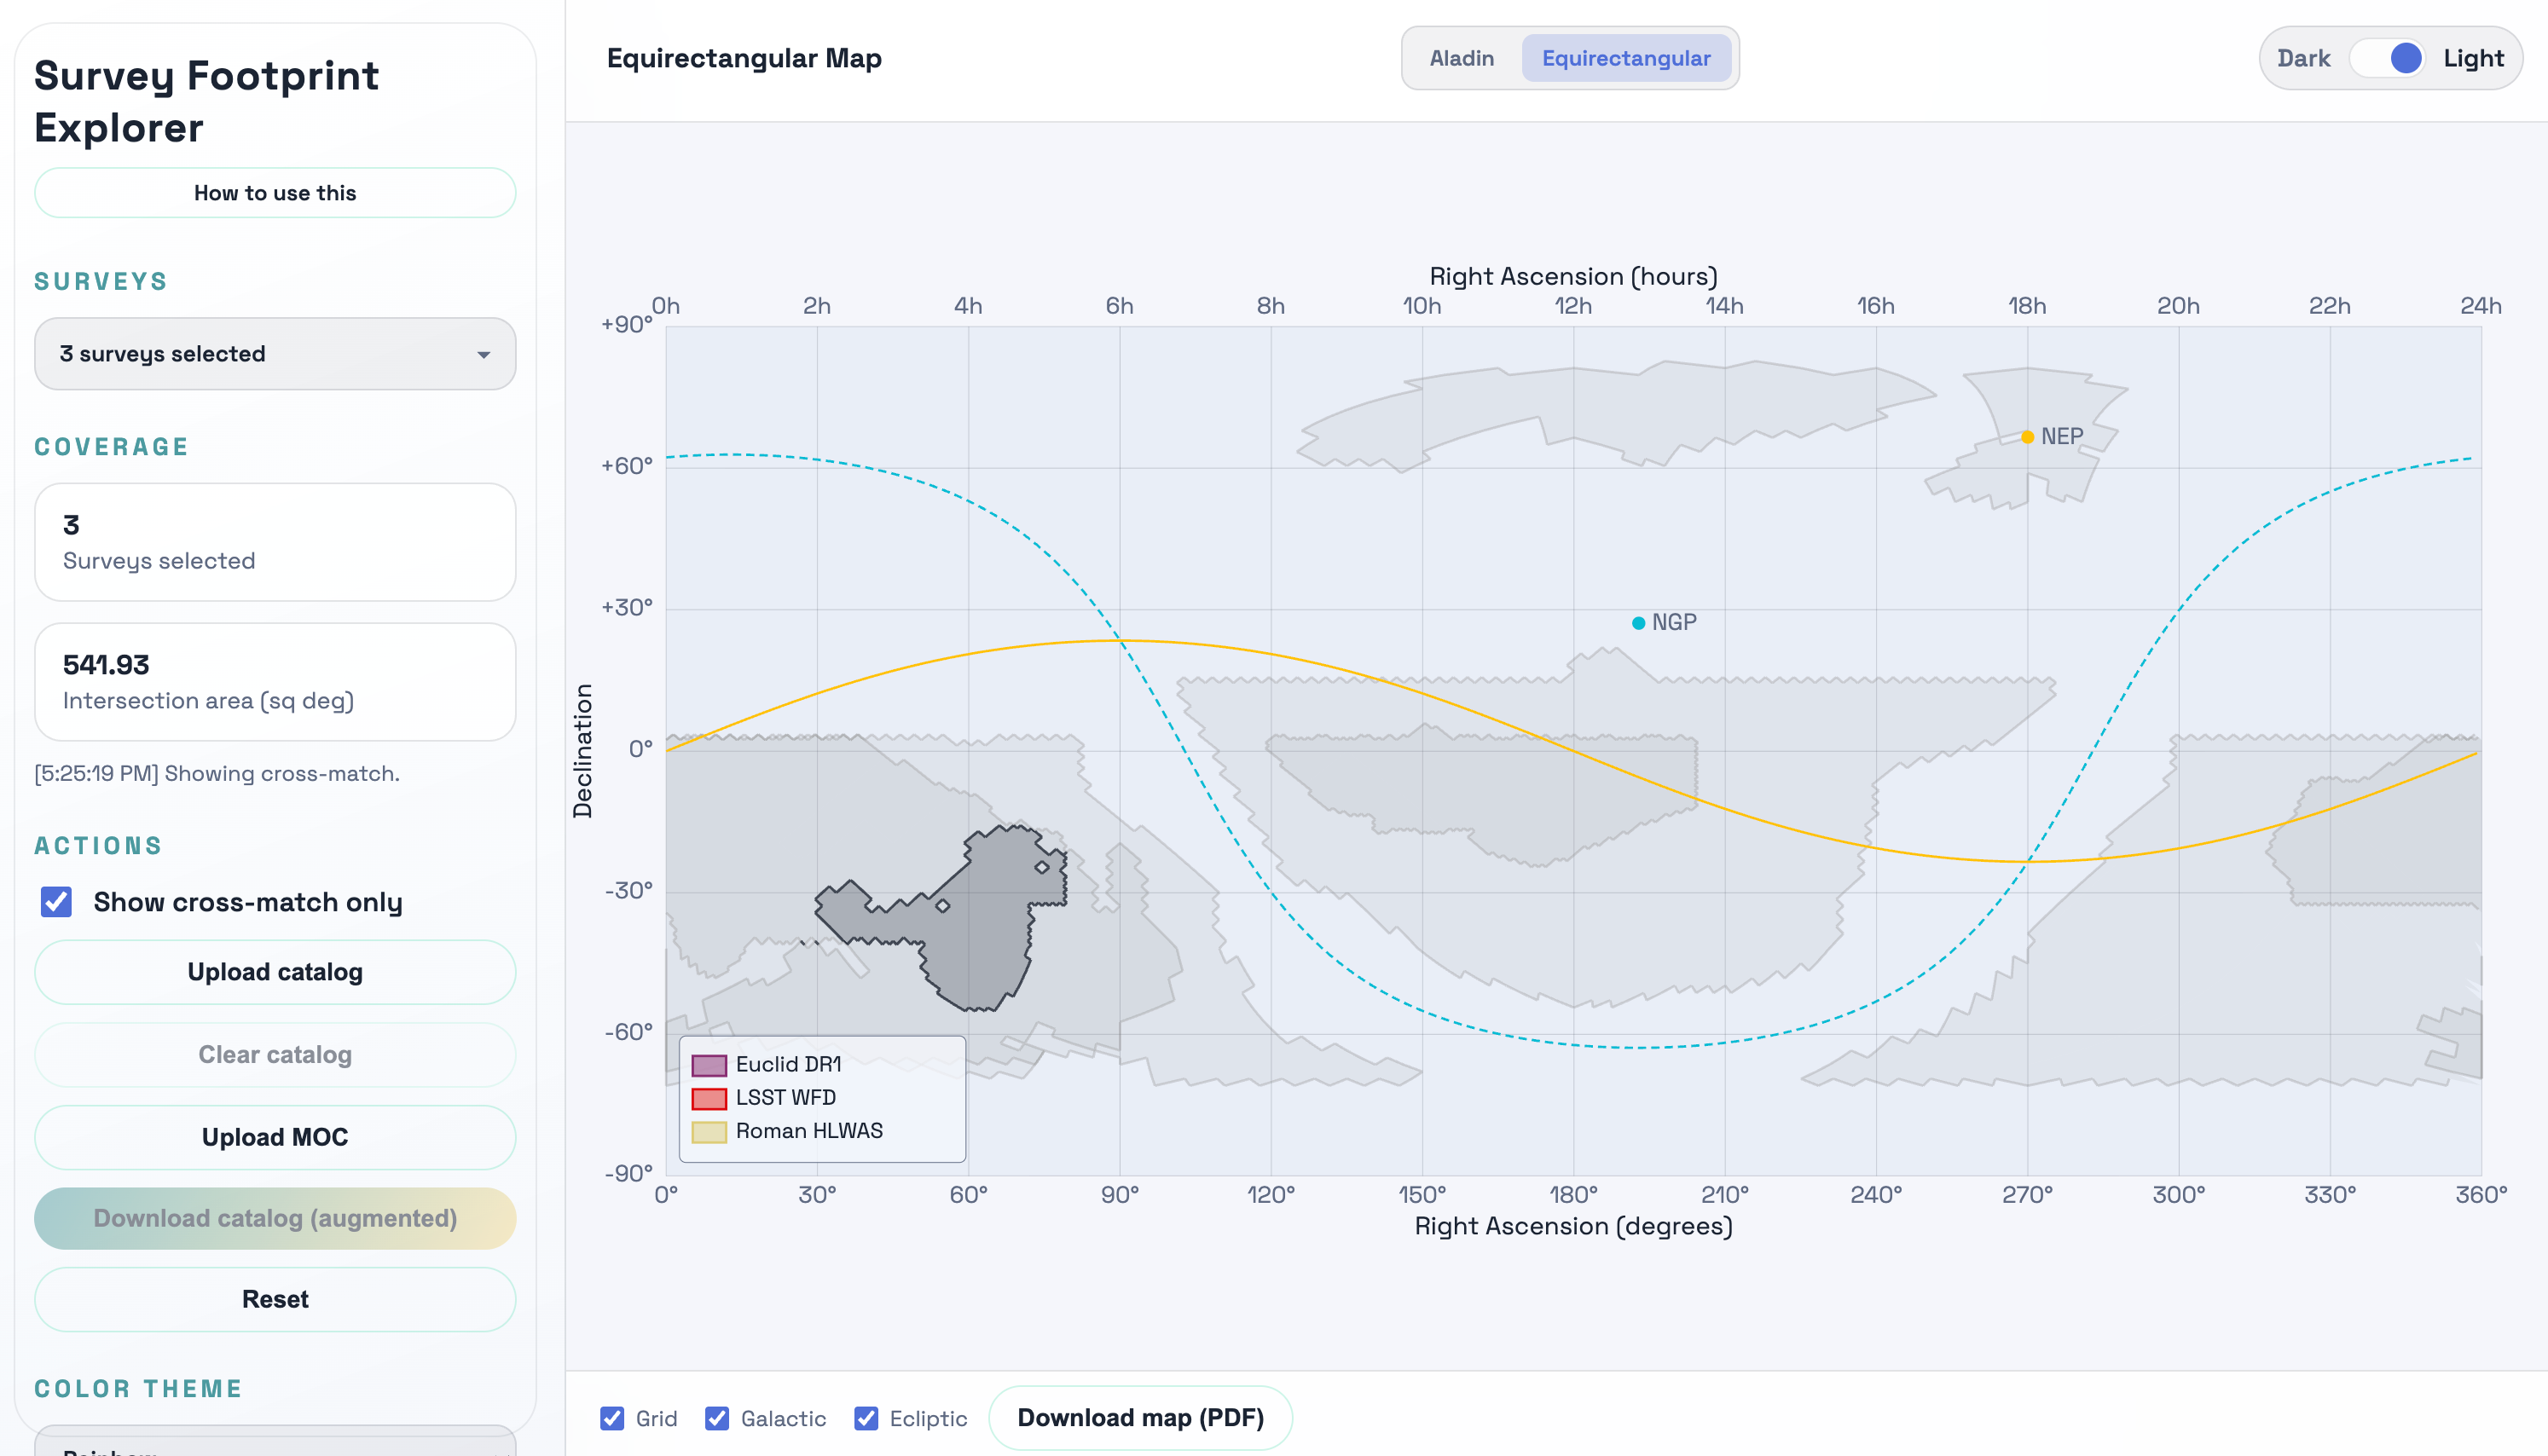
Fig 3: Use Case B: source-catalogue membership analysis. App-oriented view of catalogue upload and
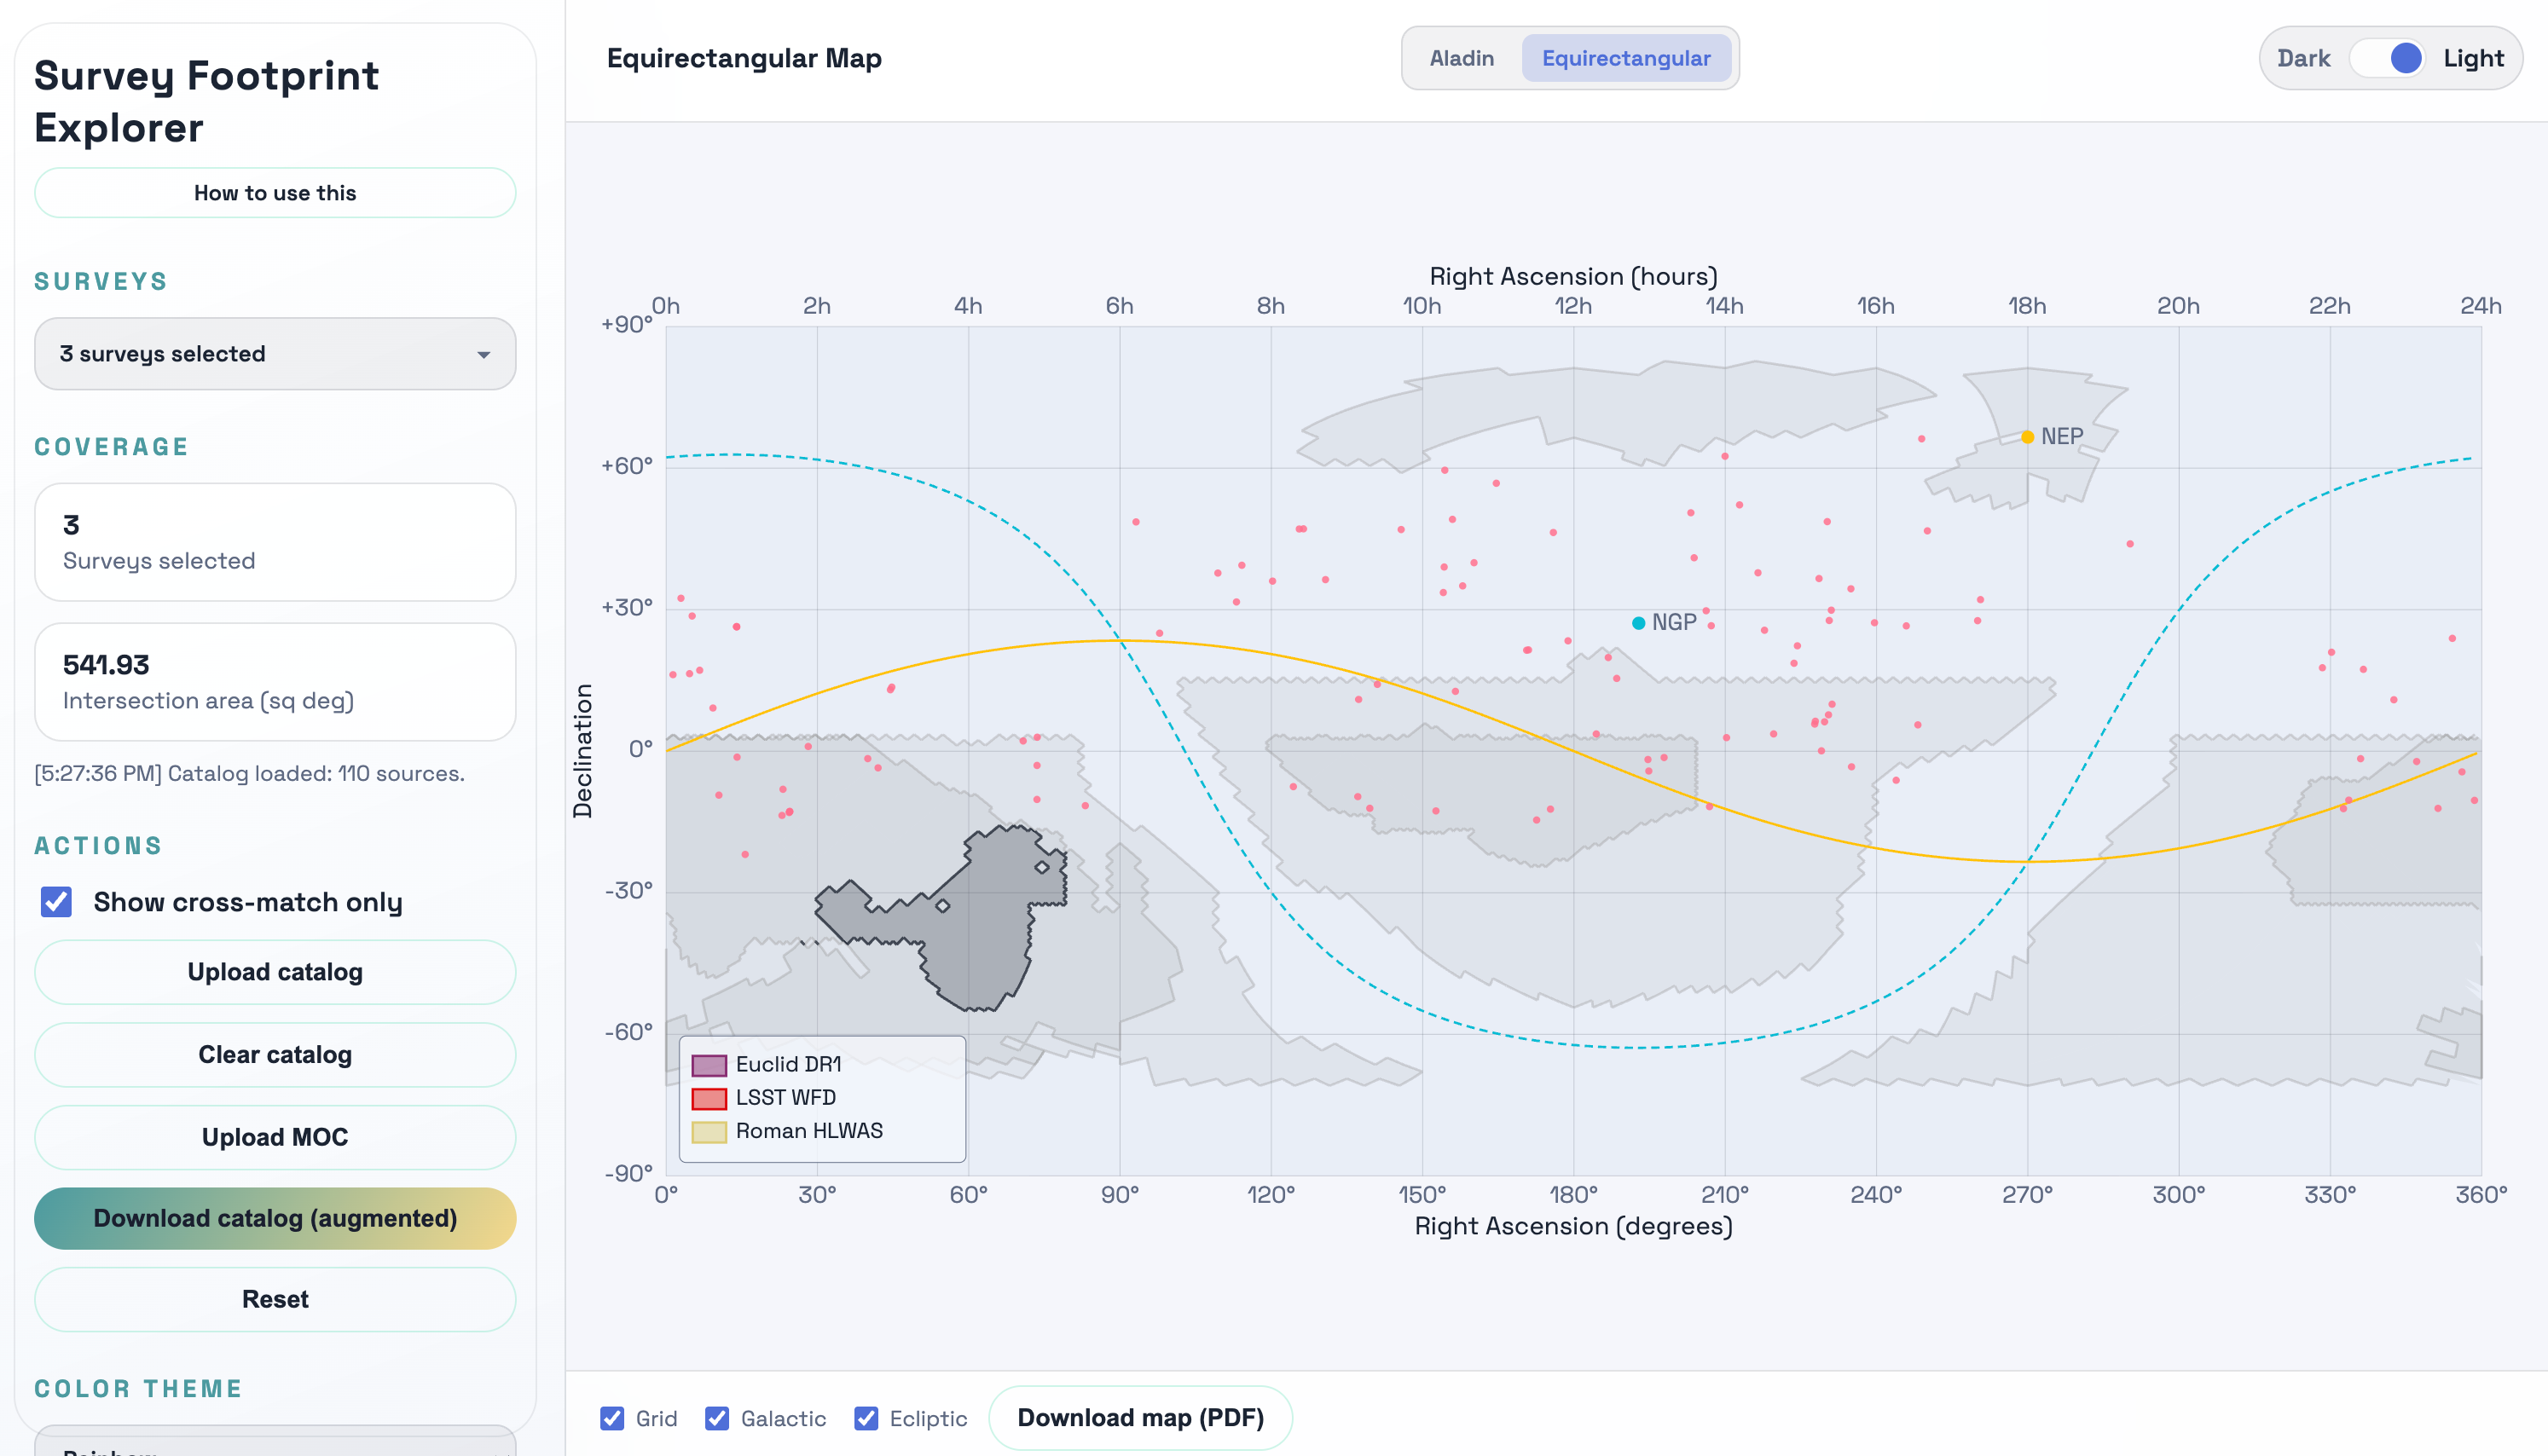
Fig 4: Use Case C: overlap quantification across Euclid DR1, LSST WFD, and a custom moc region.
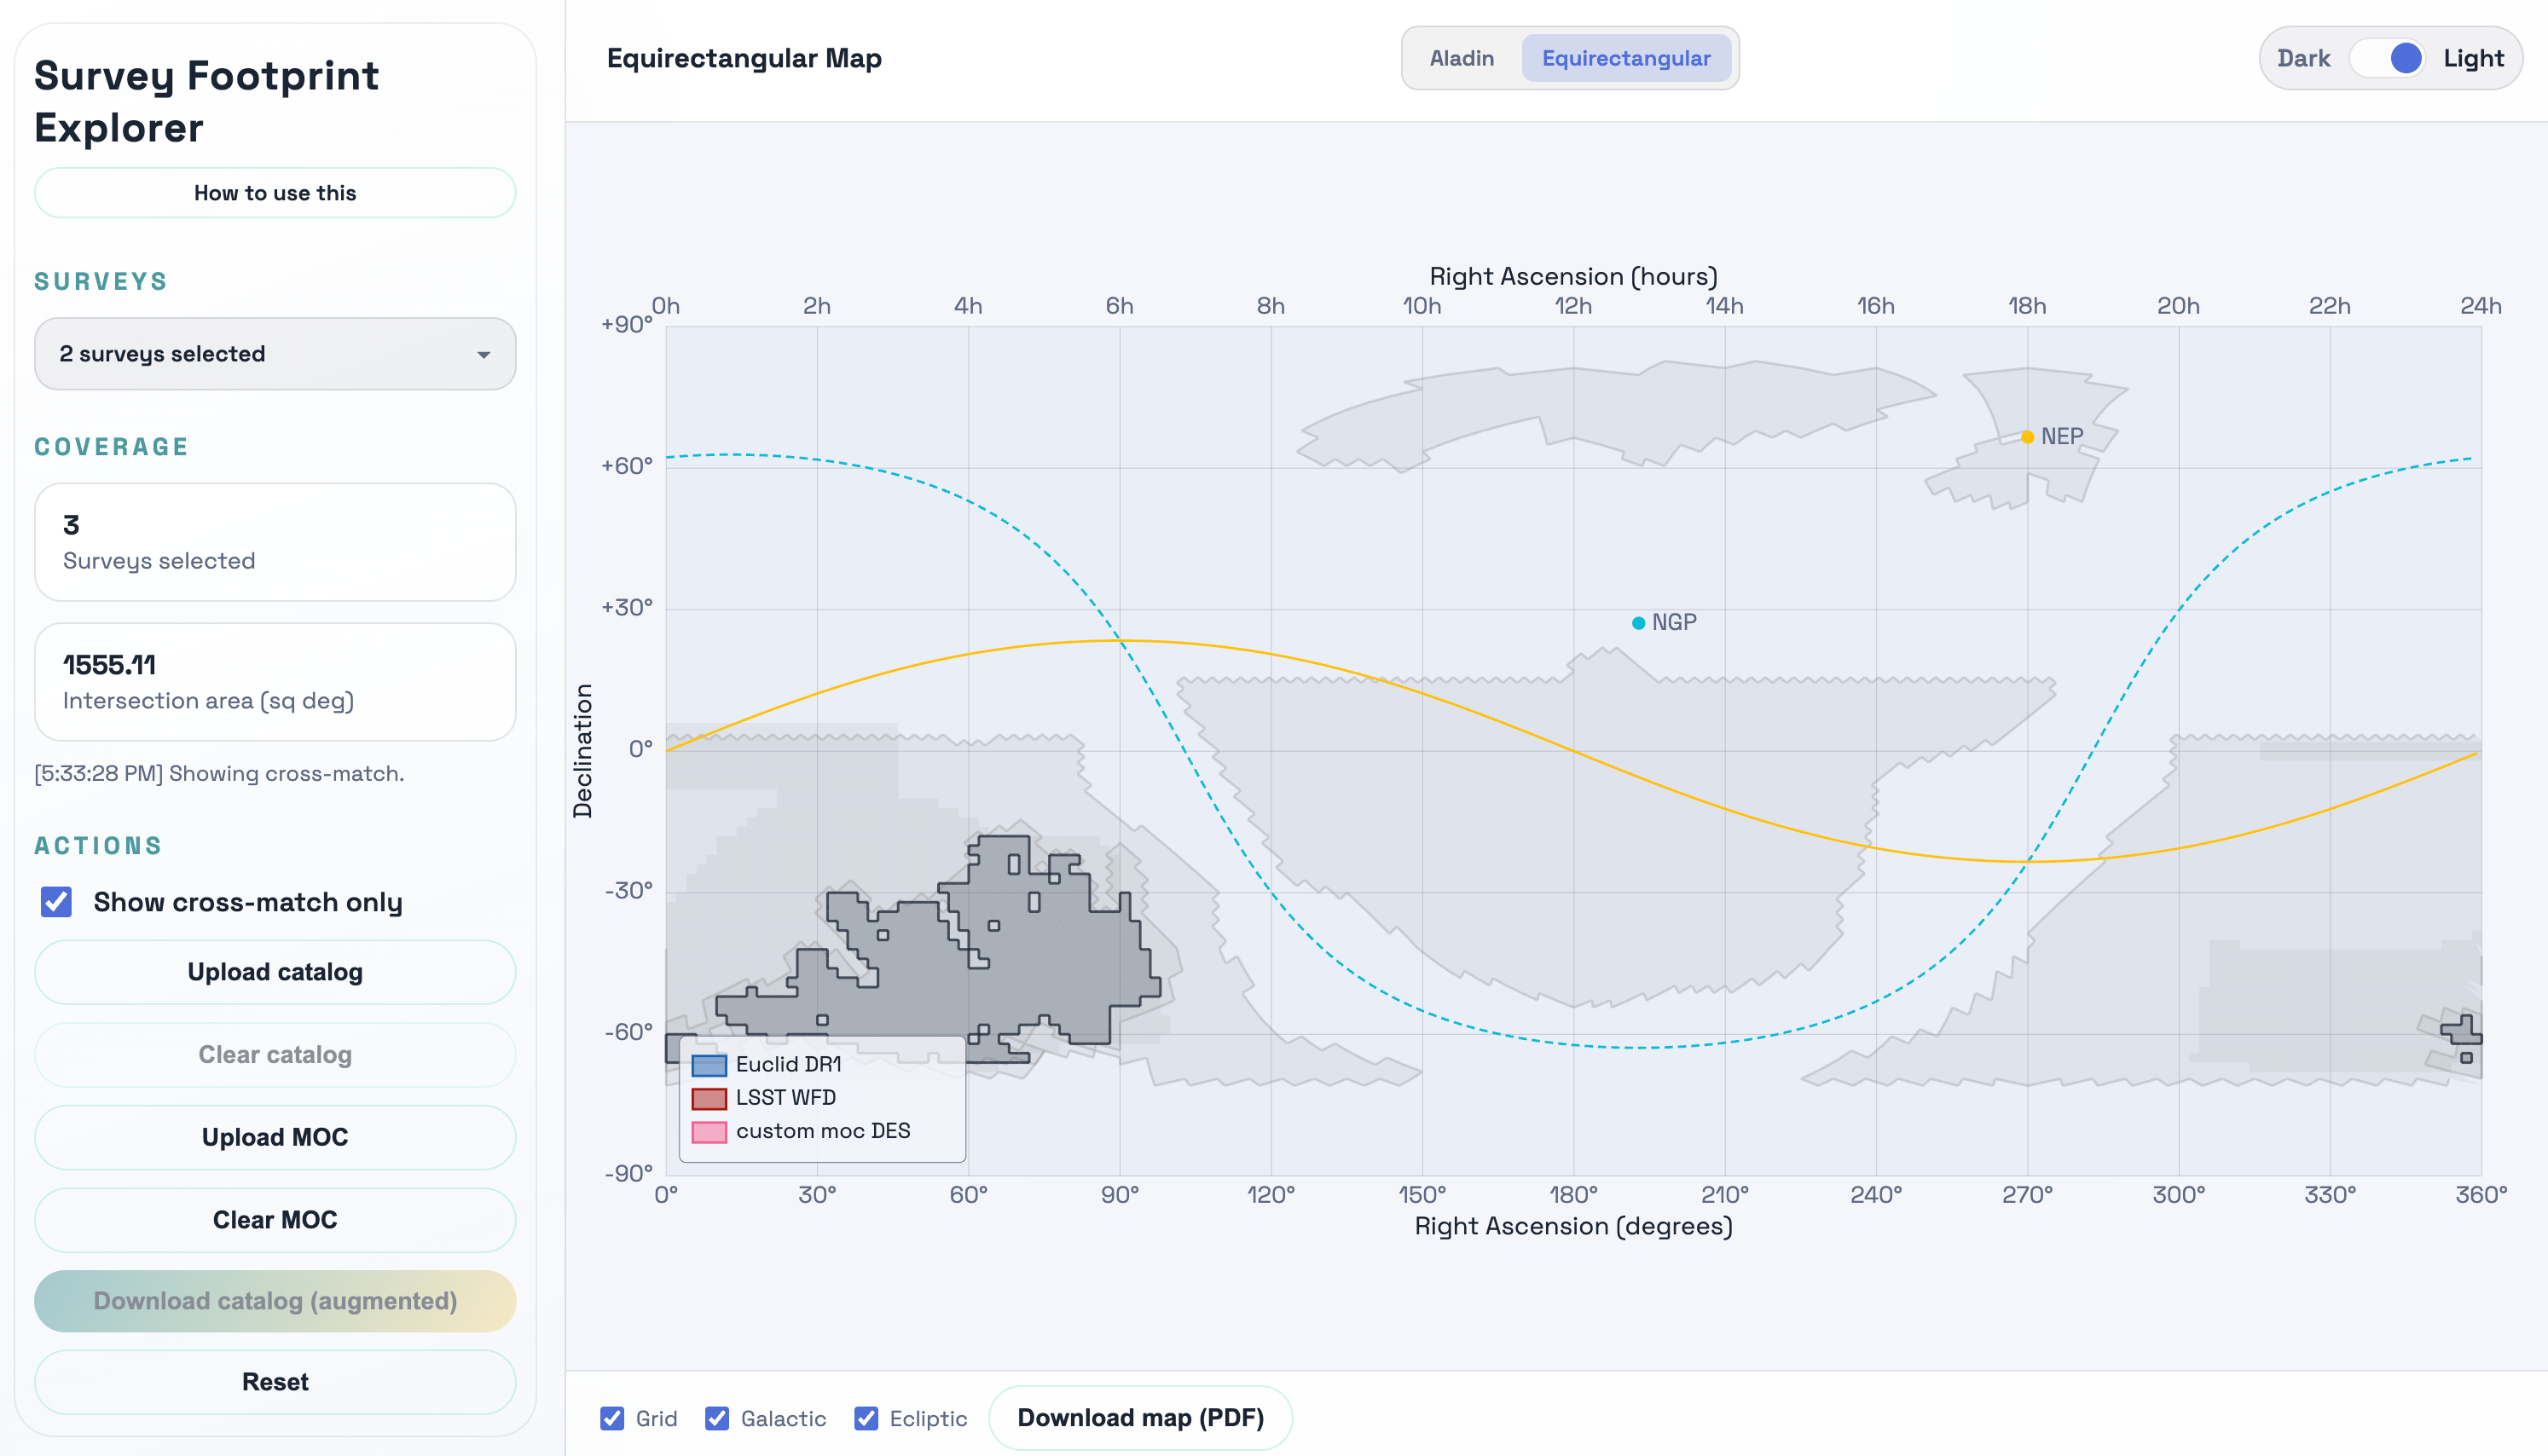
Fig 5 (page 8).
Limitations
- This is a software paper, so there is no formal benchmark suite comparing runtime, memory, or accuracy against alternative tools such as TOPCAT, mocpy scripts, or Aladin Desktop.
- The only explicit performance claim is one example: 50,000-source membership plus CSV download in under two seconds on a typical laptop browser; no hardware spec, variance, or repeated timing methodology is given.
- Several footprint definitions are project-local or definition-dependent rather than canonical survey-wide boundaries, especially LSST WFD, DESI Legacy DR9, Roman HLWAS, Roman HLTDS, and ACT Legacy.
- The paper does not quantify numerical correctness of overlap areas against an independent reference implementation, nor does it report error tolerance for edge cases near footprint boundaries.
- The catalogue example assumes RA/Dec columns are well-formed; fuzzy matching helps, but there is no discussion of malformed coordinates, non-standard frames, or proper-motion/epoch handling.
- Session persistence via localStorage is convenient, but the paper does not discuss browser storage limits, privacy implications on shared machines, or behavior with very large uploaded catalogues.
Open questions / follow-ons
- How well does the browser-side MOC engine scale beyond 50,000 sources and beyond the current 13 footprints, especially when multiple large custom MOCs are uploaded simultaneously?
- What is the numerical agreement between the distributed MOC products and independent footprint definitions, particularly for ambiguous surveys like LSST WFD or Roman HLTDS where the footprint definition is still evolving?
- Can the tool be extended to support non-point source geometry, uncertainty buffers, or time-dependent footprints without losing the current zero-install browser-only property?
- Would a formal usability study show that the dual-view interface and cross-match-only mode reduce errors or time-to-answer relative to existing tools like Aladin Desktop or TOPCAT?
Why it matters for bot defense
For a bot-defense engineer, the main takeaway is architectural rather than domain-specific: the paper shows how far a modern browser-only tool can go when heavy computation is pushed into WebAssembly and the UI is built around a compact, exact geometry representation. That pattern is relevant to CAPTCHA and abuse-detection systems that need local or edge-side verification, especially when you want low latency, no backend round trip, and minimal data egress. The paper also illustrates a useful separation: visual inspection in one projection and exact set membership in the same client session. In CAPTCHA-like workflows, that separation can map to human-auditable challenge rendering plus deterministic local validation. The caution is that this paper does not address adversarial misuse, so a security engineer should not treat its privacy or correctness claims as sufficient for hostile settings without additional hardening, input validation, and tamper resistance.
Cite
@article{arxiv2605_11099,
  title={ Survey Footprint Explorer: A Browser-Based Interactive Tool for Visualizing and Cross-Matching Astronomical Survey Footprints },
  author={ S. L. Ahad and R. Brilenkov and J. E. Taylor },
  journal={arXiv preprint arXiv:2605.11099},
  year={ 2026 },
  url={https://arxiv.org/abs/2605.11099}
}