
Interactively visualizing biological multilayer networks using MiRA
Source: arXiv:2605.09597 · Published 2026-05-10 · By Shir Miryam Nehoray, Yuval Bloch, Shai Pilosof
TL;DR
MiRA is a browser-based visualization tool for biological multilayer networks, aimed at a gap the authors see between strong multilayer analysis methods and weak interactive visualization support. The core problem is not inference but sensemaking: multilayer biological data are hard to explore because they combine within-layer topology, interlayer coupling, node identity across layers, and sometimes spatial context. The paper positions MiRA as a practical, installation-free web app that lets users inspect these structures interactively without needing R programming, desktop software, or static figures.
What is new here is the combination of seven coordinated visualization modes in a static JavaScript application: 3D stacked network view, geographic map view, layer-bubble view, grid view, aggregated meta-network view, dashboard statistics, and raw-data table view. The authors also emphasize integration with the EMLN R package and a JSON/CSV schema designed around standard multilayer concepts (layers, physical nodes, state nodes, intralayer and interlayer links). The result is a feature-complete visualization system that is meant to lower the barrier to exploratory multilayer analysis; the paper reports qualitative stress-testing and implementation details rather than a controlled user study or algorithmic benchmark.
Key findings
- MiRA provides seven visualization modes: Network, Map, Layer View, Grid View, Meta-Network, Dashboard, and Data Mode, all sharing the same underlying multilayer schema.
- The app is installation-free and runs as a static single-page web app in any modern browser; the authors say it can also be used offline by opening index.html locally.
- MiRA supports biological multilayer networks from JSON or CSV and is integrated with the EMLN R package, where a multilayer object can be visualized with a single line of code.
- The internal data model uses four required arrays — layers, nodes, extended, state_nodes — plus optional directed flags, and automatically distinguishes intra- from interlayer edges by comparing layer_from and layer_to.
- In stress testing, a synthetic temporal network with 8 layers, 100 physical nodes, 8,000 intralayer links, and 7,000 interlayer links rendered without issues on a MacBook Pro M1 and a Windows machine with Intel i7 in Chrome.
- MiRA computes basic multilayer properties internally, including per-state-node degree/strength, participation, layer densities, node- and edge-Jaccard similarities, and meta-network projections, which are used for Dashboard Mode and for visual encodings.
- The authors explicitly state MiRA does not implement higher-order analyses such as centrality, community detection, motif analysis, or null-model comparison; those are intended to be computed upstream and passed in as attributes.
Threat model
The relevant “threat” is interpretability failure caused by high visual complexity in multilayer biological networks. The user is assumed to be a researcher or educator who knows the domain but may not know programming or specialized multilayer software. The system assumes the data are already prepared in a valid multilayer format, and it does not protect against malicious attackers or adversarial inputs beyond basic schema handling described in the paper. Users are not assumed to need on-platform analytical inference; those computations are expected to happen upstream.
Methodology — deep read
MiRA is presented as a visualization system, so the threat model is not an adversarial-security one but a usability and scalability problem: the user is a biologist or educator exploring a multilayer network, and the “adversary” is visual complexity. The paper assumes the user already has a biologically meaningful multilayer dataset and wants to inspect structure, spatial organization, cross-layer coupling, and per-layer summaries. The system is explicitly not meant to replace multilayer analysis packages; instead it assumes analysis is done upstream and results can be attached as node/link/layer attributes for interactive coloring and filtering.
The data model is built around the EMLN ecosystem rather than inventing a new graph format. MiRA accepts JSON or CSV, and the JSON schema requires four arrays: layers, nodes, extended, and state_nodes. Layers hold layer identity, optional latitude/longitude, bipartite status, and arbitrary attributes. Nodes represent physical entities and can carry a node_type field for bipartite networks plus global attributes. The extended array is a single edge list containing both intra- and interlayer links via fields layer_from, node_from, layer_to, node_to, and optional weight. State_nodes enumerate every (layer, node) pair and store per-layer attributes that can differ for the same physical node across layers. This is the key design choice because it lets any valid upload feed all visualization modes without transformation. The paper does not describe a training dataset or labeling process because there is no ML model; there is also no train/test split.
Algorithmically, MiRA is mostly a rendering and projection engine with some built-in multilayer statistics. The authors follow the matrix conventions of Boccaletti et al. and define intralayer and interlayer adjacency matrices with weighted support. MiRA computes state-node-level intralayer degree and strength, interlayer degree and strength, per-physical-node aggregates (sum, mean, participation/multiplexity), layer density for unipartite and bipartite as well as directed and undirected graphs, pairwise node-identity and edge-identity Jaccard similarity, and three flavors of meta-edge aggregation: union, sum-of-occurrences, and sum-of-weights. These metrics are used both for Dashboard Mode and for visual encodings such as node size and color. A concrete example is their Network Mode: when the user loads the Canary Islands pollination multilayer network, nodes can be colored by strength and scaled by degree; selecting a plant species highlights that node and all of its intralayer and interlayer connections across every layer where it appears, while unrelated nodes are dimmed.
The rendering architecture is a static JavaScript single-page app with no server-side component and no build pipeline. The implementation uses ES modules plus runtime-loaded libraries: Leaflet for maps, PapaParse for CSV import, d3 for force layouts and formatting, Konva for off-screen hit-testing, chroma.js for color scales, and html2canvas/jsPDF for export. Notably, no WebGL/3D library is used; the layered 3D-like view is rendered in Canvas 2D with a hand-rolled oblique isometric projection. The authors say this choice helps keep the app browser-native and installation-free. MiRA is hosted on GitHub Pages and can also be bundled with EMLN; in that pathway, EMLN serializes the multilayer object to JSON, launches a local httpuv server, and opens the app preloaded in the user’s default browser.
Evaluation is qualitative and implementation-oriented rather than a formal user study or benchmark against prior visualization systems. The paper compares feature coverage against MuxViz and Arena3Dweb at a high level: MuxViz requires R/programming and is not browser-interactive, while Arena3Dweb is web-based but does not support bipartite structures and lacks geographic context support. Performance claims come from a stress test rather than statistically controlled measurements: a synthetic temporal network with 8 layers, 100 physical nodes, 8,000 intralayer links, and 7,000 interlayer links (15,000 total links) rendered fluidly in Chrome on a MacBook Pro M1 and a Windows machine with an Intel i7. The paper notes that interlayer links are the dominant performance cost and are hidden by default. Reproducibility is reasonably strong on the software side: source code is open on GitHub, the app is hosted publicly, docs are maintained online, and the version bundled into EMLN is frozen at package release time. However, there is no released benchmark dataset or quantitative user-evaluation protocol described in the text provided.
Technical innovations
- A seven-mode browser-native visualization environment tailored to biological multilayer networks, rather than a single fixed rendering.
- A unified multilayer JSON/CSV schema aligned with EMLN that handles layers, physical nodes, state nodes, and both intra- and interlayer edges in one object.
- Interactive geographic and layer-based layouts that can switch between stacked 3D-like, map, grid, and aggregated meta-network views without reformatting the data.
- Built-in multilayer summary statistics for degree, strength, participation, density, Jaccard similarity, and meta-network projection, with directed and bipartite support.
- Offline deployment as a static single-page app plus optional bundling inside the EMLN R package for reproducible local use.
Datasets
- Canary Islands pollination multilayer network — size not specified in the provided text — source not specified in the provided text
- Plasmodium var gene multilayer network — 9 layers shown in Fig. 2; full size not specified in the provided text — source not specified in the provided text
- Synthetic temporal network for stress testing — 8 layers, 100 physical nodes, 8,000 intralayer links, 7,000 interlayer links — synthetic
Baselines vs proposed
- MuxViz: browser-interactive visualization = not supported vs proposed: supported
- MuxViz: programming requirement = R/programming knowledge required vs proposed: no installation or programming required for basic use
- Arena3Dweb: bipartite support = not supported vs proposed: supported
- Arena3Dweb: geographic context = not supported vs proposed: supported
- Stress test rendering: 15,000 total links = rendered without issues on MacBook Pro M1 and Intel i7 Windows Chrome vs proposed: fluid navigation reported
Figures from the paper
Figures are reproduced from the source paper for academic discussion. Original copyright: the paper authors. See arXiv:2605.09597.
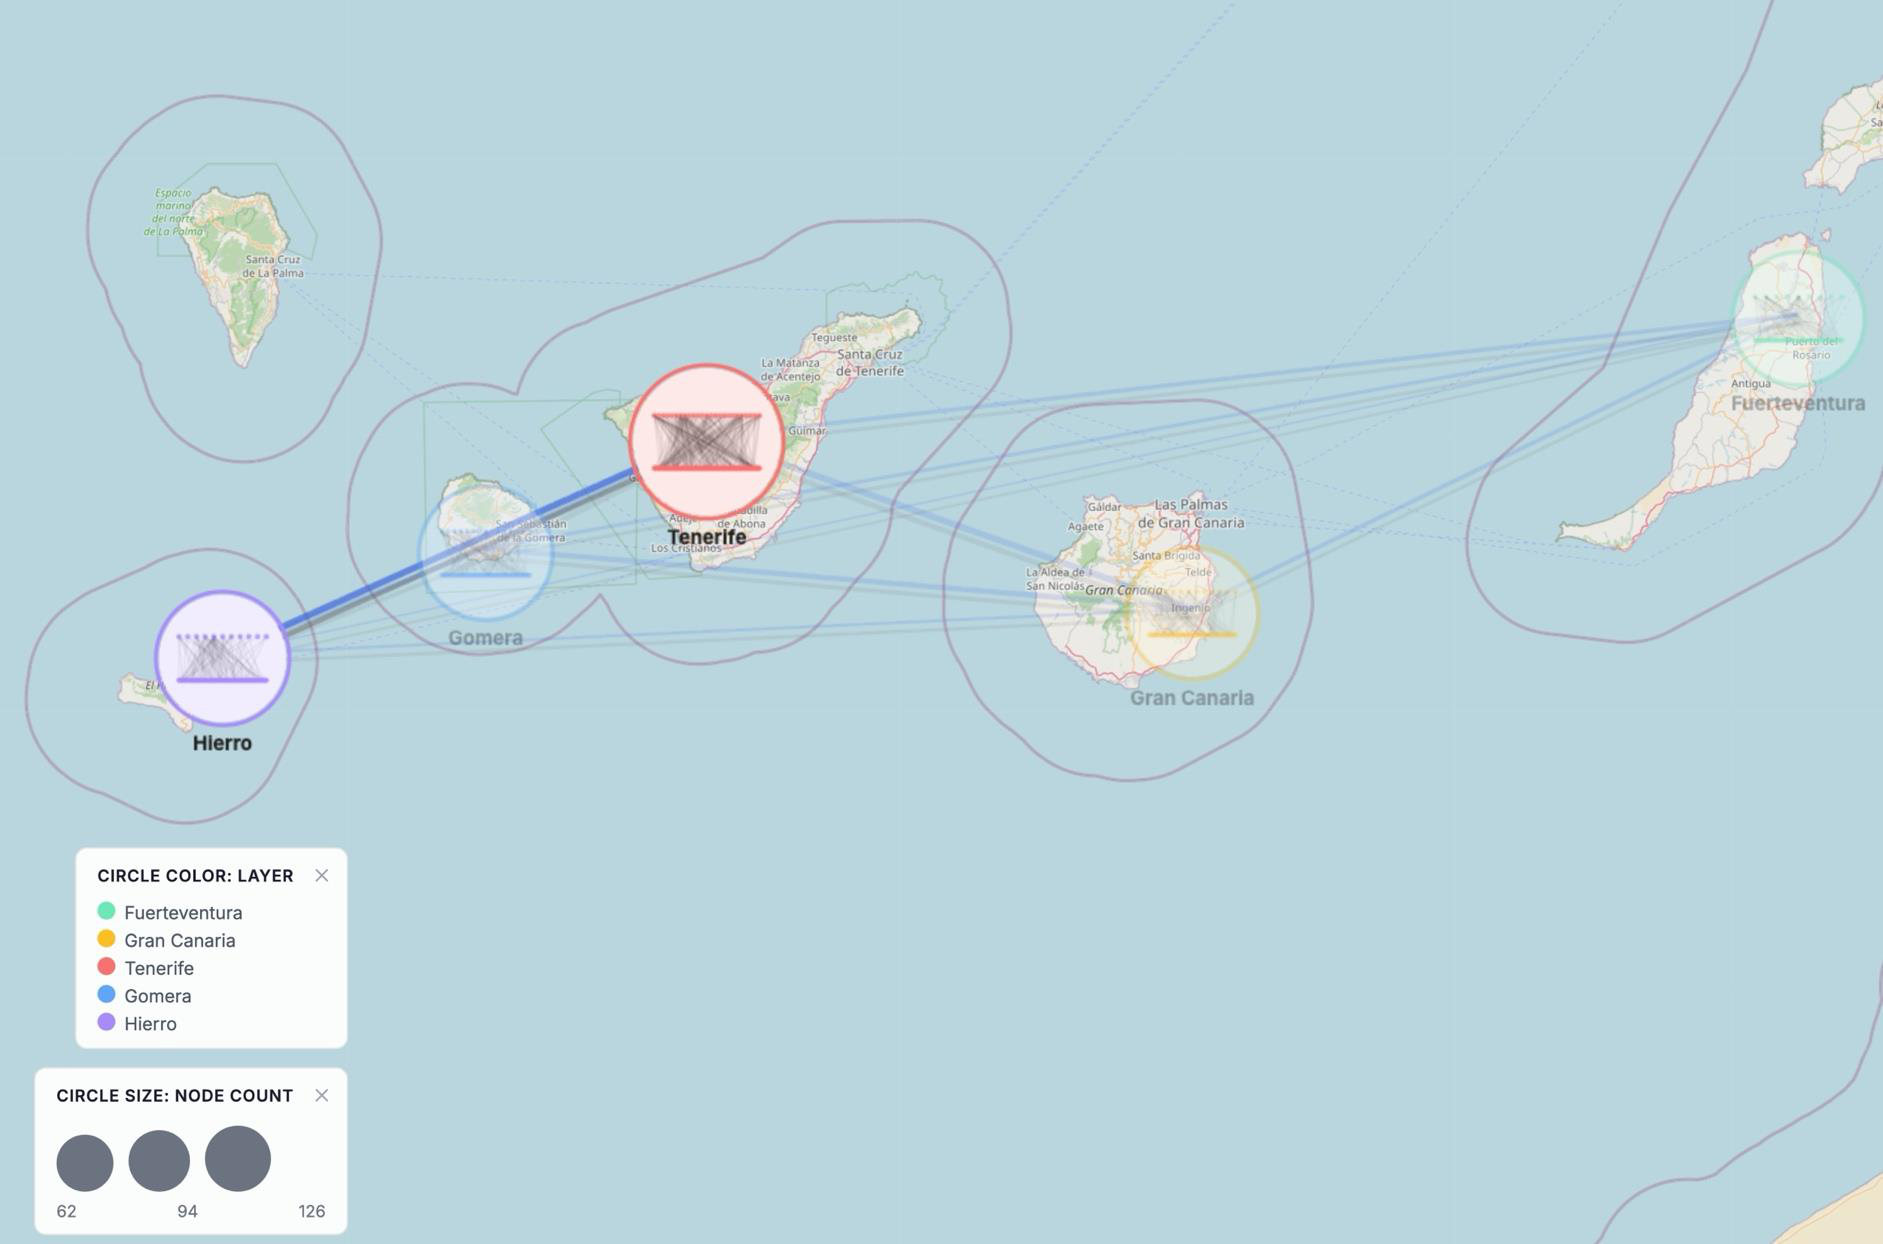
Fig 1: Network Mode, Map Mode, and Layer Mode visualization of the Canary Islands pollination multilayer
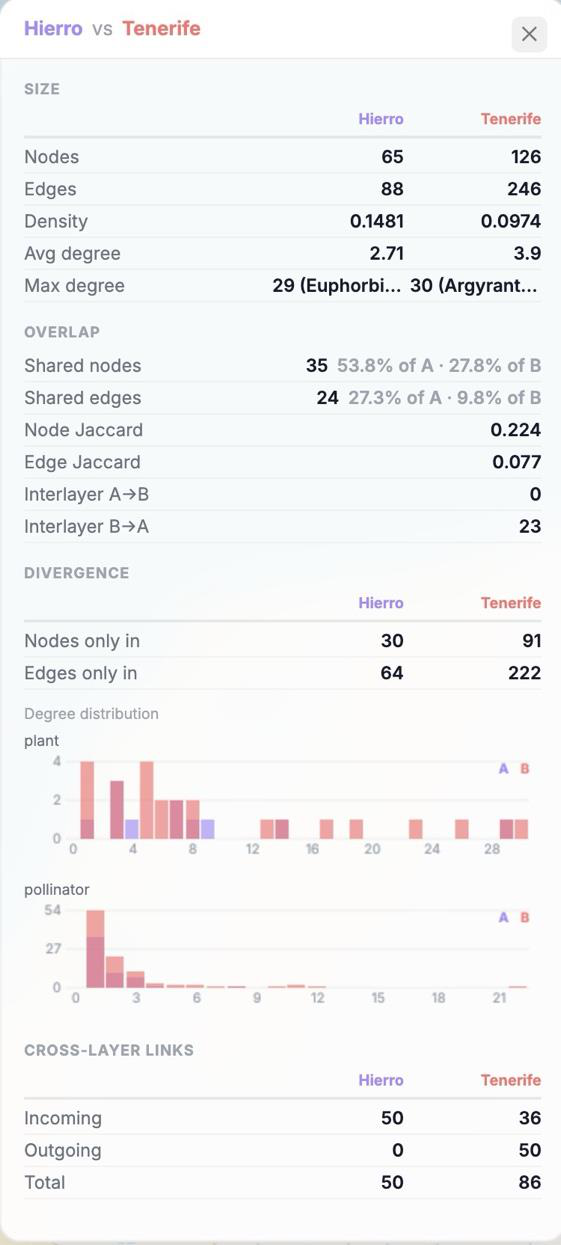
Fig 2: Grid, Meta-network and Dashboard Mode visualization of the Plasmodium var gene multilayer
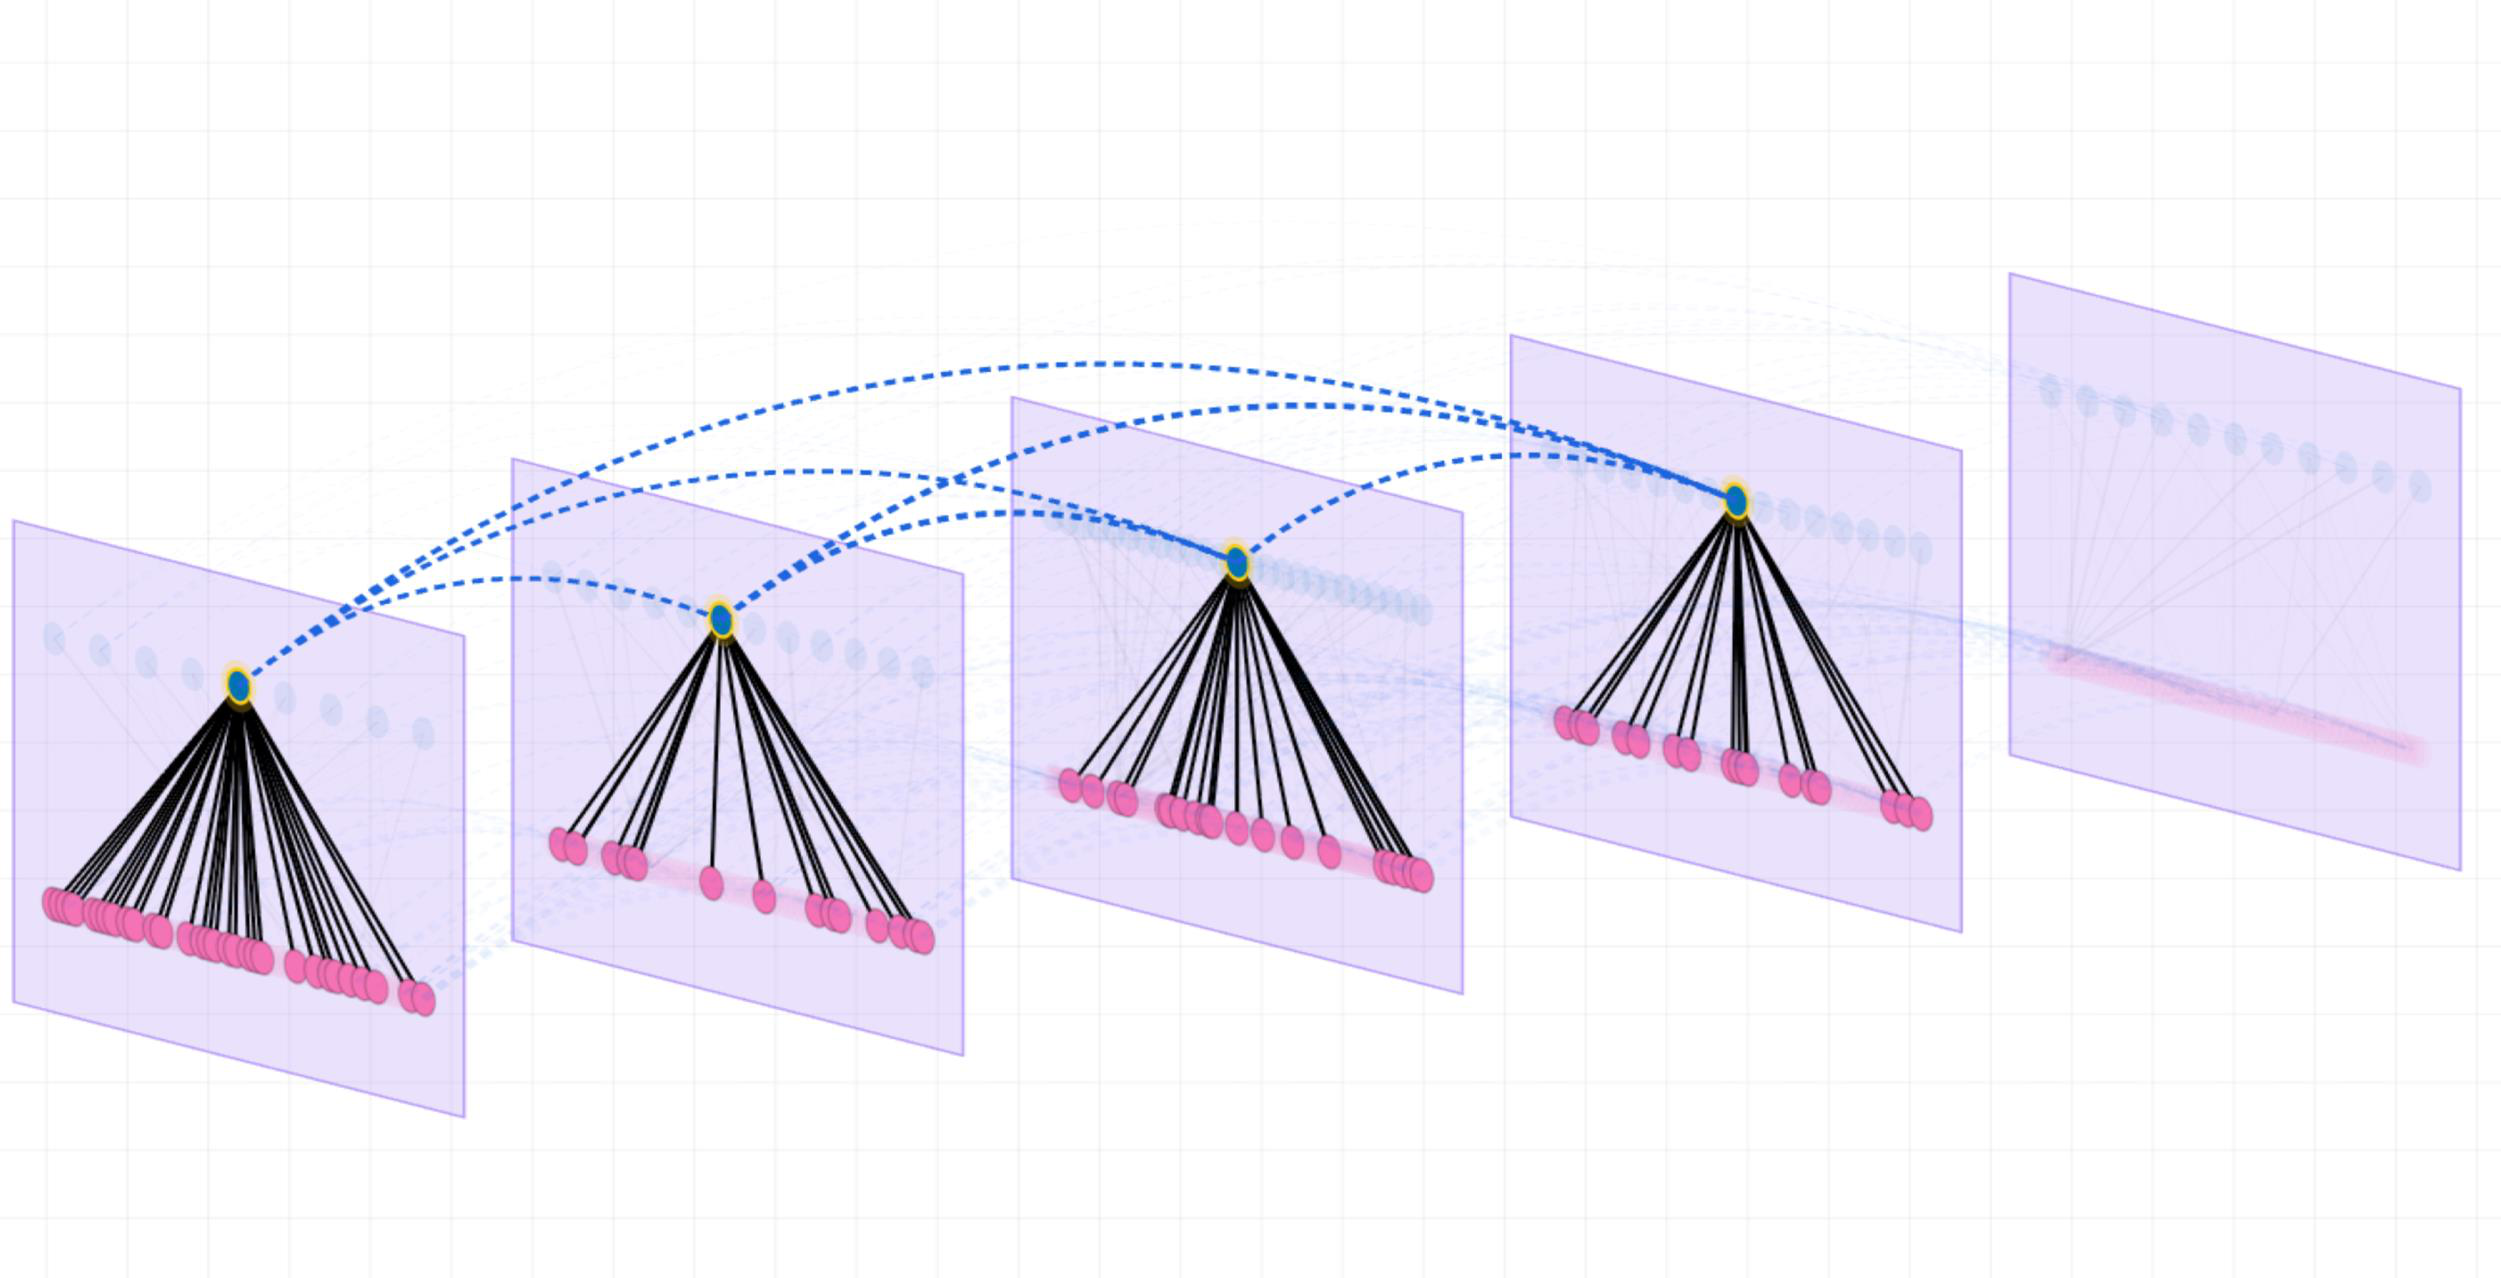
Fig 3 (page 2).
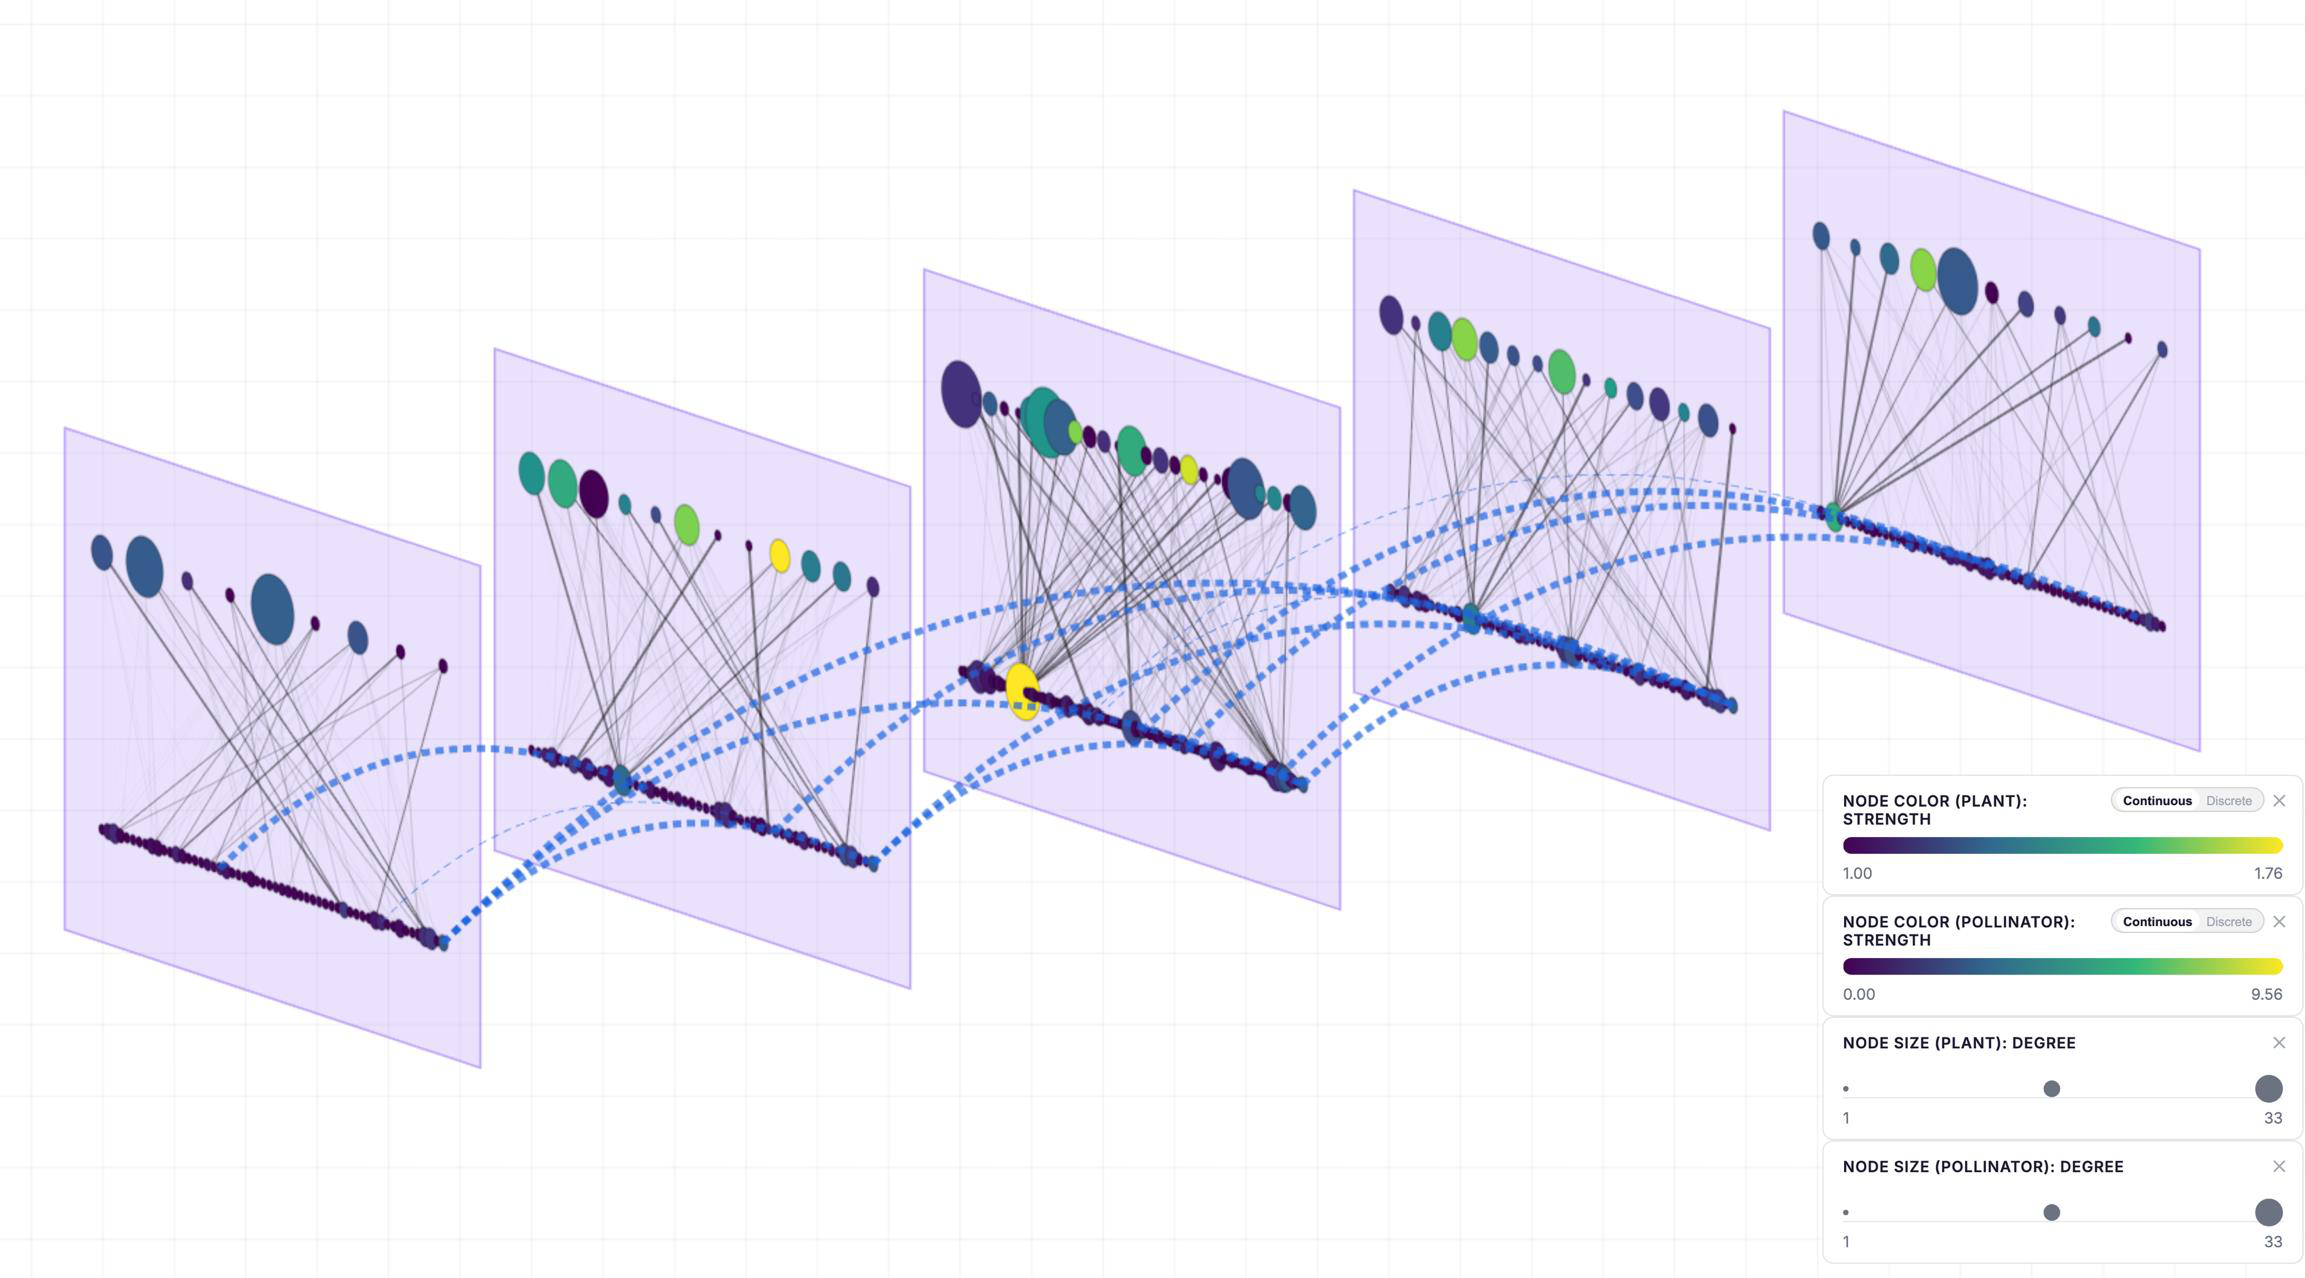
Fig 4 (page 2).
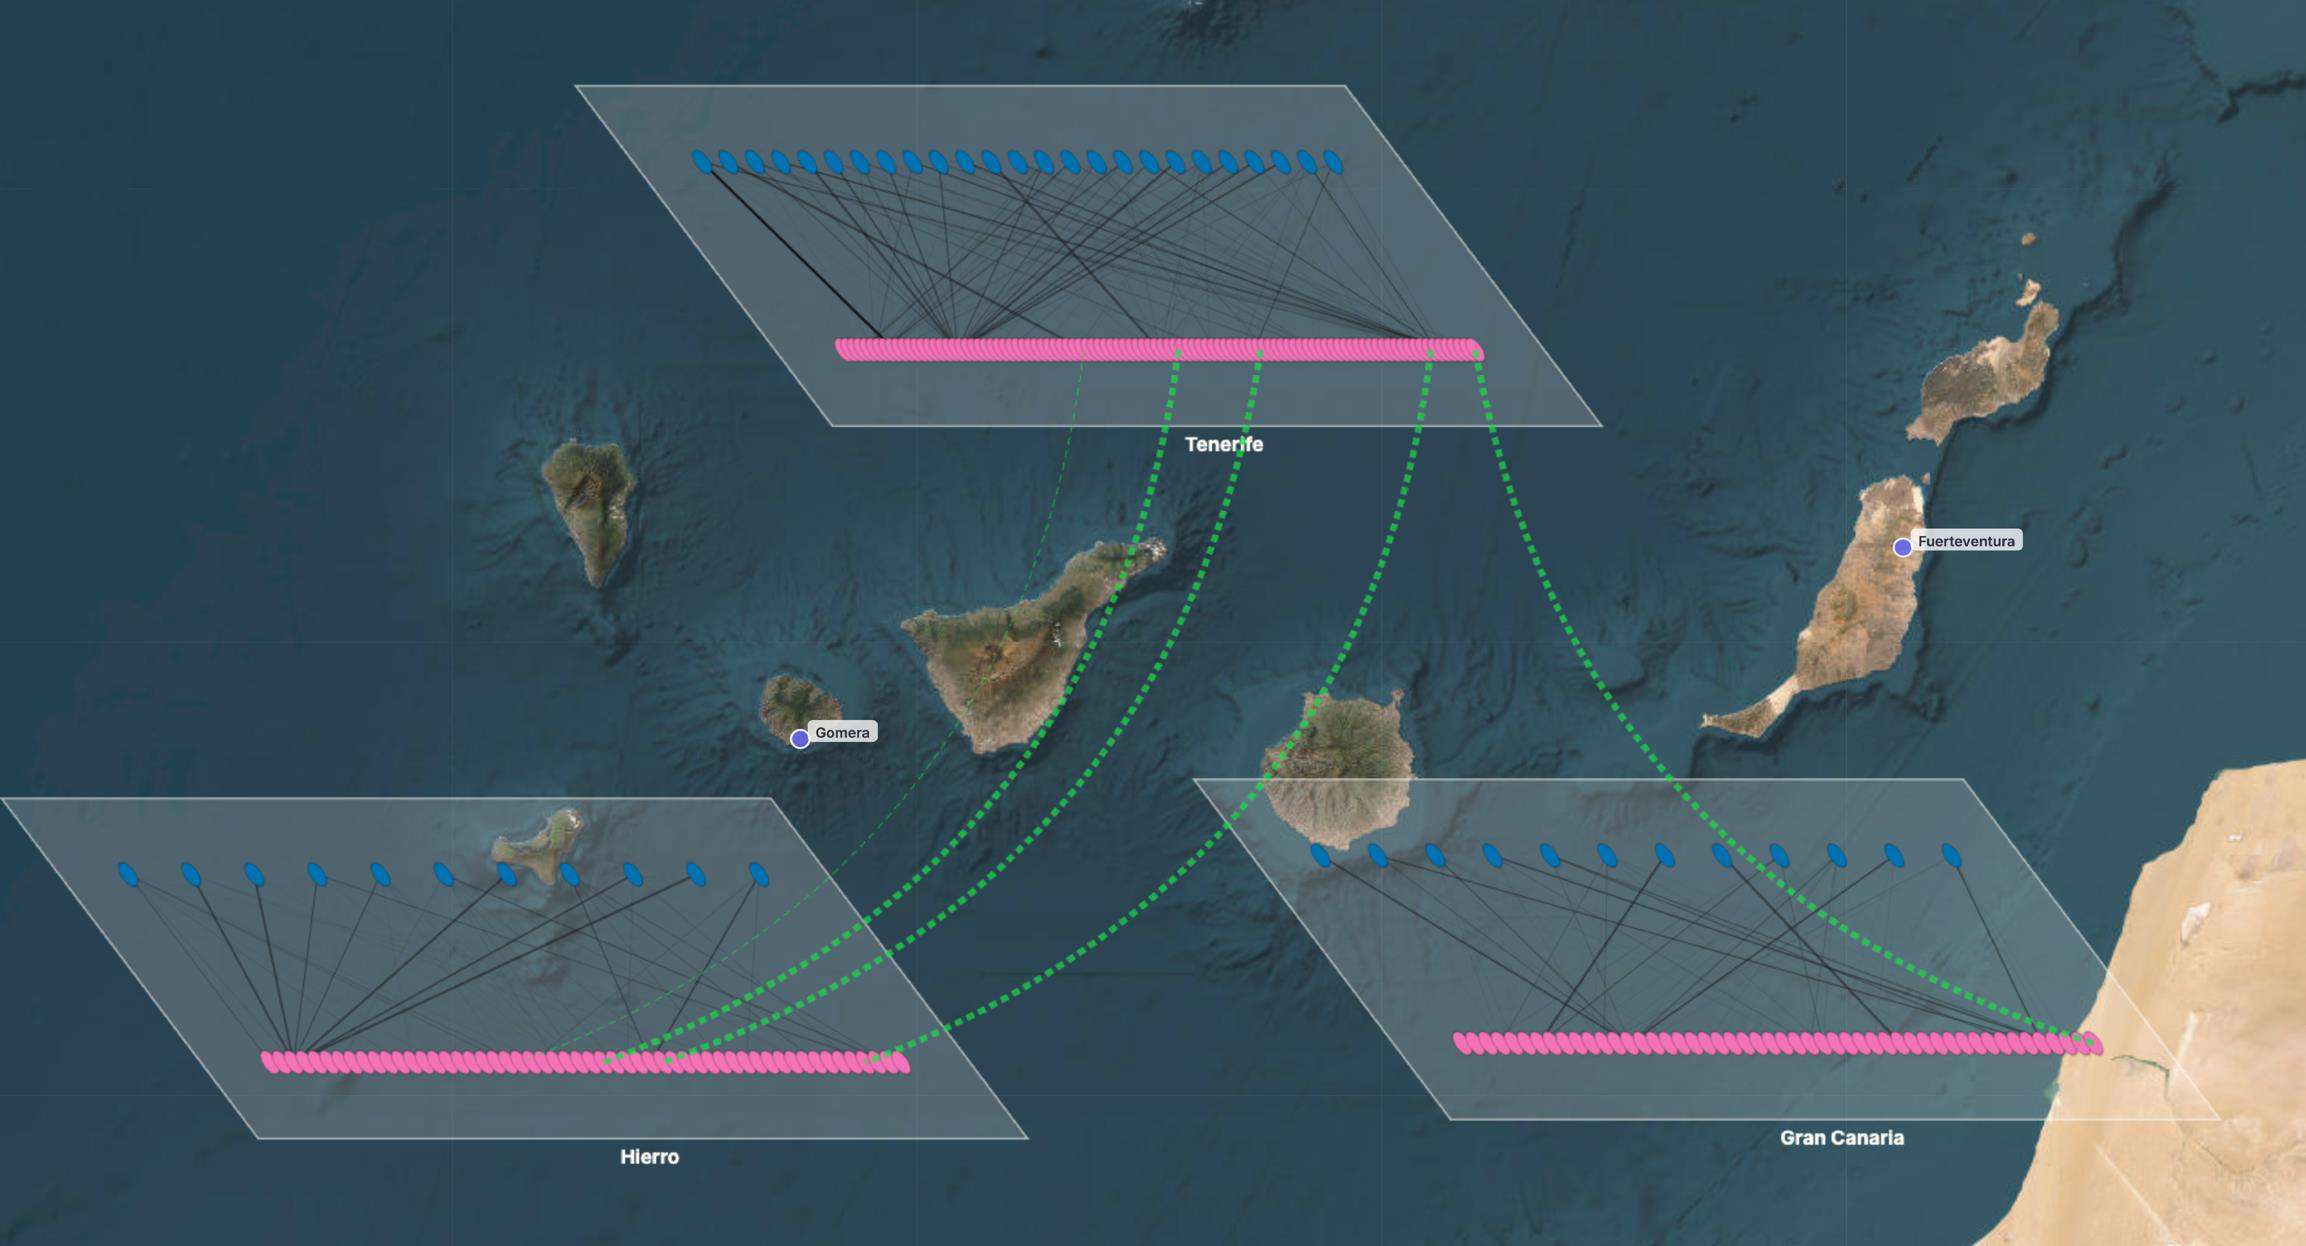
Fig 5 (page 2).
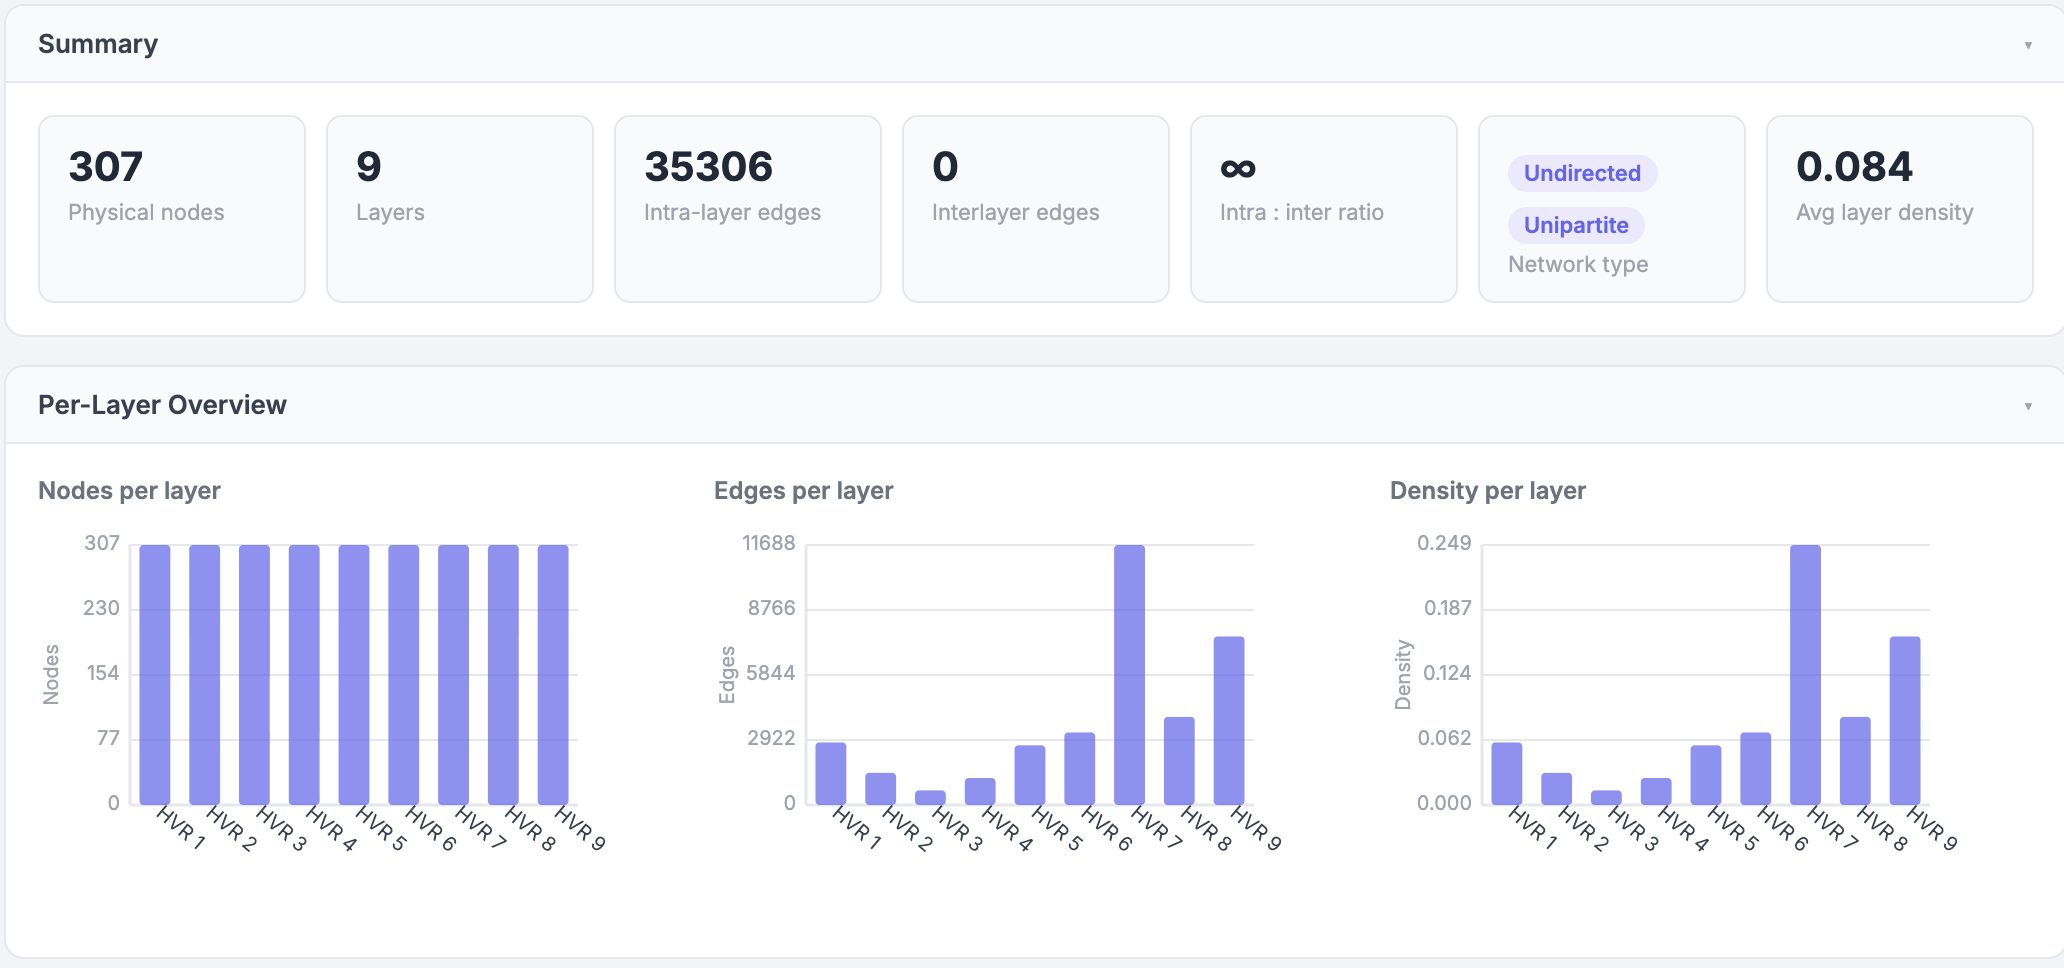
Fig 6 (page 3).
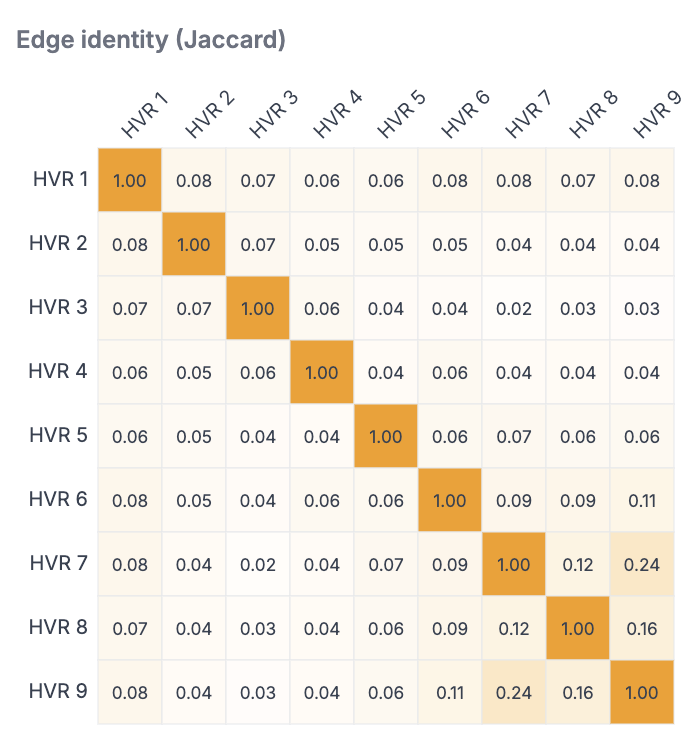
Fig 7 (page 3).
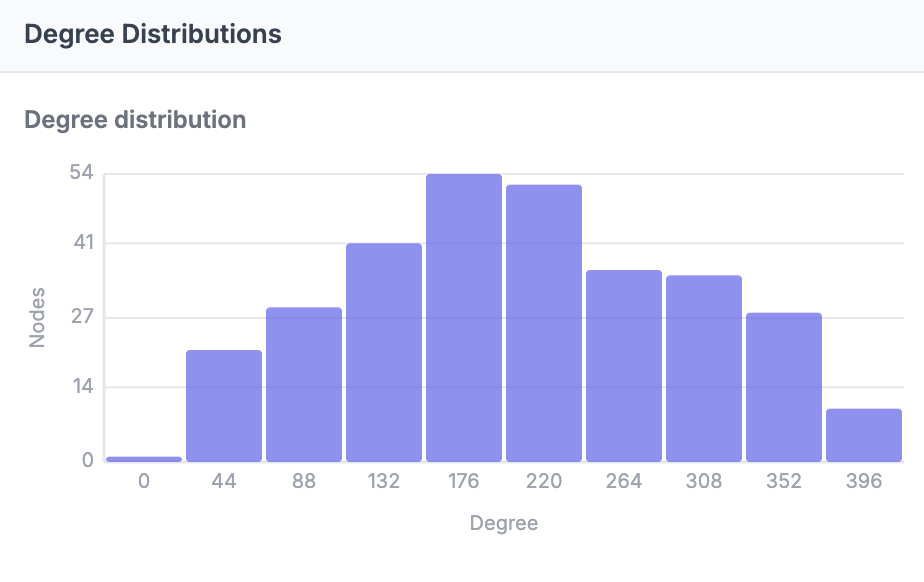
Fig 8 (page 3).
Limitations
- No controlled user study, task-based evaluation, or usability metrics are reported in the provided text.
- No quantitative benchmark on runtime, frame rate, memory use, or scalability curves beyond one stress test is given.
- MiRA intentionally omits higher-order analyses such as centrality, community detection, motif analysis, and null-model comparison, so it is not an analysis replacement.
- The app currently supports only a single multilayer dimension, not networks varying simultaneously over multiple dimensions beyond one axis.
- The architecture is described as desktop/laptop oriented and explicitly not designed for tablets or phones.
- The performance claims depend on browser/CPU/hardware conditions and may not generalize to lower-powered machines.
Open questions / follow-ons
- How does MiRA perform on genuinely large real-world multilayer datasets in terms of frame rate, interaction latency, and user task success?
- Which visualization mode best supports specific biological tasks, such as finding layer-specific hubs, spatial clustering, or cross-layer overlap?
- How robust is the data model to messy real-world inputs, missing metadata, or inconsistent node identities across layers?
- Would a formal comparison against MuxViz or Arena3Dweb on shared benchmark tasks show measurable gains in accuracy or speed?
Why it matters for bot defense
For a bot-defense engineer, MiRA is relevant less as a CAPTCHA system and more as an example of how to make complex, high-dimensional state legible to humans without requiring installation or expertise. The design pattern that matters is progressive disclosure: multiple coordinated views, shared selection state, filtering, and summary panels that let users move between overview and detail. That is directly transferable to security operations dashboards, fraud graph exploration, and abuse investigation tools where analysts need to understand cross-entity relationships quickly.
The paper also reinforces a practical lesson for CAPTCHA and bot-defense tooling: if human review is part of the workflow, visualization quality can materially affect detection speed and confidence. MiRA’s use of a static web app, offline operation, and a schema that accepts upstream analytical attributes suggests a clean separation between computation and inspection. For bot-defense systems, that architecture can make analyst-facing tools easier to deploy and more reproducible, especially when investigating coordinated behavior across accounts, devices, or sessions.
Cite
@article{arxiv2605_09597,
  title={ Interactively visualizing biological multilayer networks using MiRA },
  author={ Shir Miryam Nehoray and Yuval Bloch and Shai Pilosof },
  journal={arXiv preprint arXiv:2605.09597},
  year={ 2026 },
  url={https://arxiv.org/abs/2605.09597}
}