
Why Global LLM Leaderboards Are Misleading: Small Portfolios for Heterogeneous Supervised ML
Source: arXiv:2605.06656 · Published 2026-05-07 · By Jai Moondra, Ayela Chughtai, Bhargavi Lanka, Swati Gupta
TL;DR
This paper attacks a foundational assumption underlying LLM leaderboards like Arena (formerly LMArena): that a single global Bradley-Terry (BT) ranking meaningfully summarizes user preferences across a diverse population. Using ~89K pairwise comparisons spanning 52 LLMs and 116 languages from the Arena platform, the authors demonstrate that the global BT ranking is statistically near-useless at the individual vote level — top-50 models are essentially indistinguishable, and the global ranking predicts the winner with ≥70% confidence for only ~11% of all votes. The core diagnosis is that what looks like noise in aggregate is actually a superposition of coherent but conflicting preference structures, with language being the dominant organizing variable: language- and language-family-stratified BT rankings produce Elo score spreads two orders of magnitude larger than the global ranking, indicating far more internally consistent preferences within those subgroups.
To address this problem beyond the Arena context, the authors introduce (λ, ν)-portfolios: small sets of models (rankings or classifiers) such that for at least ν fraction of users, at least one model in the set predicts within error margin λ. They connect this to the Partial Set Cover problem, providing approximation guarantees via both a greedy O(log νn)-approximation and a VC-dimension-based algorithm. They also formulate an exact MIP for finite hypothesis classes. On Arena, a greedy-selected portfolio of just 5 BT rankings covers >96% of votes at a modest λ, compared to 21% coverage by the global ranking at the same threshold. A portfolio of 6 LLMs covers twice as many votes as the top-6 models from the global ranking.
A secondary case study on the COMPAS recidivism dataset shows the framework generalizes: a portfolio of 4 fairness-regularized classification models achieves 90% coverage at λ=0.45, and the uncovered residual (younger defendants with few prior offenses) surfaces a genuine blind spot in the model ensemble, demonstrating the portfolio approach as a diagnostic tool for auditing prediction gaps rather than merely a performance optimization strategy.
Key findings
- 72.28% of decisive non-tied votes in the Arena dataset (~89K comparisons, 52 LLMs, 116 languages) are 'cancelled' — i.e., for every vote preferring LLM A over LLM B, there is an opposing vote preferring B over A, making the global signal nearly self-negating.
- The global BT ranking predicts the winner with ≥70% confidence for only 10.3% of all Arena votes, despite being trained on those same votes.
- Within the global top-50 models, the maximum pairwise win probability is at most 0.53 — statistically near-random — corresponding to a ≤50 Elo-point spread across all 50 models on the Arena website as of May 4th.
- Language-stratified BT rankings produce Elo score spreads two orders of magnitude higher than the global ranking (Fig 1), indicating that language is the primary driver of structured preference heterogeneity, far exceeding task, time, or random subgroup splits.
- A greedy portfolio of 5 BT rankings covers >96% of Arena votes at a modest λ threshold, versus 21% coverage by the global ranking at the same λ — a ~4.6× improvement in coverage.
- A portfolio of 6 LLMs selected via the portfolio framework covers twice as many Arena votes as the top-6 LLMs selected from the global BT ranking.
- Grok-4 ranks globally in the top 5 but falls to rank 52 in the Afro-Asiatic language-family BT ranking, illustrating that global top models can be bottom performers for specific language communities.
- On COMPAS, a greedy portfolio of 4 fairness-regularized models achieves 90% coverage at λ=0.45 (83.56% at λ=0.40), and the uncovered residual is systematically composed of younger individuals (under 45) with few prior offenses — all repeat offenders — flagging a model blind spot not captured by any of the 61 ensemble members.
Threat model
n/a — this is not a security paper in the conventional sense. The implicit adversarial framing is epistemic: the 'threat' is the leaderboard operator or ML practitioner who relies on a global BT ranking to make deployment decisions, being misled by aggregate statistics that mask structured subpopulation heterogeneity. No strategic adversary (vote manipulator, model gaming actor) is modeled; the authors explicitly set aside manipulation-based failure modes (covered in parallel work by Min et al. [2025], Huang et al. [2025b]) to focus on heterogeneity-induced failure that occurs even without any adversary.
Methodology — deep read
The threat model here is not adversarial in the security sense but rather an epistemic failure model: the 'adversary' is the implicit assumption that a single global BT ranking faithfully represents a heterogeneous global user base. The authors assume no strategic vote manipulation; they explicitly note that heterogeneity alone, without any adversary, is sufficient to make global rankings misleading.
Data: The Arena dataset is sourced from HuggingFace (lmarena-ai/arena-human-preference-140k). The working subset contains 89,193 decisive non-tied votes and 19,375 ties across 52 LLMs and 116 languages. Each vote records: (a) which two LLMs were compared, (b) the outcome (LLM A wins, LLM B wins, tie, or both bad), (c) timestamp, (d) prompt/response language, and (e) task category. 'Both bad' votes are excluded; ties assign 0.5 weight to each LLM. Crucially, voter identity is not available, so each vote is treated as an independent 'user'. For COMPAS, the standard ProPublica recidivism dataset is used; exact size is not re-stated in the truncated text but the dataset is publicly known (~7,000 defendants). No train/test split is described for the Arena BT fitting — the global BT model is fit on all votes and evaluated on the same votes (the authors acknowledge this, noting the hedging behavior is not explained by overfitting).
Architecture and BT fitting: The standard Bradley-Terry model is used throughout. Each LLM receives a real-valued score θ_ℓ; win probability between LLMs a and b is σ(θ_a - θ_b) under a base-10 logistic scale. To correct for non-uniform sampling of LLM pairs (some pairs are matched far more often), the authors use inverse-probability weighted (IPW) log-likelihood as prescribed by Chiang et al. [2024]: each vote for pair (a,b) is weighted by 1/P̂({a,b}), the reciprocal of that pair's empirical sampling frequency. Scores are centered to zero mean and reported in Elo-scaled units (400·θ + 1000). They fit 389 separate BT models: one global, and one per eligible subpopulation (language, language family, task, language×task, language-family×task) with ≥50 votes. Subpopulations with <50 votes are excluded to avoid sampling instability.
Portfolio construction — three methods: (1) Greedy algorithm: iteratively selects the BT ranking that covers the most currently uncovered votes at margin λ, stopping when ν·n votes are covered. This is an O(log νn)-approximation of optimal by Slavík [1997]. (2) MIP: binary variables t_j (include ranking j?) and u_i (is vote i covered?) with constraint Σ_j t_j ≥ cover(i) ≥ u_i and Σ u_i ≥ νn, minimizing Σ t_j. The IP is exact for finite H and solved directly for the ~389-ranking ensemble on an Apple M5 MacBook with 32GB RAM — problem is small enough for exact solution. (3) VC-dimension-based algorithm from Brönnimann and Goodrich [1994] is cited theoretically but it is unclear from the truncated text whether it is applied computationally (this step is somewhat underspecified in the source). Coverage margin λ is swept over {0.05, 0.10, ..., 0.50, 0.60, 0.70, 0.80, 0.90}. A BT ranking λ-covers vote (a≻b) if it assigns win probability ≥1-λ to a, equivalently score_a - score_b ≥ ln((1-λ)/λ).
For LLM portfolios (not just ranking portfolios), voter preferences over unobserved LLM pairs are extrapolated via a Bayesian procedure described in Appendix A.6 (not included in the truncated text): if a BT ranking accurately covers a vote, the voter is assumed to prefer higher-ranked LLMs in that ranking. This allows constructing a coverage metric for individual LLMs rather than just rankings, enabling comparison of portfolio-selected LLMs vs. top-k global LLMs.
For COMPAS, 61 classification models are trained: 1 minimizing binary cross-entropy (BCE) alone, 30 minimizing BCE + μ·EOgap with sex-based groups (μ ∈ {10,20,...,300}), and 30 with race-based groups at the same μ grid. EOgap is the sum of TPR and FPR disparities across protected groups. Each model outputs a recidivism probability; individual i is λ-covered by model j if |h_j(i) - y_i| ≤ λ. Portfolios are built greedily over this ensemble.
Evaluation: For BT rankings, in-group evaluation is used — each subpopulation BT ranking is evaluated only on votes from its own subgroup. Metrics include: (a) average probability assigned to observed winner, (b) average log loss, (c) λ-coverage curves vs. λ threshold, and (d) Elo score spread (max−min) as a proxy for ranking informativeness. Confidence bands in Fig 3 are 95% bands computed across languages within each family. No held-out test set is used for BT models; the authors are measuring representational fidelity, not generalization. No statistical significance tests beyond win probability bounds are reported. Reproducibility: computations run on commodity hardware (Apple M5, 32GB RAM); code/data release status is not explicitly stated in the available text, though the Arena data source on HuggingFace is cited.
Technical innovations
- Introduction of (λ, ν)-portfolios as a formal framework for heterogeneous supervised ML: a small model set guaranteeing that ≥ν fraction of users have ≤λ prediction error from at least one model, generalizing prior ensemble work (e.g., boosting/bagging) which optimizes aggregate loss rather than per-individual coverage.
- Reduction of the minimum-portfolio problem to Partial Set Cover and derivation of VC-dimension-based portfolio size guarantees for regression (Theorem 2, extending Brönnimann and Goodrich [1994]) by converting margin-regression to a binary classification problem via margin-classifier indicators.
- Empirical demonstration that language (and language family) is the dominant structuring variable in Arena preference heterogeneity, producing two-orders-of-magnitude larger Elo score spread than task-only or global splits — a finding the prior Arena/leaderboard literature had not isolated.
- Application of IPW-corrected BT fitting combined with portfolio selection over 389 subpopulation rankings, showing that 5 rankings (greedy) or 4 (MIP) suffice to cover >96% of Arena votes at modest λ, compared to 21% for the global ranking.
- Use of portfolio coverage residuals as a blind-spot diagnostic: uncovered individuals in the COMPAS portfolio (younger, low-prior defendants) are not defined by protected attributes alone but by behavioral feature combinations, providing a novel auditing lens beyond standard fairness metrics.
Datasets
- Arena human preference dataset — ~89,193 decisive votes + 19,375 ties, 52 LLMs, 116 languages — lmarena-ai/arena-human-preference-140k on HuggingFace (public)
- COMPAS recidivism dataset — ~7,000 defendants (exact split not re-stated in paper) — ProPublica / Angwin et al. [2022] (public)
Baselines vs proposed
- Global BT ranking (single model): λ-coverage at modest λ = ~21% of votes vs. greedy portfolio of 5 BT rankings: ~96% of votes
- Global BT ranking: predicts winner with ≥70% confidence for 10.3% of votes vs. language-stratified BT rankings: substantially higher in-group winner probability (exact per-language numbers not extracted in truncated text, but Fig 2 shows consistent improvement in average win probability and log loss)
- Top-6 LLMs from global ranking: coverage of k votes (exact number not stated) vs. portfolio of 6 LLMs via framework: 2× as many votes covered
- Global BT ranking Elo spread (top 50 models): ≤50 Elo points vs. language-stratified BT rankings: two orders of magnitude higher spread (Fig 1)
- COMPAS single best BCE model: coverage not explicitly stated vs. greedy portfolio of 4 models: 90% coverage at λ=0.45, 83.56% at λ=0.40
- Greedy algorithm (5 rankings for ν=0.95 at λ=0.50) vs. MIP (4 rankings at same threshold): MIP matches or outperforms greedy in portfolio size
Figures from the paper
Figures are reproduced from the source paper for academic discussion. Original copyright: the paper authors. See arXiv:2605.06656.
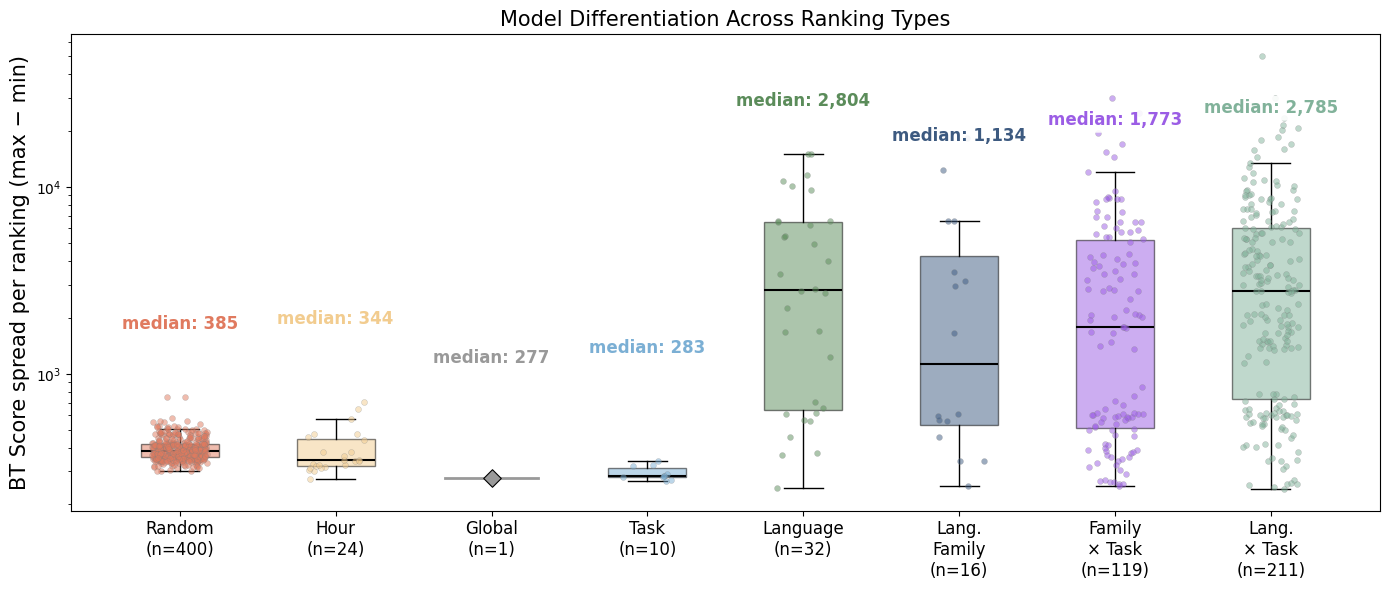
Fig 1: Model differentiation across ranking types. Each point is a BT ranking fitted on a group
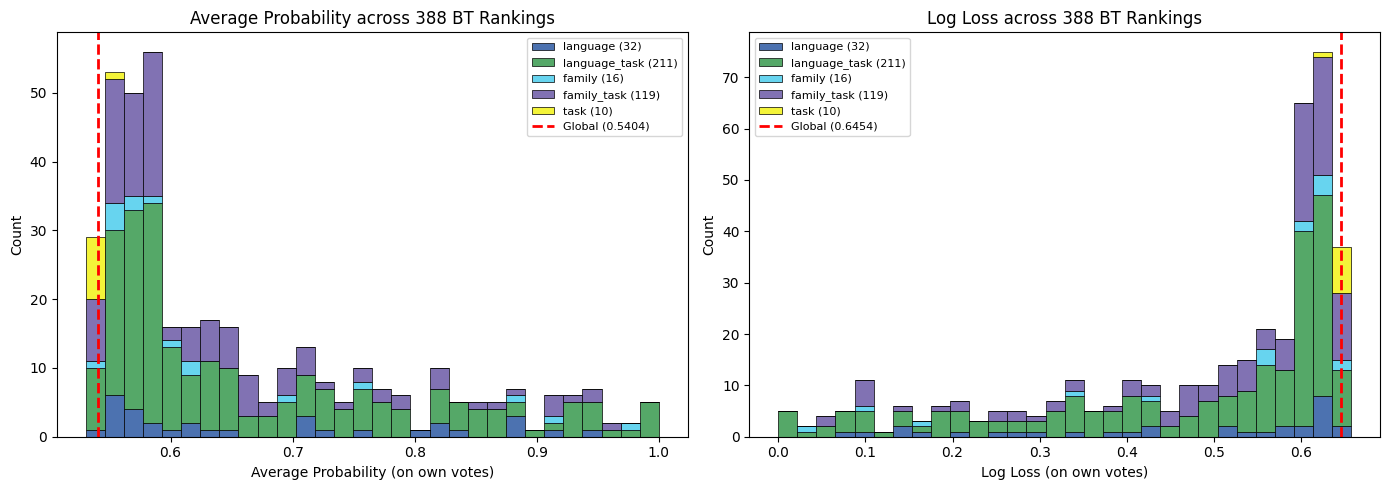
Fig 2: In-group predictive performance of 388 subpopulation BT rankings vs. the global ranking.
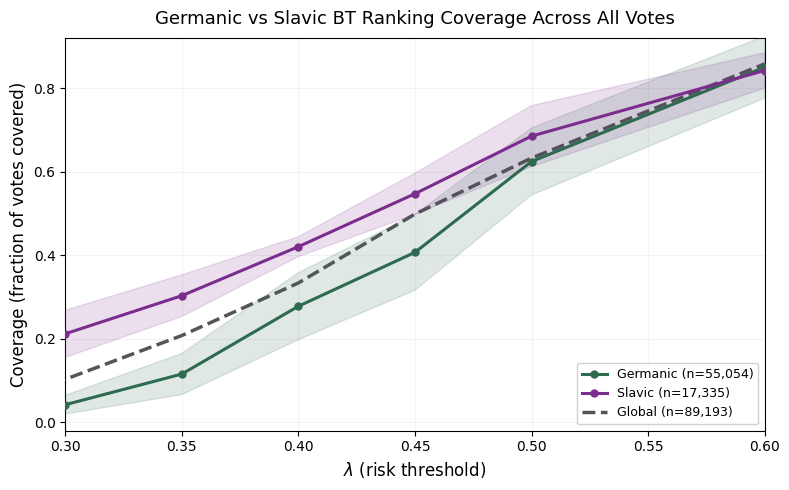
Fig 3: Language-family BT rankings capture distinct preference structure beyond the global
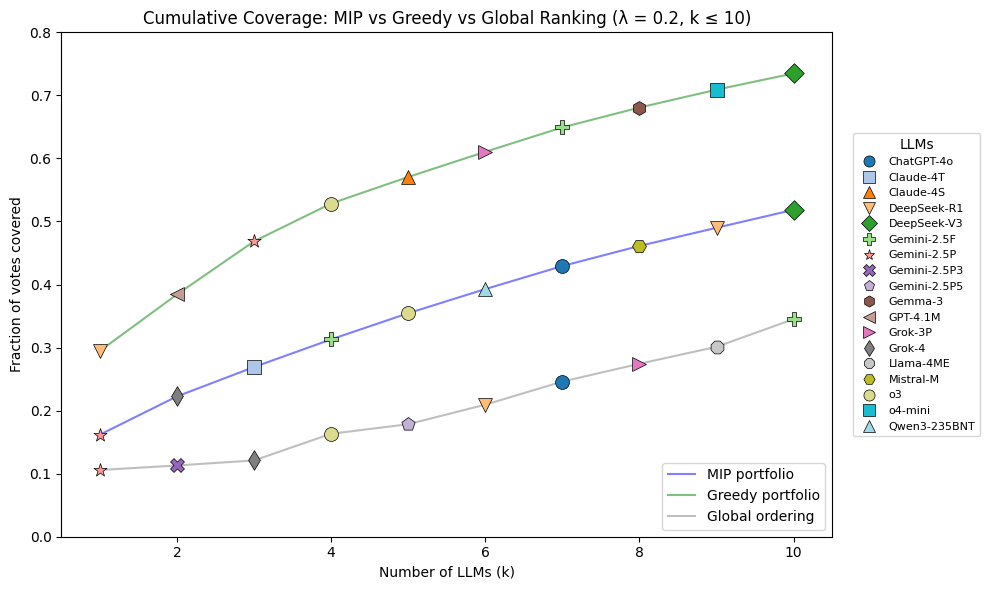
Fig 4: Coverage by global ranking and by our portfolios.
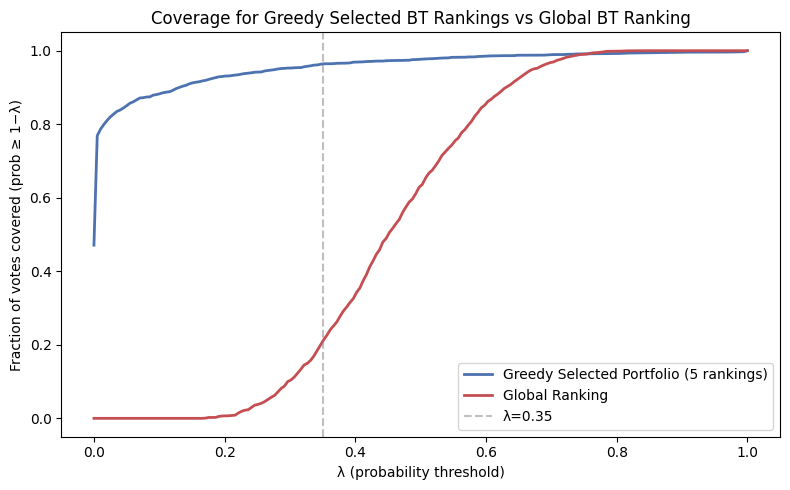
Fig 5 (page 9).
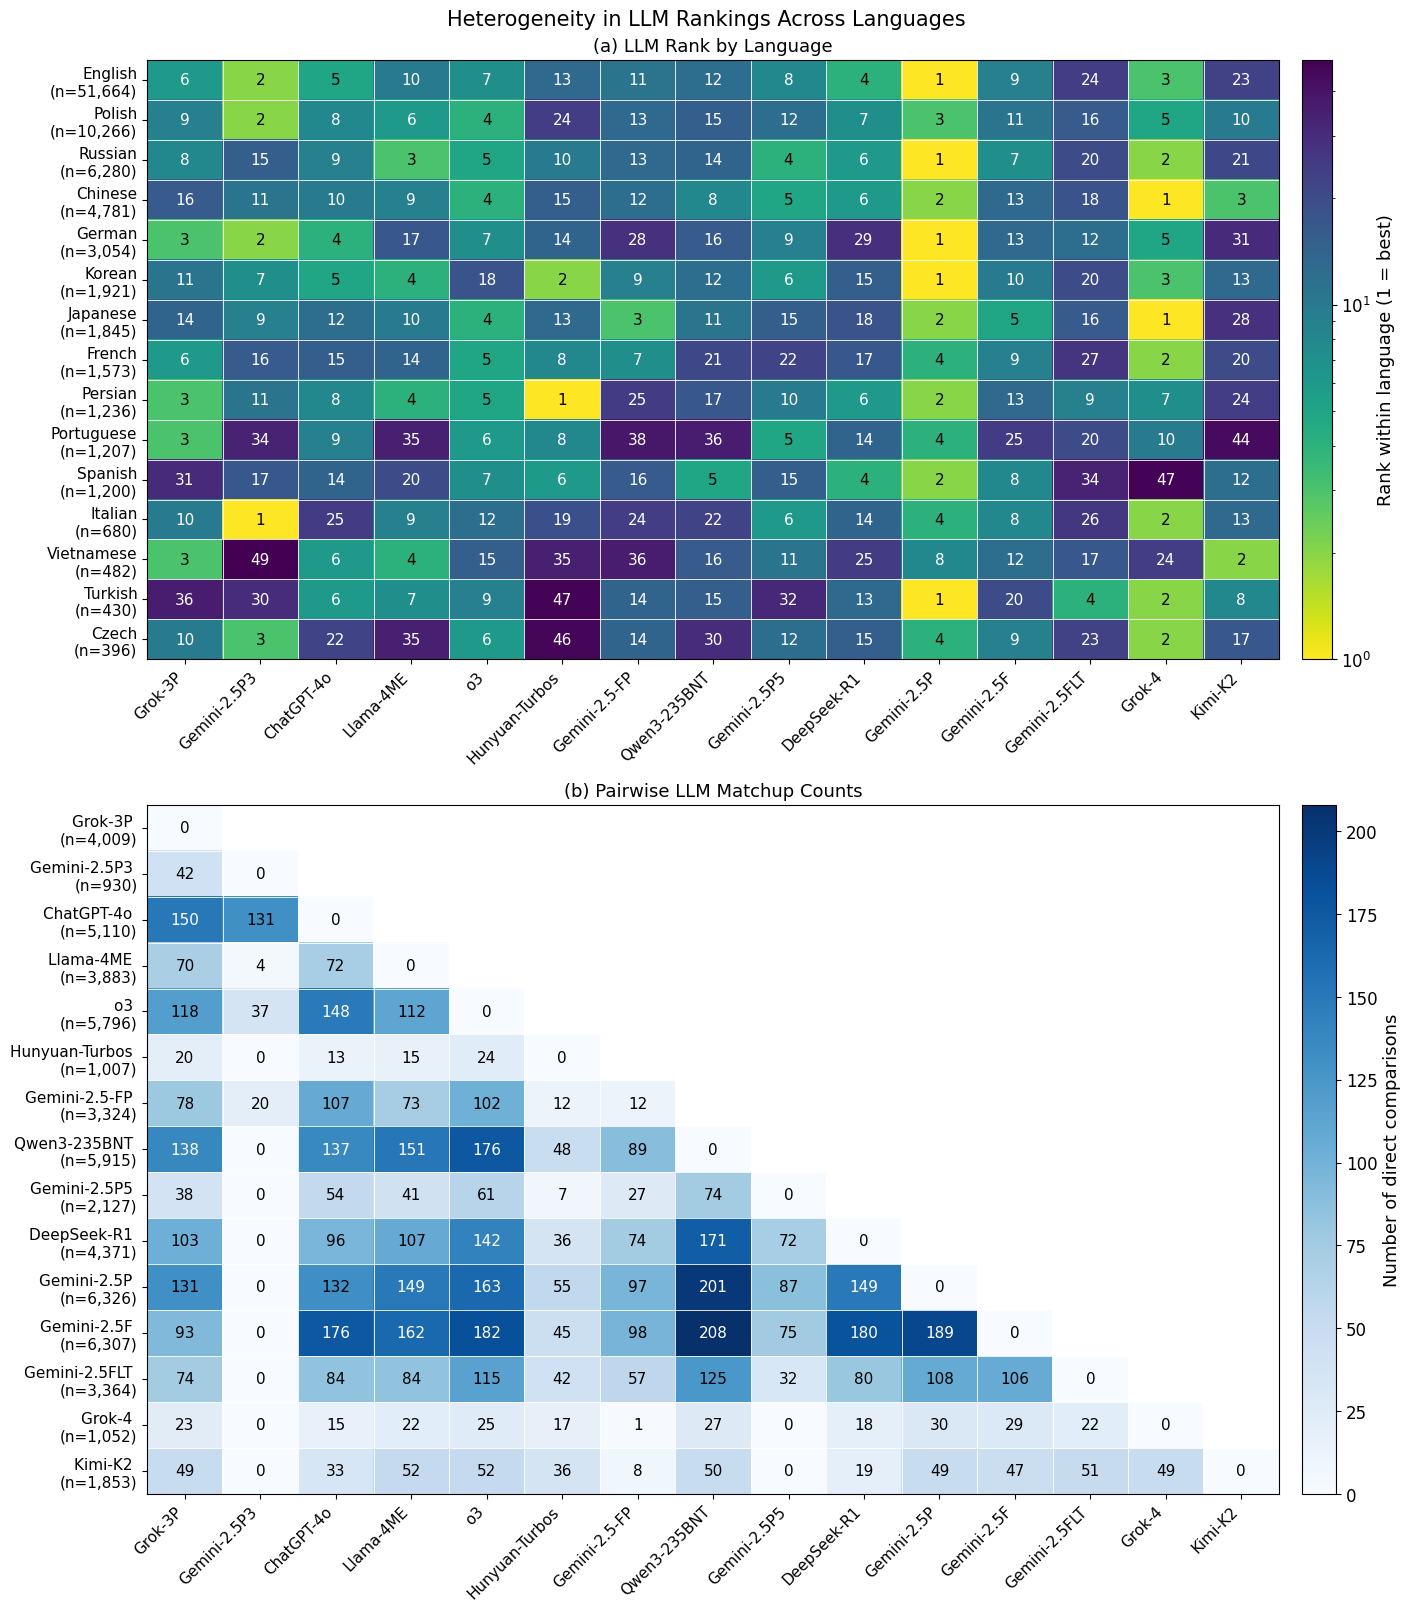
Fig 5: Heterogeneity in LLM rankings across languages. Rows: 15 languages with the most votes
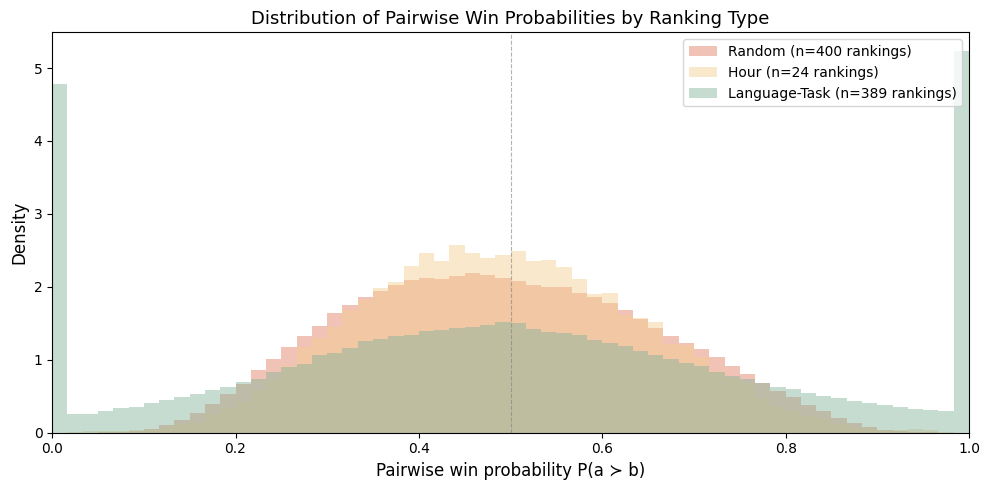
Fig 6: Distribution of pairwise win probabilities Pr(a ≻b) by ranking type. Language-task
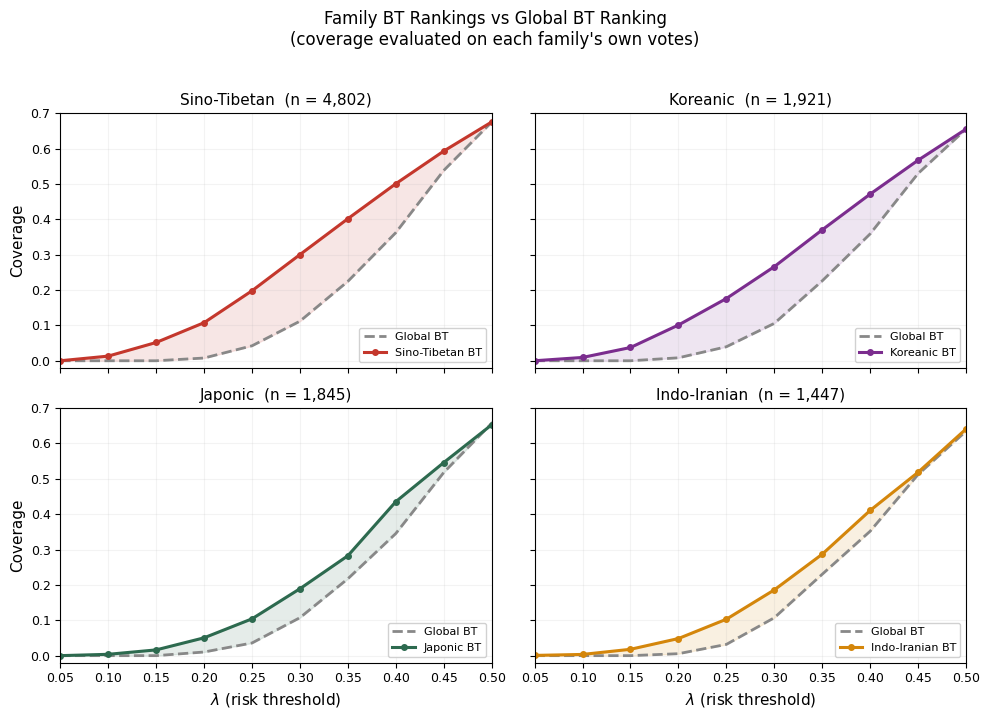
Fig 7: Language Family BT rankings achieve better coverage than a global BT ranking. The top
Limitations
- Voter identity is unavailable in Arena data, making it impossible to distinguish between-user heterogeneity (different people have genuinely different preferences) from within-user noise (the same person is inconsistent) — the authors acknowledge this directly.
- The BT models are both trained and evaluated on the same votes with no held-out test set; coverage statistics measure representational fit, not predictive generalization to future votes or unseen users.
- BT rankings for subpopulations with cross-pair gaps (e.g., Italian × creative writing where some LLM pairs were never compared) still produce a total ordering via score extrapolation, which the authors themselves flag as potentially unsupported — an underappreciated reliability issue in sparse subpopulations.
- The COMPAS case study uses only 61 models and a simple λ-coverage metric applied to raw predicted probability vs. binary outcome, which does not align with standard classification evaluation (e.g., calibration, AUC); the λ-coverage framing may overstate or obscure actual classification performance.
- The Bayesian extrapolation used to convert ranking portfolios into LLM portfolios (Appendix A.6) is not fully described in the main text or the truncated source; it is unclear how sensitive LLM coverage results are to this extrapolation's assumptions.
- The framework assumes a finite pre-specified hypothesis class H (the 389 BT rankings); it does not address how to construct the initial ensemble or whether better subpopulation definitions (e.g., via clustering) would yield smaller portfolios — acknowledged as future work.
- No adversarial or distribution-shift evaluation: the portfolio is optimized on historical Arena data, but there is no analysis of whether the portfolio structure degrades as LLM offerings change over time or as the user population shifts.
Open questions / follow-ons
- How should the initial ensemble H be constructed optimally? The framework takes H as given (here, BT rankings over predefined language/task subgroups), but there is no principled method for discovering the subpopulation structure itself — unsupervised clustering of votes or latent preference modeling could yield smaller or more robust portfolios.
- How temporally stable are the portfolios? Arena data evolves as new LLMs are added and the user base changes; it is unknown whether a portfolio calibrated on historical votes remains a good cover for future votes, especially given that model capabilities change rapidly.
- Can the (λ, ν)-portfolio framework be extended to online/streaming settings, where models must be added or removed from the portfolio incrementally as new votes arrive, without rerunning the full MIP or greedy search?
- What is the relationship between portfolio structure and language typology or cognitive diversity? The finding that language family is the dominant heterogeneity axis hints at deeper connections to linguistic relativity and cross-lingual cognition (the authors gesture toward Boroditsky [2001] and Levinson [2003]), but no causal mechanism is established.
Why it matters for bot defense
For bot-defense and CAPTCHA practitioners, the most directly actionable insight is methodological: any system that ranks or scores users, bots, or models via aggregate pairwise feedback (e.g., human labelers rating CAPTCHA difficulty, red-team raters evaluating solver quality, or A/B tests comparing challenge variants) is subject to the same structured heterogeneity failure the authors document. If the user population is linguistically or culturally diverse — which it is for any global deployment — a single global Bradley-Terry score will wash out meaningful subgroup signal and produce rankings where the 'best' challenge design is statistically indistinguishable from many alternatives. The 72% vote cancellation rate observed in Arena is a cautionary benchmark for how severe this can be even in a relatively controlled pairwise-preference setting.
The (λ, ν)-portfolio framework is a potentially useful design tool for bot-defense teams managing ensembles of detection models or challenge variants. Rather than selecting the globally best-performing CAPTCHA or classifier, one could use the greedy or MIP portfolio construction to select a small set of 4-8 models that together cover a high fraction of the user population at an acceptable false-positive/false-negative threshold — effectively operationalizing per-user fairness in detection. The COMPAS blind-spot diagnostic application is particularly relevant: if certain user subpopulations (e.g., users from specific regions or language backgrounds) are systematically uncovered by the portfolio residual, this flags where the detection ensemble needs improvement rather than where the global metric looks worst.
Cite
@article{arxiv2605_06656,
  title={ Why Global LLM Leaderboards Are Misleading: Small Portfolios for Heterogeneous Supervised ML },
  author={ Jai Moondra and Ayela Chughtai and Bhargavi Lanka and Swati Gupta },
  journal={arXiv preprint arXiv:2605.06656},
  year={ 2026 },
  url={https://arxiv.org/abs/2605.06656}
}