
Mind the Gap? A Distributional Comparison of Real and Synthetic Priors for Tabular Foundation Models
Source: arXiv:2605.06343 · Published 2026-05-07 · By Alex O. Davies, Telmo de Menezes e Silva Filho, Nirav Ajmeri
TL;DR
This paper investigates whether the three classes of pre-training corpora used for Tabular Foundation Models (TFMs) — web-scraped tables (T4), curated benchmark tables (TabFM/FM), and synthetically generated tables (TabICL) — actually occupy similar regions of distributional space, and whether any gap between them matters for downstream in-context learning performance. The central motivation is that TFMs are expensive to train (TabPFN required 8 GPUs over two weeks), and the choice of pre-training corpus is largely made without empirical understanding of how these corpora compare. Prior work has evaluated models trained on these corpora against each other, but not directly measured the distributional relationships among the corpora themselves.
The authors characterise each corpus using hand-crafted aggregate features at the table, column, and inter-column level (d=70 for the full set), then measure pairwise distributional overlap using two lenses: XGBoost discriminator AUC (how easily can a classifier tell the two corpora apart?) and k-NN-based coverage metrics (what fraction of one corpus's feature space is 'reachable' from the other?). They find that the TabICL synthetic prior is nearly perfectly separable from both real corpora under all feature ablations, with recall (fraction of real tables covered by synthetic) consistently below 25%. An exhaustive 86,000-configuration grid search over TabICL's hyperparameters fails to close this gap — the minimum AUC across the entire search remains above 0.95.
The most surprising finding is the negative result for RQ4: despite the large and apparently irremovable distributional gap, proximity of a downstream test table to the synthetic prior — measured both with hand-crafted features and with TabICL's own internal row/column embeddings — shows no statistically significant correlation with TabICL's benchmark performance across 200+ TALENT classification datasets (all |r| < 0.17, all p > 0.05). The authors interpret this as evidence that SCM-based inductive biases, rather than distributional coverage of real-table space, are the primary driver of TabICL's generalisation, though they acknowledge this mechanistic account remains conjectural.
Key findings
- Discriminator AUC between TabICL synthetic tables and T4 web-scraped tables is 0.9997 ± 0.0001 (full feature set), effectively perfect separation; recall (fraction of T4 covered by TabICL) is only 8.82% at the default prior settings.
- Discriminator AUC between TabICL and the FM curated corpus is 0.9972 ± 0.0029 (full features), with recall of 16.04%, confirming the mismatch is not specific to web-scraped data.
- An exhaustive grid search over more than 86,000 TabICL prior hyperparameter configurations (parallelised over 6 nodes with 2 NVIDIA Grace CPU Superchips each, ~23 hours) yields a minimum AUC of >0.95 against T4; post-hoc validation at 1000 samples for the top-5 configurations resumes near-perfect AUC, indicating the gap is structural, not a tuning artifact.
- Curated (FM) and web-scraped (T4) corpora are broadly interchangeable at the distributional level: bidirectional coverage exceeds 83% in both directions (T4 ∈ FM = 97.48%, FM ∈ T4 = 83.02%), despite discriminator AUC of 0.9133, which reflects systematic source-level signatures rather than distributional non-overlap.
- Across 200+ TALENT benchmark classification datasets, correlation between proximity to the TabICL prior (in hand-crafted feature space) and TabICL's mean benchmark rank is r = 0.084 (p = 0.283); correlation with best relative AUC is r = 0.036 (p = 0.646) — none significant at p ≤ 0.05.
- Even using TabICL's own internal row and column embeddings as the proximity measure (the representation space from which predictions are directly derived), the correlation with rank is r = 0.138 (p = 0.078) for row embeddings and r = 0.138 (p = 0.078) for concatenated embeddings — still below significance, meaning distributional gap is not detectable as a performance driver even in the model's own representation.
- Partial correlation analyses controlling for dataset size, dimensionality, and class balance (Appendix E.2) confirm the null result holds across all three covariates, ruling out confounding by basic dataset characteristics.
- Precision (fraction of synthetic tables covered by real tables) is consistently near 1.0 (e.g., 0.988 for ICL vs. T4 full features), confirming that while synthetic tables occupy a narrow subspace, that subspace is itself real — it is the converse coverage failure (synthetic not covering real) that is the problem.
Methodology — deep read
The threat model and framing here are not adversarial in the security sense; rather, the 'adversary' is the implicit assumption in the TFM literature that distributional proximity between pre-training and deployment data is necessary for good generalisation. The paper is structured as a falsification attempt: if distributional gap were consequential, it should be measurable and predictive of performance. The authors adopt the position of a skeptical auditor checking whether the practitioner's intuition (closer distribution = better model) holds.
Data provenance and construction: Three corpora are studied. T4 is a trimmed version of the TabLib corpus (sourced from GitHub and CommonCrawl HTML), used to train Tabula-8B; it represents web-scraped tables. FM (TabFM corpus) is 384 Kaggle datasets (mixed classification and regression) filtered for row/column count and completeness, used to train TabFM. TabICL synthetic tables are generated on-the-fly from TabICL's open-source SCM-based generative prior, parameterised by a hyperparameter vector θ governing SCM type, tree model family, class balance, and categorical column probability. The key practical constraint noted by the authors is that TabPFN and Mitra do not release their prior parameters, making TabICL the only tractable subject for this analysis. For discriminator and coverage experiments, 1000 equal-sized samples are drawn from each corpus for primary analysis; grid search uses 200 samples for computational tractability, with post-hoc validation at 1000 for top configurations.
Feature engineering: Because tables vary in row count, column count, and column types, direct comparison is impossible without a unified representation. The authors construct five feature sets at different granularities. The 'Full' set (d=70) combines scalar table-level statistics (e.g., column count, skewness) with average histogram mean and standard deviation features. 'Scalars' (d=9) isolates distributional scalars excluding column count. 'Histograms' (d=60) uses only the average histogram mean and std features. 'Col. Hists' (d=50) applies cumulative histograms extracted per column and aggregated. 'Corr. Hists' (d=50) uses histograms over pairwise column correlations. Columns are treated as categorical if uniqueness ratio κ = |unique values|/|rows| < 0.2. All feature vectors are normalised to [0,1] for coverage computation. The choice of simple, intentionally non-learnt features for RQ1-3 is methodologically deliberate: if separation is detectable under a weak feature set, it is necessarily detectable under any more expressive one, so the strong separation results are lower bounds on the true divergence.
Discriminator protocol: For each pairwise comparison, tables from two corpora are embedded as ϕ(t) ∈ R^d and labelled 1 (real) or 0 (synthetic/other). XGBoost classifiers are trained on stratified splits of these labelled pairs. AUC is computed via 200-round bootstrapping (mean ± std reported). Self-comparison validation (two independent 1000-sample subsets from the same corpus) yields AUC ≈ 0.50 for all three corpora, confirming the metric is well-calibrated and the near-perfect AUCs on cross-corpus comparisons are not artifacts of imbalance or small sample size. For grid search discriminators, tree depth is reduced to 100 to avoid overfitting under the smaller 200-sample regime.
Coverage protocol: The coverage threshold δ_{0.95} is set as the 95th percentile of mean within-synthetic k-NN distances at k=5. A point p from corpus A is considered 'covered' by corpus B if its mean distance to its k=5 nearest neighbours in B does not exceed δ_{0.95}. Recall = fraction of real tables covered by synthetic; Precision = fraction of synthetic tables covered by real. The authors explicitly note that quantitative values are comparable only within the same feature/distance configuration and should be treated as directional bounds, not absolute characterisations. An ablation over k and δ is provided in Figure 3 to confirm robustness of the threshold choice.
Prior optimisation (RQ3): The TabICL prior hyperparameter space θ ∈ Θ is first explored with Bayesian optimisation (via Optuna) and a genetic optimiser, both targeting minimum discriminator AUC(θ) with N_eval=200 synthetic samples per evaluation. Neither converges meaningfully. A full grid search is then constructed at resolution G=6 evenly-spaced values per parameter, with conditional parameters included only where applicable, yielding >86,000 configurations. The grid is evaluated in parallel on 6 nodes (each with 2 NVIDIA Grace CPU Superchips) over ~23 hours. Top-5 AUC-minimising configurations are then re-evaluated at 1000 samples with 5 runs each for robustness. A subsequent Bayesian optimisation using a joint AUC + coverage loss (Equation 6 in the paper, combining AUC minimisation with recall/precision objectives) is also attempted against both FM and T4, with the same null result.
Performance correlation analysis (RQ4): TabICL and a suite of classical models (details in Appendix D) are applied to 200+ TALENT benchmark classification datasets. For each benchmark table, the authors compute (i) 5-NN distance to the TabICL training prior using each of the five feature sets, and (ii) 5-NN distance using TabICL's internal row embeddings, column embeddings, and their concatenation. Three performance metrics are computed: rank of TabICL among all models, mean relative AUC (AUCICL / mean(AUCbench)), and best relative AUC (AUCICL / max(AUCbench)). Pearson r and p-values are reported for each distance × performance metric combination (Table 2). Statistical power analysis is noted: with 200 datasets and power ≥ 0.8 at p ≤ 0.05, the test can detect |r| > 0.2, providing a meaningful lower bound on detectable effect size. A replication on the non-overlapping TabArena benchmark (fewer tables, Appendix E.1) yields the same null result. Code is released on GitHub.
Technical innovations
- Application of generative-modelling coverage metrics (k-NN recall/precision from Naeem et al. and Kynkäänniemi et al.) to the cross-corpus comparison problem in tabular foundation model pre-training data, rather than to evaluating generative model output quality as in prior use.
- The 86,000-configuration exhaustive grid search over TabICL's SCM-based prior hyperparameter space, demonstrating that the synthetic-real distributional gap is structural and not resolvable by prior tuning — a much stronger negative result than prior qualitative claims about synthetic prior limitations.
- Use of a target model's own internal embeddings (TabICL row and column representations) as a proximity measure for the performance-correlation analysis, providing a distribution-shift test that is maximally relevant to the specific model's decision process rather than relying solely on external feature spaces.
- Characterisation of the curated-vs-web-scraped overlap as high bidirectional coverage despite high discriminator AUC, explicitly distinguishing between population-level distributional similarity (coverage) and individual-sample distinguishability — a nuance typically collapsed in prior corpus comparison work.
Datasets
- T4 (web-scraped) — trimmed version of TabLib, size not precisely specified in truncated text but described as orders of magnitude larger than curated alternatives — sourced from GitHub and CommonCrawl HTML via the T4/Tabula-8B pipeline
- TabFM / FM (curated) — 384 Kaggle datasets (mixed classification and regression) — assembled by Wen et al. [26], non-public original source but drawn from public Kaggle competitions
- TabICL synthetic prior — generated on-demand via open-source TabICL SCM-based prior code — no fixed size; 200 or 1000 tables sampled per experimental condition
- TALENT benchmark — 200+ classification datasets — used for downstream performance correlation analysis (RQ4); described as curated to reflect broad downstream applications
- TabArena benchmark — fewer tables than TALENT, exact count not specified in truncated text — used as non-overlapping replication set in Appendix E.1
Baselines vs proposed
- Self-comparison (T4 subset vs T4 subset): Discriminator AUC = 0.498 ± 0.015, Recall = 0.940, Precision = 0.957 — confirms metric calibration at chance level
- Self-comparison (ICL subset vs ICL subset): Discriminator AUC = 0.501 ± 0.037, Recall = 0.944, Precision = 0.963
- Self-comparison (FM subset vs FM subset): Discriminator AUC = 0.500 ± 0.009, Recall = 0.938, Precision = 0.955
- ICL vs T4 (Full features, unoptimised): AUC = 0.9997 ± 0.0001, Recall = 0.0882, Precision = 0.9880
- ICL vs FM (Full features, unoptimised): AUC = 0.9972 ± 0.0029, Recall = 0.1604, Precision = 0.9780
- T4 vs FM (Full features, unoptimised): AUC = 0.9133 ± 0.0237, Recall = 0.9748, Precision = 0.8302
- Grid search best config (ICL vs T4, Full features, rank 1 of 86k+, validated at 1000 samples): AUC = 0.9989 ± 0.0013, Recall = 0.063, Precision = 0.996 — vs unoptimised AUC = 0.9997
- Bayesian optimised (joint loss, ICL vs T4, best run): AUC = 0.997 ± 0.006, Recall = 0.218, Precision = 0.978 — marginal recall improvement from 8.82% to 21.8%, AUC essentially unchanged
- ICL vs T4 (Scalars only, d=9): AUC = 0.9991 ± 0.0002, Recall = 0.0854, Precision = 0.9318
- ICL vs T4 (Col. Hists, d=50): AUC = 0.977 ± 0.003, Recall = 0.250, Precision = 0.987
- ICL vs T4 (Corr. Hists, d=50): AUC = 0.988 ± 0.011, Recall = 0.187, Precision = 1.00
Figures from the paper
Figures are reproduced from the source paper for academic discussion. Original copyright: the paper authors. See arXiv:2605.06343.
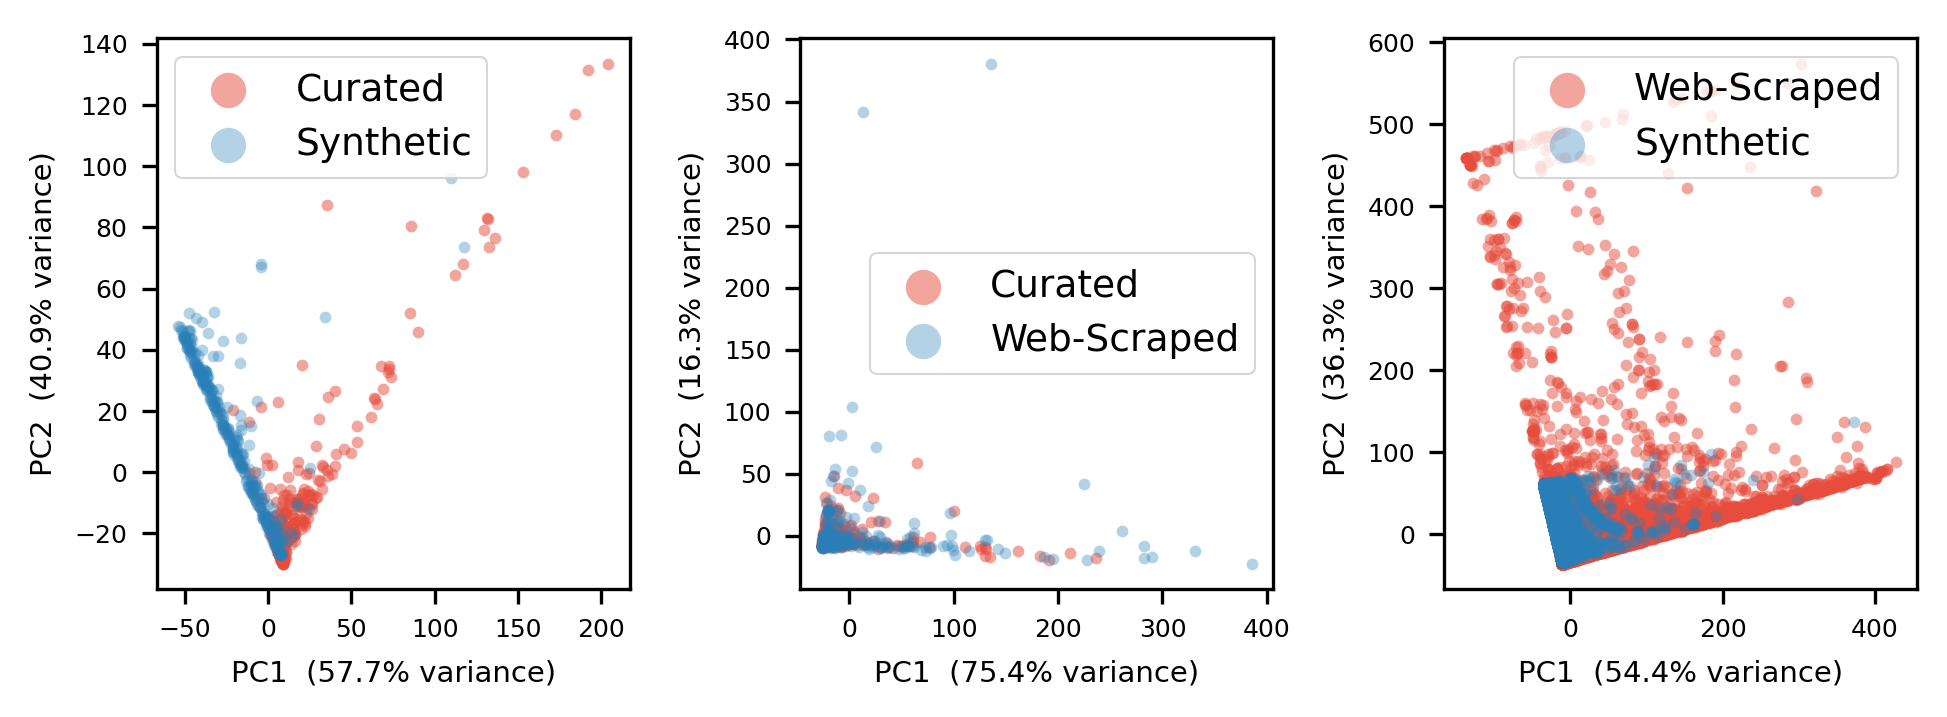
Fig 1: PCA projections of cumulative histograms for the Curated, Web-Scraped and Synthetic
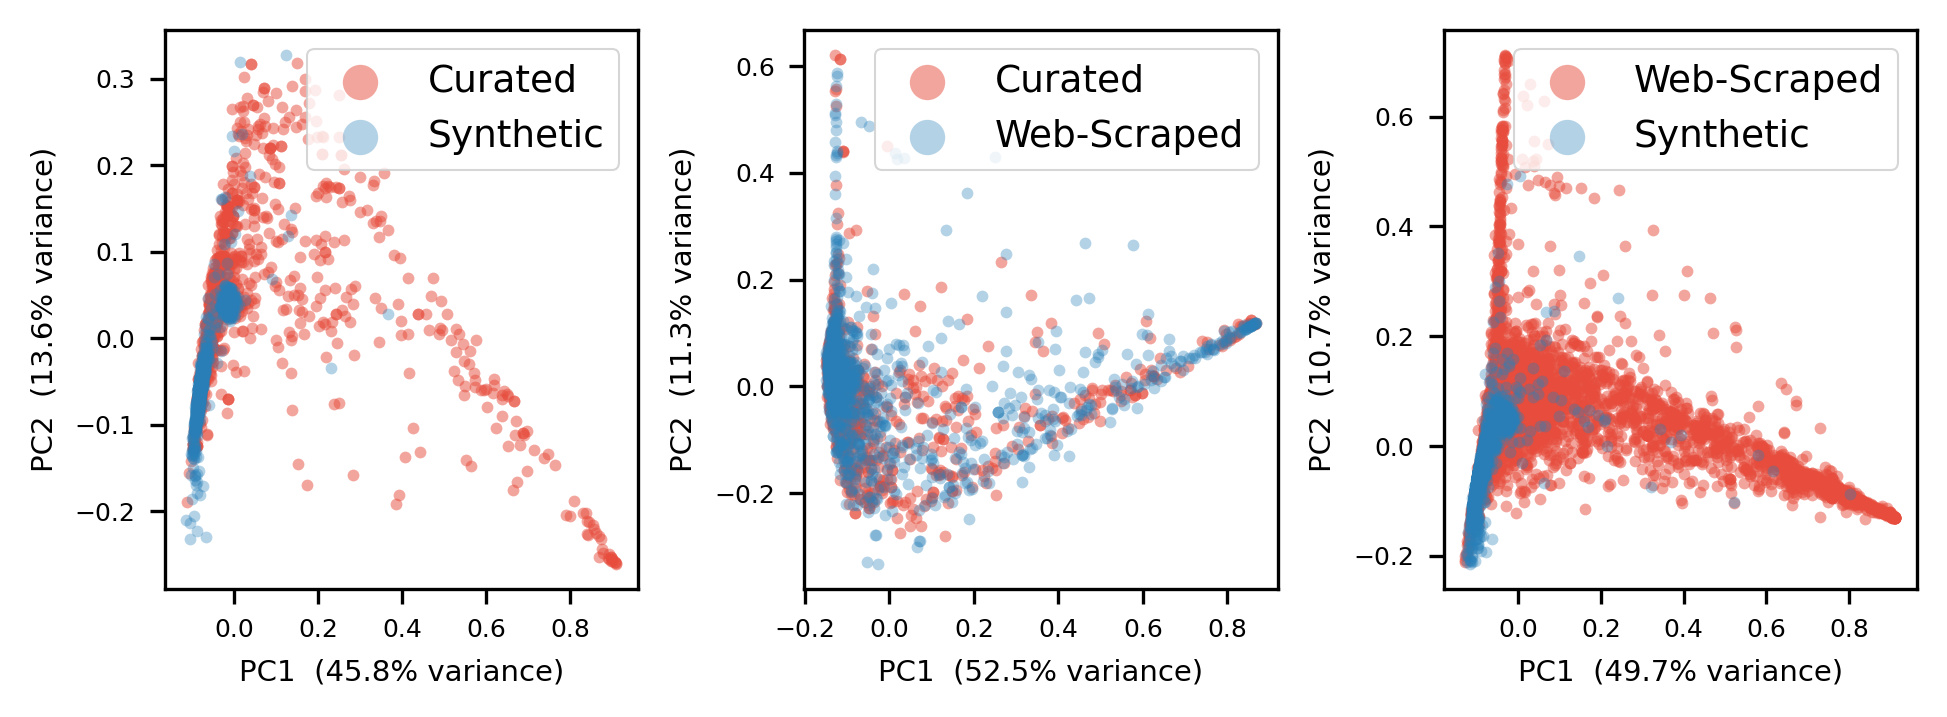
Fig 2: PCA projections of cumulative histograms for the curated FM dataset, the web-scraped T4
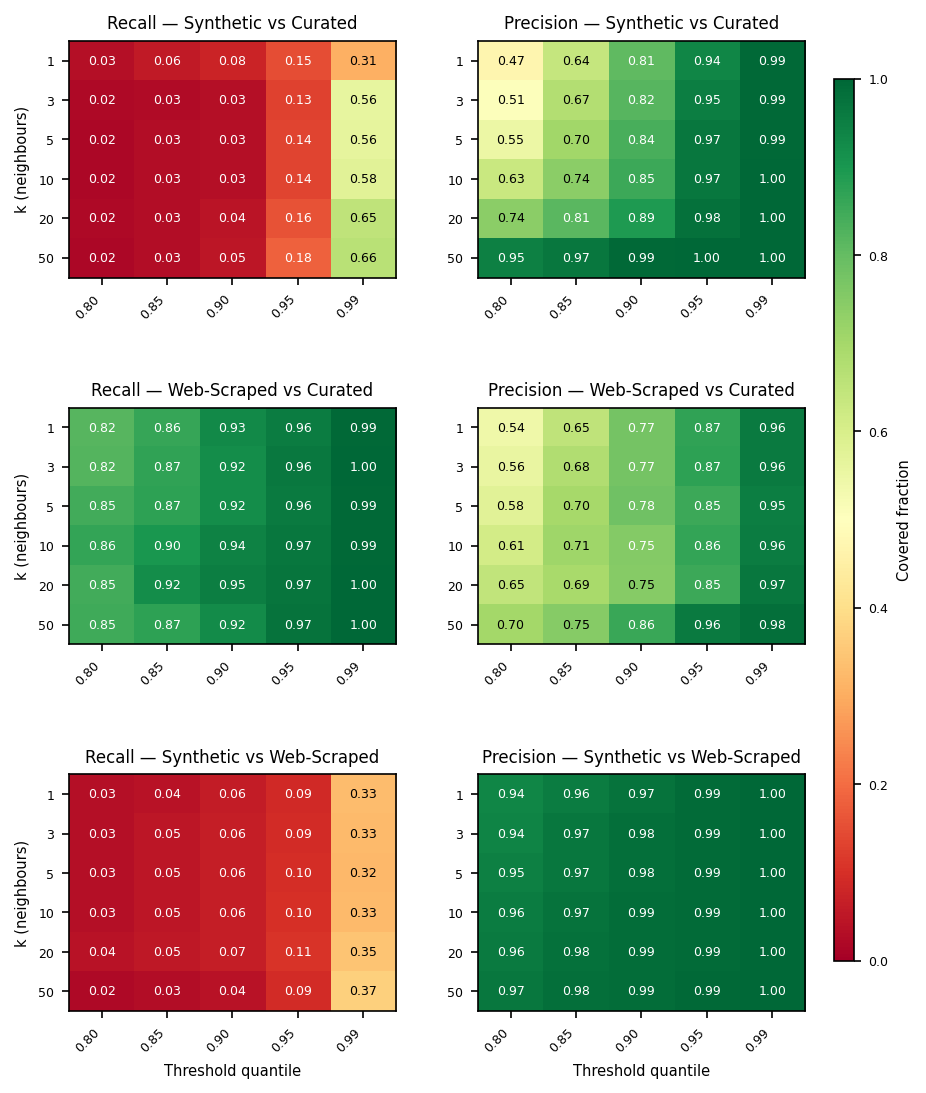
Fig 3: Our ablation study over the number of neighbours k and threshold δk for recall and precision
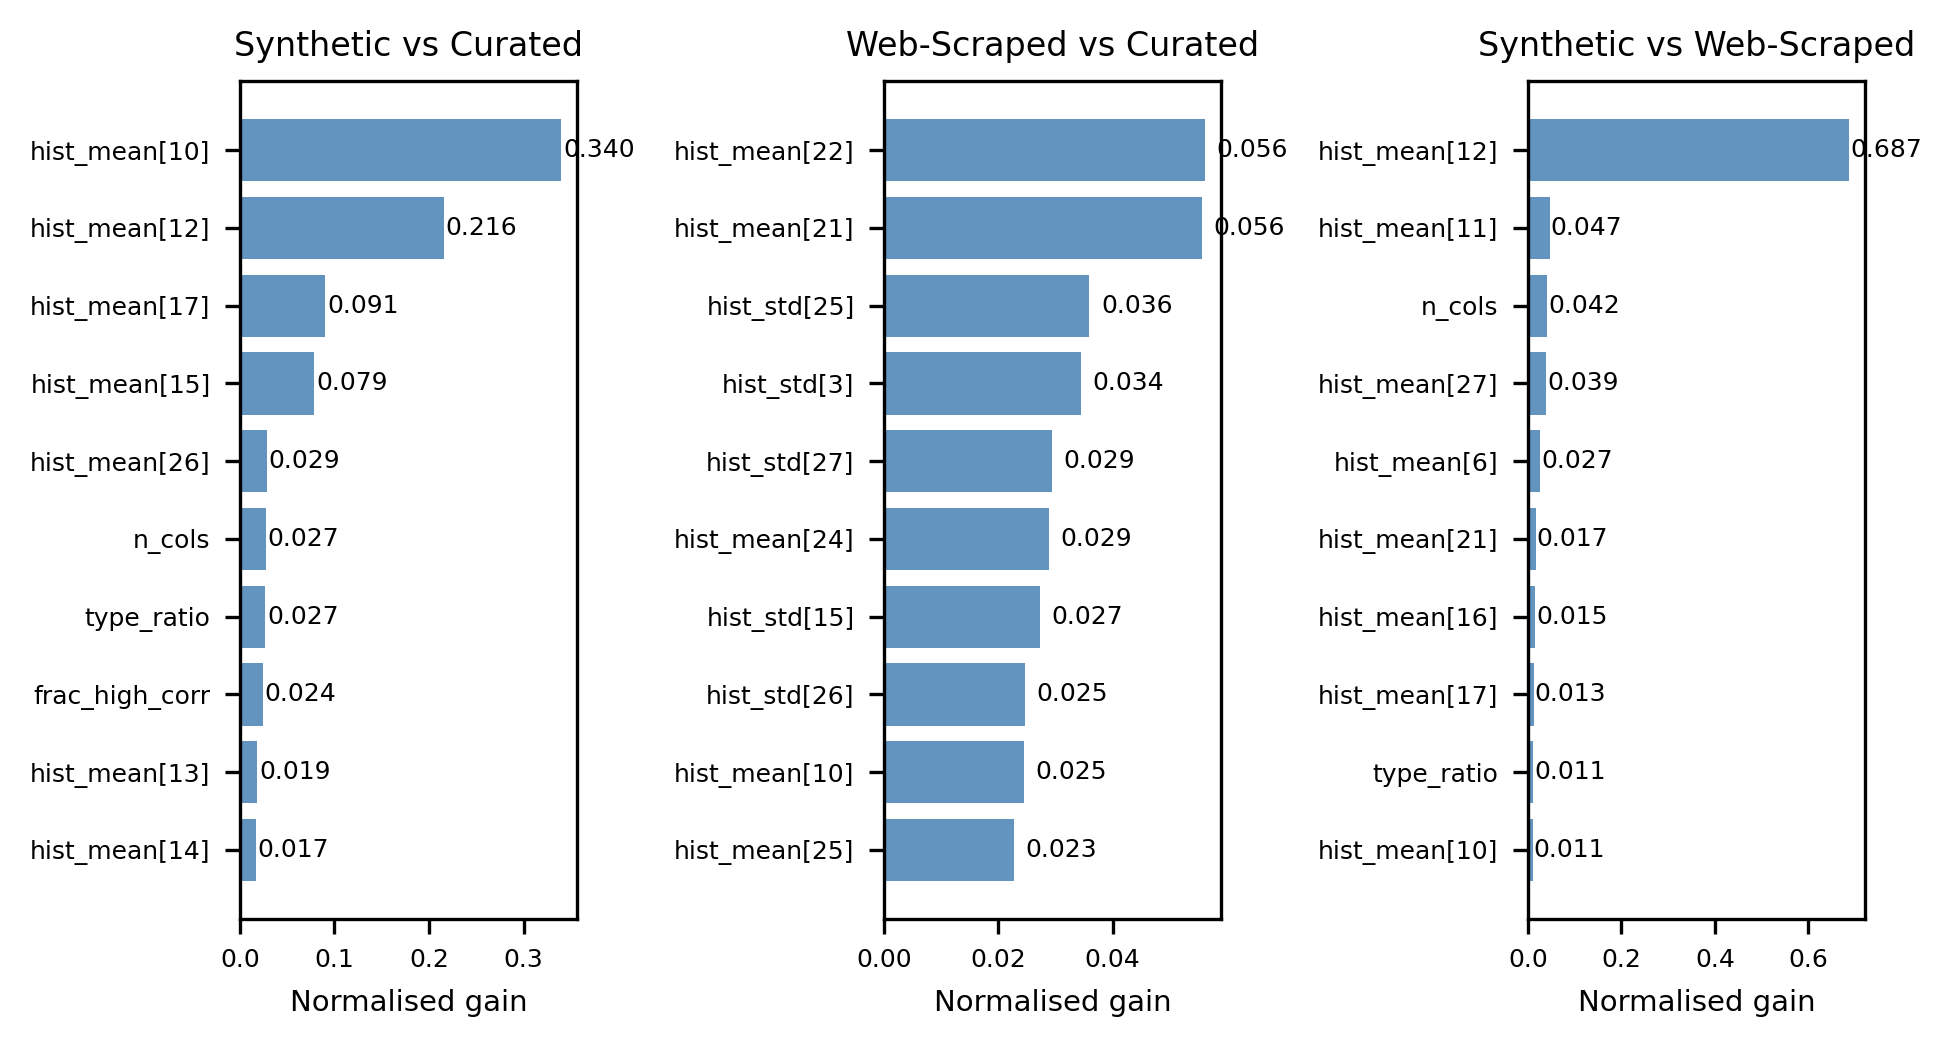
Fig 4: Feature importances, assessed from performance gains through tree splits, for each pairwise
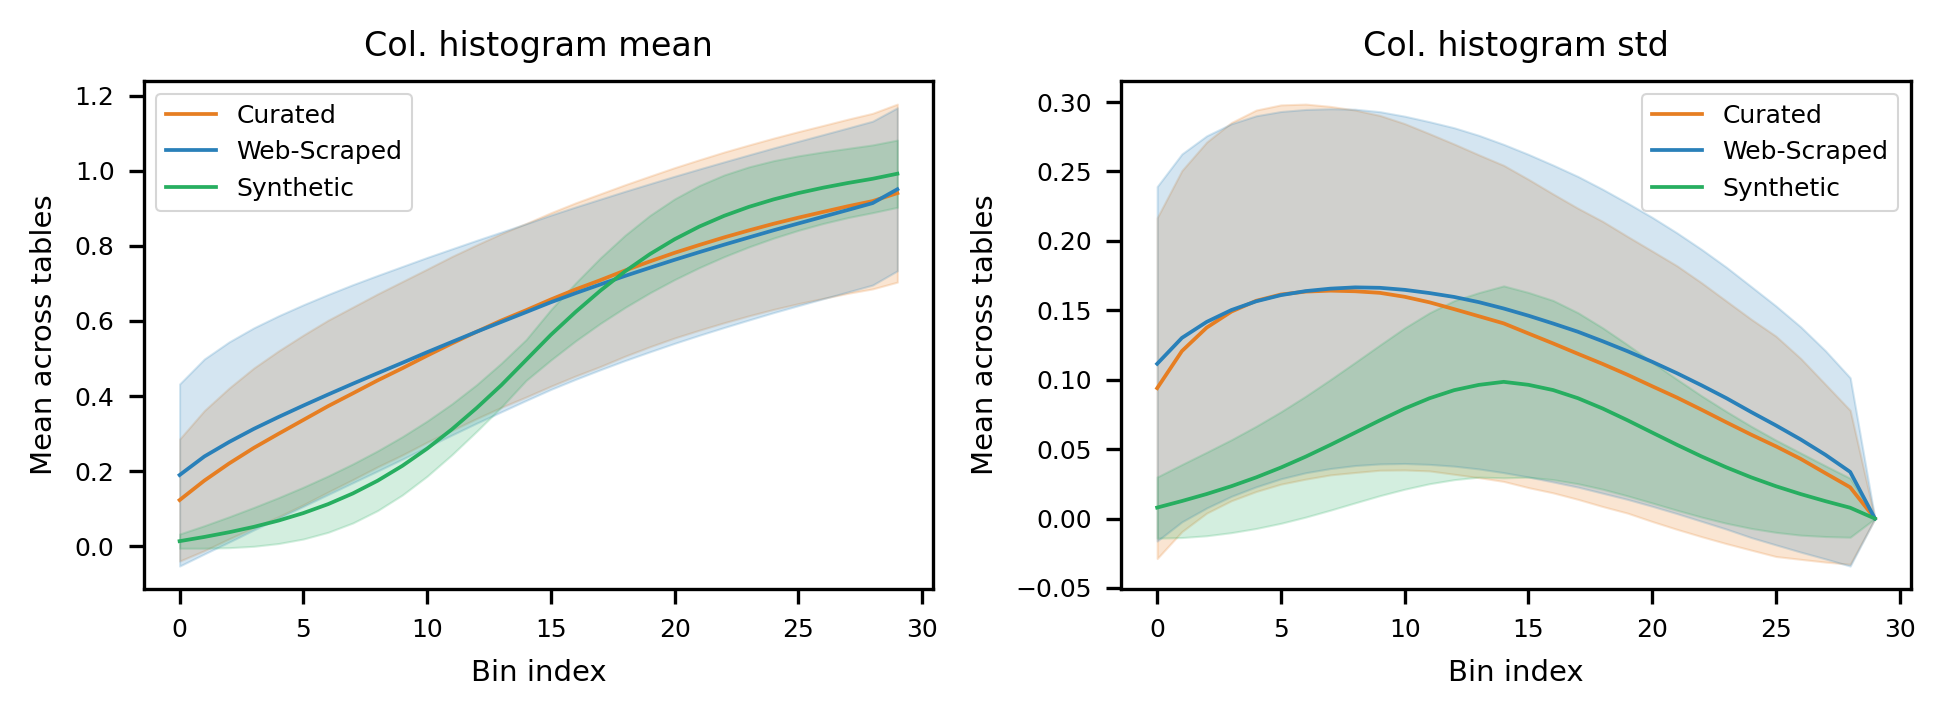
Fig 5: Example visualisations of our aggregate column histogram features. Left: Mean bin values
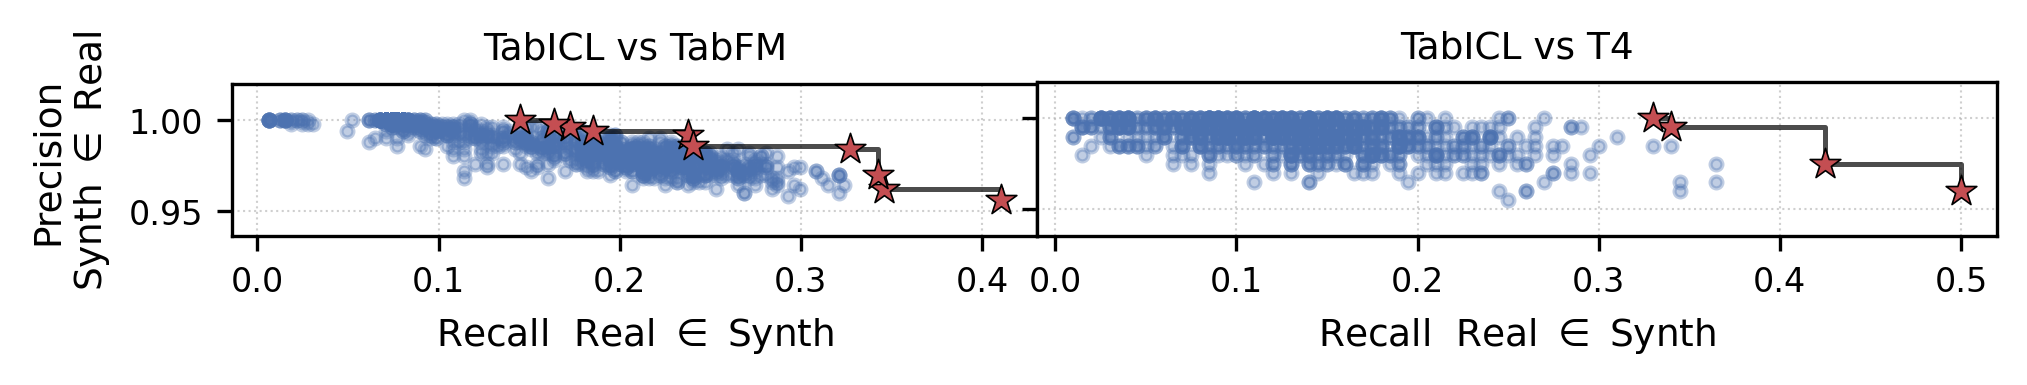
Fig 6: Recall and Precision for optimising the ICL prior to match the FM and T4 datasets, towards
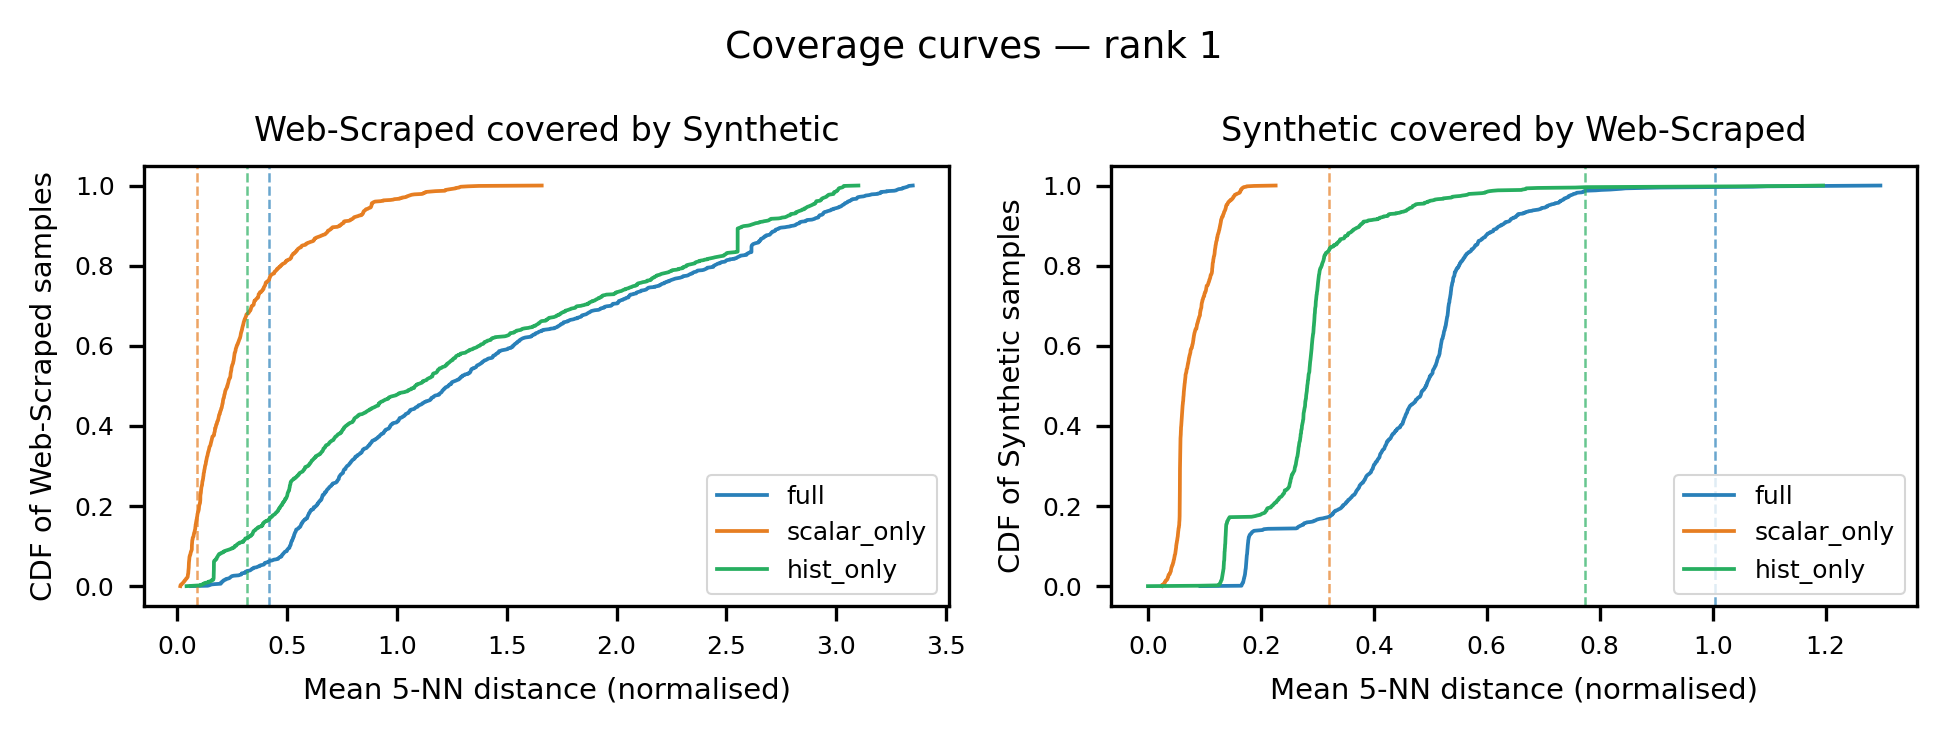
Fig 7: Cumulative coverage curves for ICL over T4 (left) and T4 over ICL (right).
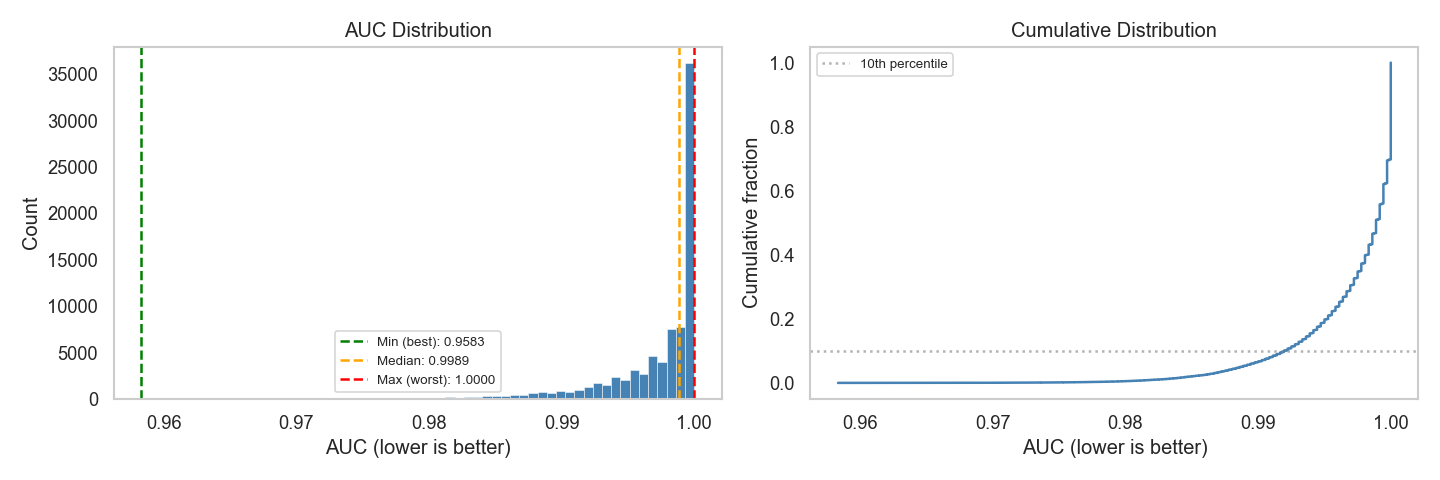
Fig 8: A histogram and a cumulative histogram of AUC values over our grid search.
Limitations
- Only one synthetic prior (TabICL) is analysed in depth because TabPFN and Mitra do not release prior parameters or data-generation code; the claim that findings generalise to other SCM-based priors is explicitly conjectural, not empirically verified.
- Grid search resolution G=6 and sample size N=200 for evaluation within the search are constrained by compute budget; while post-hoc validation at N=1000 is performed for top-5 configurations, the search may miss narrow high-performing regions of Θ at finer resolution.
- The performance correlation analysis (RQ4) uses 200+ TALENT datasets and detects correlations |r| > 0.2; moderate effect sizes (e.g., r ≈ 0.15–0.19) would go undetected at this sample size, meaning a weak but practically meaningful relationship cannot be fully ruled out.
- Hand-crafted features (d=70) are intentionally simple and may not capture all distributional dimensions relevant to model performance; the authors partially address this with TabICL embeddings for RQ4, but the feature design for RQ1–3 is not validated against a richer learned representation.
- The paper does not evaluate performance impact for TFMs other than TabICL (e.g., TabPFN, Tabula-8B, TabFM); it is possible that models trained on real corpora show different proximity-performance relationships, limiting generalisability of the RQ4 null result.
- The TALENT and TabArena benchmarks may themselves be biased toward distributions where TabICL already performs well (survivor bias in benchmark construction), potentially obscuring performance degradation at the distribution's tails.
- Causal interpretation of the null RQ4 result is limited: the two proposed mechanisms (ICL robustness to distributional shift; SCM inductive bias as implicit regularisation) are presented as conjectures with no ablation or intervention experiment to distinguish them, explicitly deferred to future work due to computational constraints.
Open questions / follow-ons
- What mechanism explains the robustness of TabICL's in-context learning performance to pre-training distributional shift? Specifically, does the SCM-based inductive bias (causal graph structure, tree mechanisms) transfer as a form of implicit regularisation independent of low-level distributional alignment, and can this be isolated by pre-training on deliberately degraded or alternative priors?
- Would the same distributional gap and null performance result hold for TFMs trained on real corpora (T4/FM)? If proximity to a real pre-training corpus also shows no correlation with downstream performance, it would suggest the coverage account is wrong for TFMs generally; if it does correlate, the null result may be specific to synthetic-prior ICL models.
- Can a hybrid prior — one that mixes SCM-generated tables with real tables subsampled to cover underrepresented regions of the feature space — improve both coverage and downstream performance, and is the performance gain (if any) attributable to coverage improvement or to other properties of the added data?
- Given that curated and web-scraped corpora are broadly interchangeable at the distributional level but individually distinguishable, what are the downstream consequences of the systematic source-level signatures (curation filtering artifacts, web-scraping noise) that drive discriminator AUC to 0.91 even at high bidirectional coverage?
Why it matters for bot defense
For bot-defense and CAPTCHA practitioners, the most directly applicable insight is methodological rather than architectural: the discriminator-AUC plus k-NN coverage framework the authors use to audit pre-training corpora is a reusable tool for any setting where a practitioner needs to ask 'does my training distribution actually cover the deployment distribution?' In bot-defense, this question arises constantly — behavioral biometrics models trained on lab-collected human interaction data, challenge-response classifiers trained on historical bot traffic, or risk-scoring models trained on known fraud labels all face versions of the synthetic-to-real gap studied here. The paper provides a concrete, computationally cheap recipe (aggregate table features, XGBoost discriminators, k-NN recall/precision with a 95th-percentile threshold) for detecting and quantifying this gap before deploying a model, which is considerably cheaper than discovering the gap through production degradation.
The null RQ4 result deserves scrutiny from a bot-defense angle. The finding that distributional gap does not predict performance in the model's own embedding space is specific to in-context learning models with SCM-based pre-training; it should not be generalised to supervised classifiers (e.g., gradient-boosted bot detectors or behavioral biometric models) where training distribution coverage is empirically well-established as a driver of OOD degradation. More relevantly, if a bot-defense team is evaluating whether to adopt a tabular foundation model for, say, risk scoring on heterogeneous feature tables without retraining, this paper provides modest reassurance that distributional distance from the pre-training prior is not the primary failure mode to monitor — but it does not eliminate the need for empirical validation on held-out adversarial or distribution-shifted traffic, and the authors' own caveat about effect sizes below |r|=0.2 remaining undetectable should give practitioners pause before treating the null result as a green light.
Cite
@article{arxiv2605_06343,
  title={ Mind the Gap? A Distributional Comparison of Real and Synthetic Priors for Tabular Foundation Models },
  author={ Alex O. Davies and Telmo de Menezes e Silva Filho and Nirav Ajmeri },
  journal={arXiv preprint arXiv:2605.06343},
  year={ 2026 },
  url={https://arxiv.org/abs/2605.06343}
}