
Improving Variance Estimation for Covariate Adjustment with Binary Outcomes
Source: arXiv:2605.06655 · Published 2026-05-07 · By Kaitlyn Lee, Alex Ocampo, Courtney Schiffman, Michael Friesenhahn, Christina Rabe, Michael Rosenblum
TL;DR
This paper addresses a specific but practically important gap in the clinical trial statistics literature: reliable variance estimation for the standardized (g-computation) average treatment effect estimator when binary outcomes are rare or sample sizes are small. The authors are motivated by FDA 2023 covariate adjustment guidance, which recommends standardization but does not fully resolve the variance estimation problem. Existing influence-function (IF) plug-in estimators and related methods (e.g., ANHECOVA as in RobinCar2) are shown to underestimate variance in finite-sample regimes — particularly when event rates are low or N is small — because the fitted outcome model overfits the training data, causing residuals (Yi - mu_hat) to be artificially small and thus the estimated variance to be downward biased.
The proposed solution is the IF-LOO estimator: an influence-function-based variance estimator that replaces in-sample predictions with leave-one-out (LOO) predictions, so that when computing the influence function contribution for individual i, the outcome model is retrained on all n-1 other observations. This prevents the residual shrinkage that causes variance underestimation. The authors derive a closed-form expression, prove sqrt(n) consistency and asymptotic normality, and implement it in R with code released in supplementary materials.
Simulation results across two scenarios — (1) N=250, 2.5% placebo event rate and (2) N=50, 25% placebo event rate — with 10,000 replicates each demonstrate that IF-LOO achieves near-nominal 95% coverage and proper type-I error control across all tested true ATE values (0%, 2.5%, 5%, 10%, 15%), while IF plug-in and RobinCar2 exhibit substantial undercoverage (type-I error up to 18.35% at alpha=0.05 in the N=50 scenario). Nonparametric bootstrap matches IF-LOO on coverage but is stochastic, slower, and susceptible to complete-separation failures in small samples.
Key findings
- In the N=50, placebo rate=25% scenario, IF Plug-In yields type-I error of 18.35% and RobinCar2 yields 17.18% at the null (ATE=0%), versus IF-LOO's 6.89% and bootstrap's 4.88%, all at nominal alpha=0.05 (Table 2).
- In the same N=50 scenario, IF Plug-In coverage ranges from 83.17% to 86.88% across non-null ATEs (2.5%-15%), while IF-LOO stays between 93.37% and 93.88%, bootstrap between 95.13% and 95.42%, all versus nominal 95% (Table 2).
- In the N=250, placebo rate=2.5% scenario, IF Plug-In type-I error is 11.83% and RobinCar2 is 11.80% at the null, compared to IF-LOO's 5.52% and the unadjusted analysis's 5.29% (Table 1).
- In the N=250 scenario, IF Plug-In coverage at ATE=2.5% is 91.14% and RobinCar2 is 91.43%, while IF-LOO achieves 94.35% coverage, showing undercoverage persists even at moderate sample sizes when event rates are low (Table 1).
- IF-LOO converges in coverage to approximately 94.83% at ATE=15% in the N=250 scenario while IF Plug-In reaches only 93.56%, confirming the LOO correction remains relevant even as ATE grows in the low-event-rate setting (Table 1).
- The nonparametric bootstrap (1000 samples) matches or slightly exceeds IF-LOO in coverage in both scenarios but exhibits Monte Carlo variability, is susceptible to complete-separation failures in small samples causing invalid bootstrap distributions, and is not deterministic — making it less suitable for double-coded clinical trial programming.
- The IF-LOO estimator has a closed-form expression (Equation 7 in the paper), requires only n additional logistic regression fits (one per subject), and is proven sqrt(n) consistent and asymptotically normal under Conditions 1-4 (Appendix A), distinguishing it from bootstrap-based approaches.
- A correctly specified working model, while optimal for point estimation efficiency, is precisely the regime most prone to variance underestimation by IF plug-in methods because overfitting of residuals is maximized — the simulations deliberately use a correctly specified model to stress-test this worst case.
Methodology — deep read
The threat model and inferential setting are not adversarial in a security sense but rather statistical: the adversary is finite-sample bias in variance estimators. The assumed setting is a 1:1 randomized controlled trial (or any known randomization probability pi_0) under the potential outcomes framework (Neyman-Rubin). The estimand is the marginal average treatment effect (ATE) as a risk difference. Key assumptions are: iid observations, no unmeasured confounding (guaranteed by randomization), consistency of potential outcomes, and existence of a population maximizer beta* of the expected logistic log-likelihood. The working logistic regression model need not be correctly specified for point estimation consistency, but simulations deliberately use a correctly specified model to isolate the worst case for variance underestimation.
The data for simulation are entirely synthetic, generated from two parametric data-generating processes (DGPs). DGP 1: N=250, six independent baseline covariates (four continuous, two binary), binary outcome with log-odds linear in all six covariates plus treatment, marginal placebo event rate 2.5%. DGP 2: N=50, same covariate structure, marginal placebo event rate 25%. True ATEs of 0%, 2.5%, 5%, 10%, and 15% are evaluated. The true marginal causal risk difference (which is not directly a logistic regression parameter) is computed via Gaussian quadrature (Ocampo et al., 2026) rather than Monte Carlo, ensuring exact ground truth. Each DGP-ATE combination is replicated 10,000 times. R code is released in supplementary materials.
The standardized estimator (g-computation) proceeds in three steps: (1) fit logistic regression mu_hat(A,X) = expit(beta_0 + beta_A*A + beta_X'*X) on all n observations via MLE; (2) for each individual i, compute counterfactual predictions Y_i_hat(1) = mu_hat(1, X_i) and Y_i_hat(0) = mu_hat(0, X_i); (3) the ATE estimate is the average difference of these predictions across all n subjects. The existing IF plug-in variance estimator (Rosenblum & van der Laan, 2010) plugs mu_hat directly into the empirical variance of the influence function, which involves residuals (Y_i - mu_hat(A_i, X_i)). When the model fits well (especially with a correctly specified model and small n), these residuals are artificially small, yielding downward-biased variance estimates.
The proposed IF-LOO estimator modifies the IF plug-in by replacing mu_hat(A_i, X_i) with mu_hat_{-i}(A_i, X_i): predictions from a logistic regression fit on all data except observation i. Specifically, for each i from 1 to n, a separate logistic regression is fitted on n-1 observations, generating leave-one-out counterfactual predictions mu_hat_{-i}(1, X_i) and mu_hat_{-i}(0, X_i) and leave-one-out residual (Y_i - mu_hat_{-i}(A_i, X_i)). The leave-one-out influence function value phi_hat_{-i} is then computed using these out-of-sample predictions, and the IF-LOO variance estimate is (1/n^2) * sum_i phi_hat_{-i}^2. The closed-form expression requires exactly n logistic regression fits (one leave-one-out model per subject), making it deterministic and computationally tractable, though O(n) times more expensive than the plug-in. The authors note this is conceptually analogous to LOO cross-validation in predictive modeling and to the LOO strategy of Colantuoni & Rosenblum (2015) for assessing precision gains.
Theoretical guarantees are provided in Theorem 1: under four regularity conditions (stated in Appendix A, not fully visible in the provided text but standard semiparametric theory conditions), sqrt(n)*(V_hat_IF-LOO - V_0) converges in distribution to N(0, W) where W = Var(phi(O)^2). This ensures the IF-LOO variance estimator is sqrt(n) consistent and asymptotically normal. The proof is in Appendix A.
Evaluation uses two primary metrics: empirical coverage of the normal-based 95% confidence interval (theta_hat ± 1.96 * sigma_hat) across 10,000 replicates, and type-I error (proportion of replicates rejecting the null at alpha=0.05 under ATE=0). Secondary metrics include estimated standard deviation (Est. SD, the mean of sigma_hat across replicates) versus empirical SE (the empirical standard deviation of ATE point estimates across replicates), which together reveal whether coverage errors stem from bias in the variance estimator. Baselines are: IF plug-in (Rosenblum & van der Laan, 2010), RobinCar2 ANHECOVA (Li et al., 2026, implementing Ye et al. 2023 style estimator), nonparametric bootstrap with 1000 samples (Efron, 1979), and unadjusted difference-in-means with Bernoulli plug-in variance. No held-out test set is relevant here (all synthetic). A small number of replicates (0.05%-0.6%) were excluded jointly across all estimators when RobinCar2 threw numerical errors, avoiding favoritism. No formal statistical tests for differences between estimators are reported; comparison is purely by empirical coverage and type-I error rates across 10,000 replicates.
Technical innovations
- The IF-LOO variance estimator (Equation 7) extends the standard influence-function plug-in of Rosenblum & van der Laan (2010) by using leave-one-out refitted logistic models for each subject's residual and counterfactual predictions, eliminating the in-sample overfitting that causes downward bias in the plug-in variance under small n or rare events.
- A closed-form expression for the IF-LOO variance is derived (Equation 7 and the running Example 1), making the estimator fully deterministic given the data — unlike the nonparametric bootstrap which requires random resampling and can fail under complete separation.
- The paper proves sqrt(n) consistency and asymptotic normality of IF-LOO (Theorem 1) under standard semiparametric regularity conditions, providing the theoretical grounding absent from purely heuristic LOO or jackknife variance corrections.
- The use of Gaussian quadrature (rather than Monte Carlo simulation) to compute the exact true marginal causal risk difference as ground truth in the simulation study is a methodological contribution enabling precise evaluation of estimator bias without simulation noise contaminating the benchmark.
Baselines vs proposed
- IF Plug-In (Rosenblum & van der Laan, 2010): Type-I error = 18.35% vs IF-LOO: 6.89% (N=50, placebo rate=25%, ATE=0%, alpha=0.05, Table 2)
- RobinCar2 ANHECOVA (Li et al., 2026 / Ye et al., 2023): Type-I error = 17.18% vs IF-LOO: 6.89% (N=50, placebo rate=25%, ATE=0%, Table 2)
- Nonparametric Bootstrap (1000 samples): Type-I error = 4.88% vs IF-LOO: 6.89% (N=50, placebo rate=25%, ATE=0%, Table 2)
- IF Plug-In: Coverage at ATE=2.5% = 83.17% vs IF-LOO: 93.51% (N=50, placebo rate=25%, Table 2)
- RobinCar2: Coverage at ATE=2.5% = 84.16% vs IF-LOO: 93.51% (N=50, placebo rate=25%, Table 2)
- Bootstrap: Coverage at ATE=2.5% = 95.36% vs IF-LOO: 93.51% (N=50, placebo rate=25%, Table 2)
- IF Plug-In: Type-I error = 11.83% vs IF-LOO: 5.52% (N=250, placebo rate=2.5%, ATE=0%, Table 1)
- RobinCar2: Coverage at ATE=2.5% = 91.43% vs IF-LOO: 94.35% (N=250, placebo rate=2.5%, Table 1)
- Bootstrap: Coverage at ATE=2.5% = 95.64% vs IF-LOO: 94.35% (N=250, placebo rate=2.5%, Table 1)
Figures from the paper
Figures are reproduced from the source paper for academic discussion. Original copyright: the paper authors. See arXiv:2605.06655.
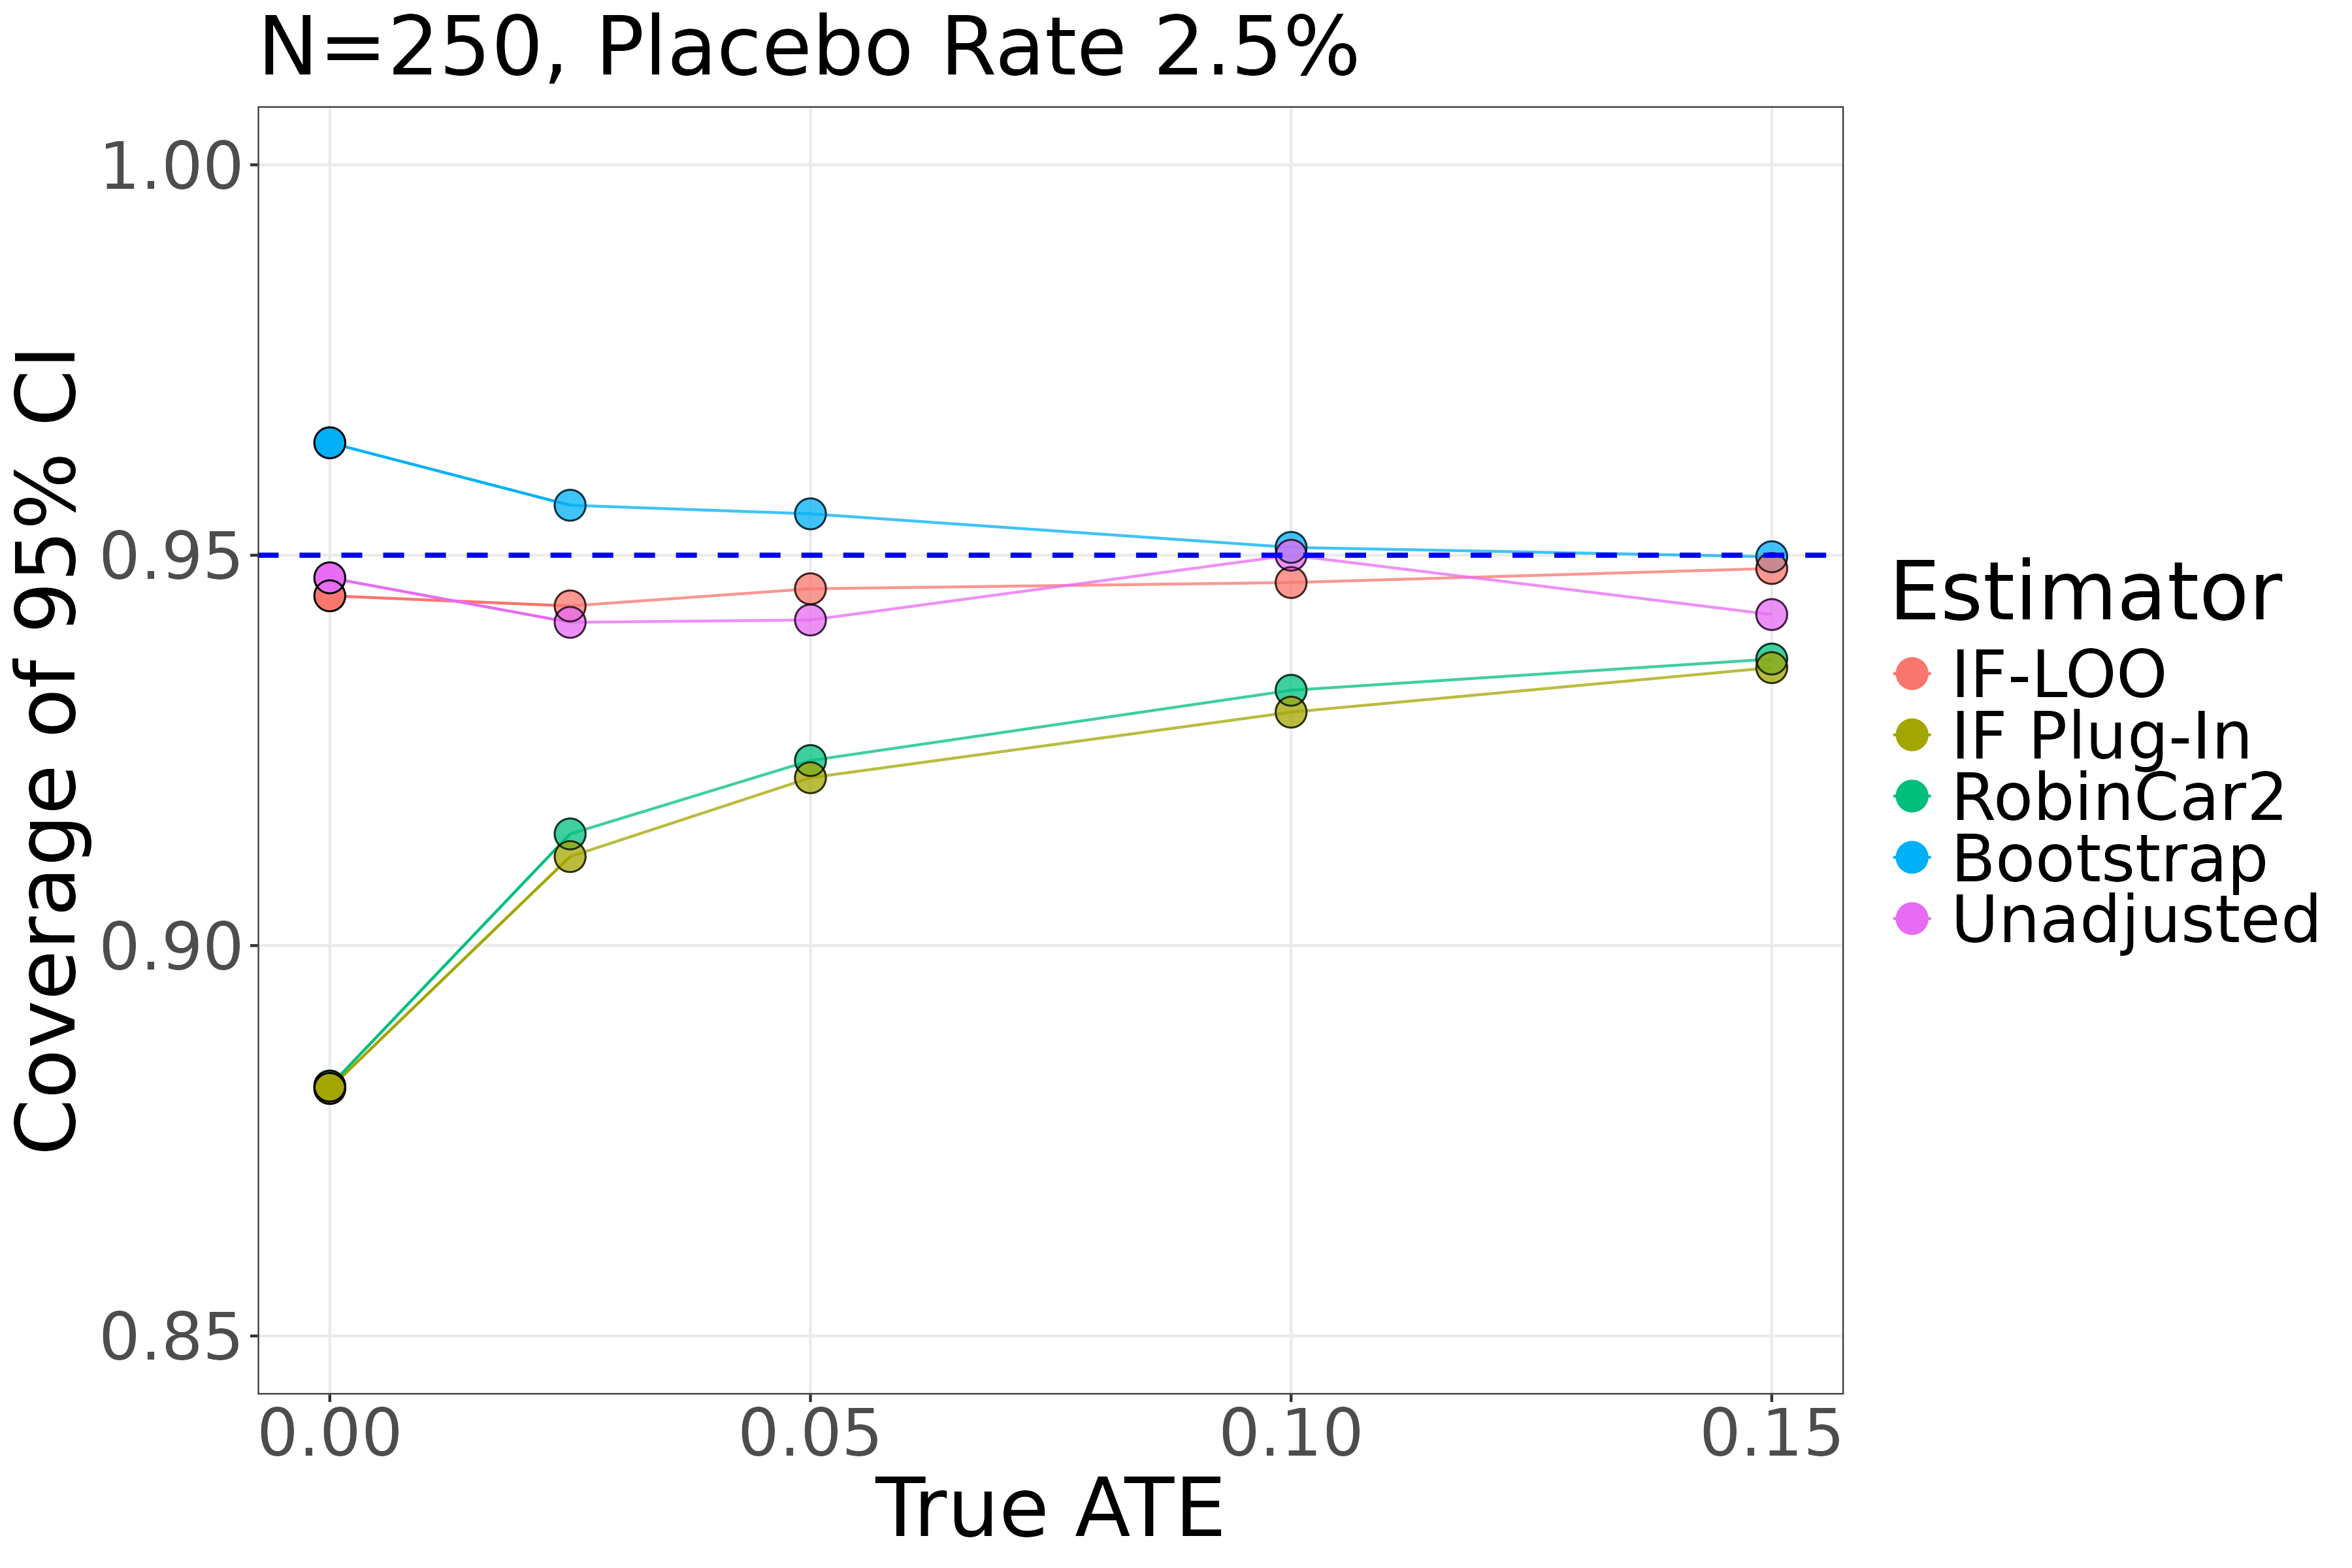
Fig 1: Simulation results for N = 250 with a placebo rate of 2.5%. The x-axis displays the
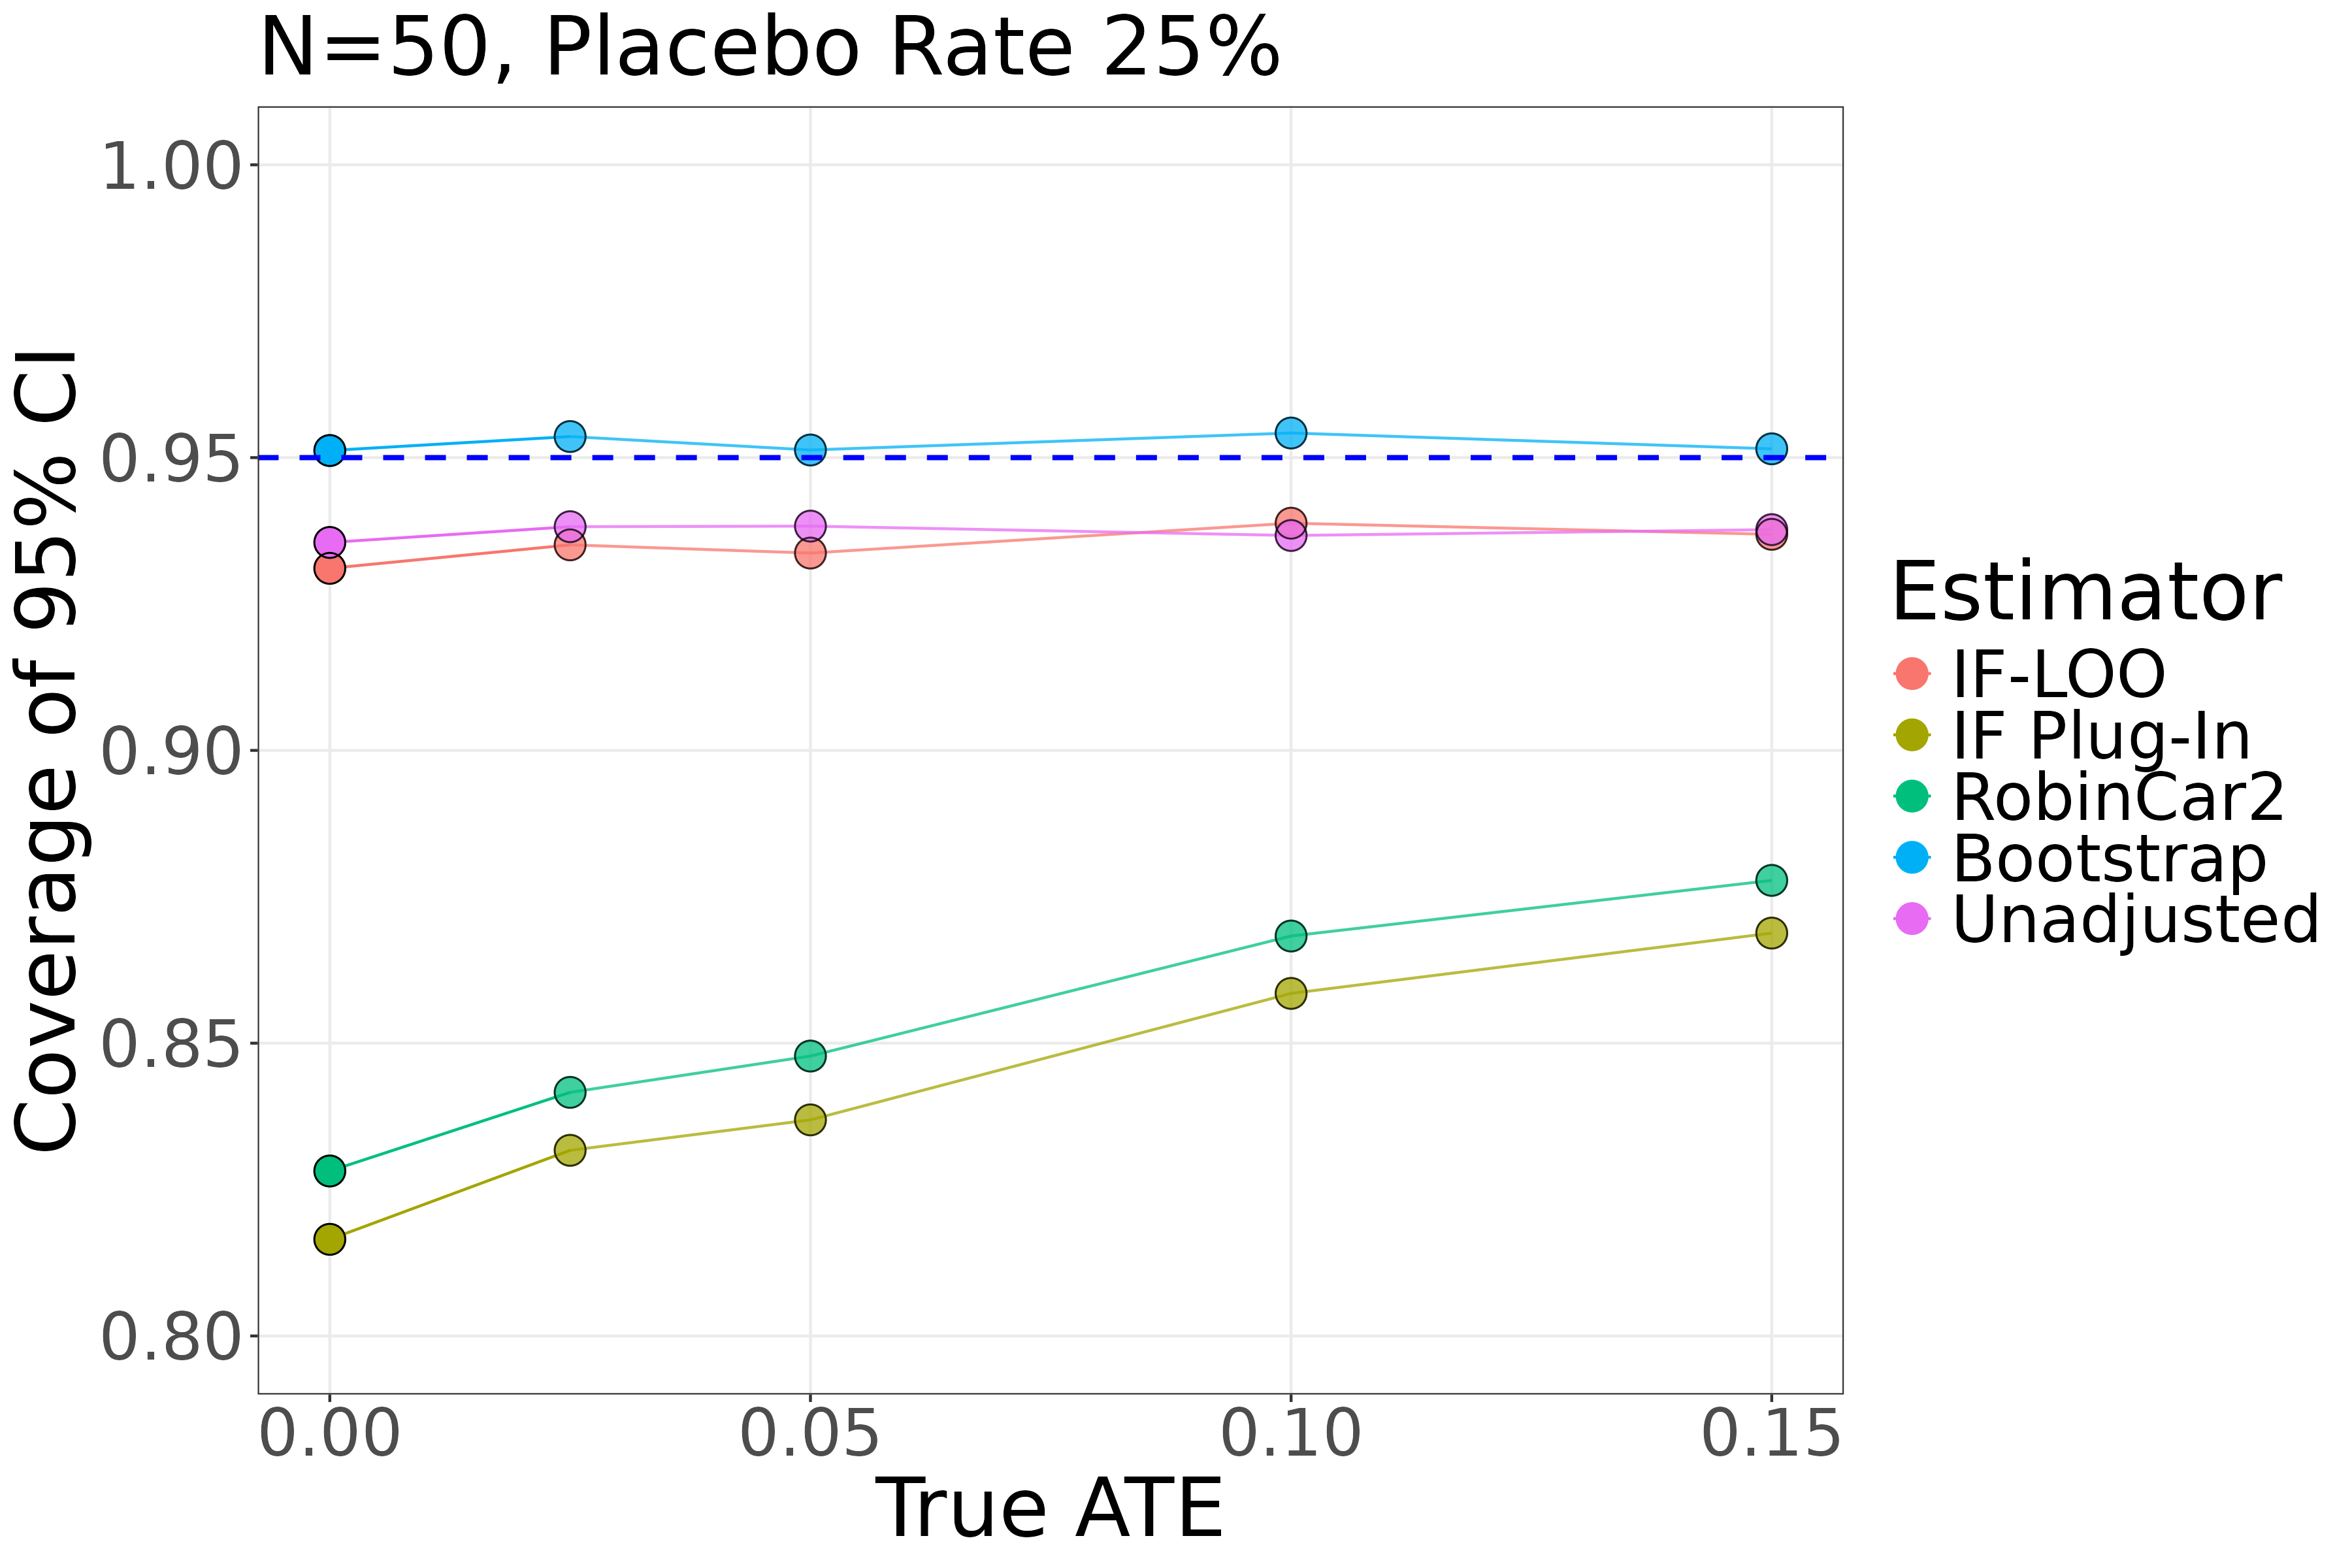
Fig 2: Simulation results for N = 50 with a placebo rate of 25%. The x-axis displays the
Limitations
- Simulations use only two DGPs with two specific (N, event-rate) combinations; generalizability to other regimes (e.g., very large N with extremely rare events <0.5%, imbalanced randomization, multi-arm trials) is not demonstrated.
- The working model is always correctly specified in simulations, which is a best-case scenario for demonstrating IF-LOO's advantage but does not evaluate performance under model misspecification — a common real-world condition the authors explicitly acknowledge.
- IF-LOO requires n separate logistic regression fits, making it O(n) times more expensive than the IF plug-in; computational scaling for large n or high-dimensional covariate vectors is not benchmarked.
- The modest undercoverage of IF-LOO itself (93.37%-93.88% vs nominal 95% in the N=50 scenario) is acknowledged but not fully resolved; the bootstrap outperforms IF-LOO on coverage in this regime, and the paper does not explain the residual gap.
- The paper does not evaluate performance with more covariates than events (p >> n_events), a common scenario in early-phase oncology trials where the method is most needed.
- Only the logistic regression working model is considered for standardization; performance with nonparametric or machine learning working models (e.g., random forest, LASSO) is mentioned as future work but not evaluated, despite the authors noting that ML models increase overfitting risk.
- No real clinical trial dataset is used to validate the simulation findings; all evidence is simulation-based, limiting direct clinical relevance assessment.
Open questions / follow-ons
- Can finite-sample corrections analogous to those of Tsiatis et al. (2008) be derived for IF-LOO to close the residual ~1.5% undercoverage gap observed in the N=50 scenario, and would such corrections remain computationally tractable?
- How does IF-LOO perform when the working model is a high-dimensional machine learning estimator (e.g., LASSO, random forest) under the doubly-robust or cross-fitted semiparametric framework (cf. Chernozhukov et al. 2018), where overfitting is even more severe and LOO may need to be combined with additional sample splitting?
- Can the LOO strategy be extended to other estimands beyond the marginal risk difference — such as the risk ratio, odds ratio, or restricted mean survival time — and do analogous variance underestimation problems arise in those settings?
- What is the relationship between IF-LOO and randomization-based (design-based) inference as noted by Magirr et al. (2025) and Abadie et al. (2020), and does framing inference as finite-population rather than super-population change the optimal variance estimator in small-sample, rare-event settings?
Why it matters for bot defense
This paper is not directly relevant to bot defense or CAPTCHA systems. Its domain is clinical trial statistics — specifically variance estimation for covariate-adjusted treatment effect estimators in randomized experiments with binary outcomes. The methods (g-computation, influence functions, leave-one-out cross-validation for variance) are specific to the causal inference and clinical biostatistics setting.
That said, a bot-defense or fraud ML engineer might find indirect relevance in two narrow contexts: (1) if A/B testing or randomized experimentation infrastructure at a CAPTCHA or fraud platform uses covariate-adjusted estimators for binary outcomes (e.g., pass/fail rates, bot detection flag rates) with small treatment groups or rare event outcomes, the IF-LOO variance estimator could provide more reliable confidence intervals than standard plug-in methods; (2) the general principle — that in-sample residuals from well-fitting models are overly small and produce underestimated uncertainty, which LOO or cross-fitting corrects — is architecturally similar to out-of-fold calibration practices in ML pipelines. However, practitioners should not overextend: the paper's guarantees are specific to the randomized trial setting with known randomization probabilities, and applying it to observational bot-defense data would require additional assumptions.
Cite
@article{arxiv2605_06655,
  title={ Improving Variance Estimation for Covariate Adjustment with Binary Outcomes },
  author={ Kaitlyn Lee and Alex Ocampo and Courtney Schiffman and Michael Friesenhahn and Christina Rabe and Michael Rosenblum },
  journal={arXiv preprint arXiv:2605.06655},
  year={ 2026 },
  url={https://arxiv.org/abs/2605.06655}
}