
dtour: a steerable tour de vis through high-dimensional data
Source: arXiv:2605.04306 · Published 2026-05-05 · By Fritz Lekschas, Nezar Abdennur
TL;DR
dtour addresses a persistent gap in high-dimensional data visualization: any single 2D projection of a p-dimensional dataset discards all structure orthogonal to the chosen projection plane, yet existing tour tools force analysts to commit upfront to a single traversal mode—grand, guided, or manual—each with distinct tradeoffs in control versus guidance. The paper argues that these tradeoffs are not fundamental but rather stem from interface design choices, and that a unified progressive interface can let users move fluidly across the steerability spectrum within a single session. The contribution is therefore primarily a visualization system design, not a new mathematical tour method; the underlying geodesic interpolation on the Grassmannian and Catmull-Rom spline re-orthonormalization are adaptations of known techniques, but their integration into a browser-native, GPU-accelerated, scrub-and-select workflow is novel.
dtour unifies four interaction modes—keyframe gallery, guided scrubbing along arc-length-parameterized geodesic paths, manual axis dragging with Gram-Schmidt re-orthonormalization, and a wandering grand tour—into one interface, with smooth interpolated transitions between all modes to preserve object constancy. It also introduces four ready-made tour strategies: a little tour (successive PCA pair cycling), a Laplacian Eigenmaps spectral tour, a general sequential embedding tour, and an attraction-repulsion sweep that traverses the Böhm et al. neighbor-embedding spectrum from attraction-only to heavy-repulsion. The system is implemented in TypeScript with WebGPU/WebGL rendering on an OffscreenCanvas worker and streams Parquet data directly to the GPU, sustaining ≥60 FPS at ≤5M points and ~25 FPS at 20M points on an Apple M1 Max.
The paper demonstrates dtour on three datasets across two usage scenarios: revealing latent structure (Fashion MNIST attraction-repulsion tour and CyTOF immune cell Laplacian Eigenmaps tour) and validating non-linear DR outputs (PCA tour vs. UMAP on a 276K-cell developing mouse brain atlas, and sequential model comparison of 3M arXiv embeddings across SPECTER2, BGE-M3, Nomic Embed Text v2, and F2LLM-v2-8B). No quantitative user study or formal task-performance evaluation is reported; evidence of utility is qualitative and case-study-based.
Key findings
- GPU-accelerated WebGPU/WebGL rendering sustains ≥60 FPS at ≤5M points, 40 FPS at 10M points, and ~25 FPS at 20M points on an Apple M1 Max MacBook Pro, enabling interactive scrubbing at previously impractical dataset scales.
- Attraction-repulsion tour of 70K Fashion MNIST images identified a tight cluster of 96 points (misclassified short trousers) that appeared only under heavy repulsion (t-SNE-like) and dispersed in the ForceAtlas2-like frame, demonstrating that cluster tightness can be an artifact of repulsive force magnitude rather than genuine data structure.
- In the same Fashion MNIST tour, boundary points (e.g., boot-like bags bridging footwear and bag clusters) persisted as boundaries across the full attraction-repulsion spectrum, suggesting boundary placement is a more stable and trustworthy signal than cluster compactness.
- PCA little tour of 276K developing mouse brain cells (La Manno et al. 2021 atlas) revealed that choroid plexus cells form one cohesive cluster throughout all PCA keyframes but split into two distant clusters in UMAP, flagging the split as a UMAP artifact rather than genuine transcriptional divergence.
- Sequential embedding tour of 3M arXiv title-abstract embeddings across four models (SPECTER2, BGE-M3, Nomic v2, F2LLM-v2-8B) showed that ~84% of ~1,200 papers in a tight F2LLM-specific cluster are physics education research, a subfield whose pedagogical discourse style is clustered together by F2LLM but dispersed across physics subfields by citation-trained SPECTER2—a behavioral difference invisible in any single model's 2D layout.
- Laplacian Eigenmaps spectral tour of 346K CyTOF immune cells (9 surface protein markers, Mair et al. 2022) recovered the known CD4/CD8 division in the first keyframe and the CD103/ICOS tissue-residency axis (the axis Mair et al. identified as most clinically relevant) in the second keyframe, without manually specifying which markers to prioritize.
- Arc-length parameterization via a precomputed cumulative geodesic distance table with 8 interior sample points per spline segment enables O(log n) binary-search lookup at runtime, ensuring perceptually uniform angular velocity during slider scrubbing regardless of uneven spacing of keyframes in projection space.
Methodology — deep read
The core mathematical substrate is the Grassmannian geometry of 2D projection subspaces. Each keyframe is represented as a p×2 orthonormal basis matrix F_i that maps p-dimensional data to a 2D scatter. The geodesic distance between two subspaces is computed via principal angles derived from the SVD of F_a^T F_z: d = sqrt(τ_0² + τ_1²), where τ_i = arccos(σ_i) and σ_i are singular values clamped to [−1,1]. For the 2×2 case dtour computes this SVD analytically rather than numerically. This is the standard Grassmannian metric formalized by Buja et al. [6]; the contribution is its implementation in a browser-native context.
Interpolation between keyframes uses Catmull-Rom splines applied element-wise to the basis matrices, followed by Gram-Schmidt orthonormalization at every intermediate step. Given four consecutive bases P0–P3, the spline produces a C1-continuous path through P1 and P2, avoiding the velocity discontinuities of piecewise geodesic interpolation on the Grassmannian while guaranteeing orthonormality. Arc-length parameterization is achieved by precomputing a cumulative geodesic distance table sampled at 8 interior points per spline segment; at runtime a binary search maps the slider position t ∈ [0,1] to the correct segment in O(log n), ensuring constant perceived angular velocity. The paper does not discuss how sensitive playback smoothness is to the 8-sample resolution or whether adaptive sampling was considered.
The manual tour mode exposes each data dimension as a draggable axis handle overlaid on the scatter. Dragging a handle specifies a new target direction for that variable; the remaining basis columns are re-orthonormalized via Gram-Schmidt to maintain a valid tour frame. A Shift-drag variant rotates about a temporary third axis (the residual principal component), enabling 3D spatial intuition within a 2D display. All transitions between modes—gallery click to guided scrub, guided to manual, manual back to guided—are smoothly interpolated through the same spline machinery, preserving point identity across the transition.
Four tour strategy implementations are provided. The little tour cycles through successive PCA component pairs (PC1-PC2, PC2-PC3, …). The LE tour uses Laplacian Eigenmaps with a cumulative circular basis construction that adds eigenvectors at uniform angular offsets (details deferred to supplementary material, not fully reproduced in the main text). The sequential embedding tour runs any DR method warm-started from the previous frame's embedding, Procrustes-aligns each result to reduce rigid-body variation, and concatenates the sequence. The attraction-repulsion tour is a special case of the sequential tour that sweeps the exaggeration hyperparameter of Böhm et al. [7] across the neighbor-embedding spectrum. The paper does not specify which DR method is used as the base for the sequential tour in the arXiv experiment (UMAP with default settings is stated), nor are warm-start convergence criteria or Procrustes alignment implementation details given in the main text.
Rendering is offloaded to a WebGPU/WebGL worker using an OffscreenCanvas, keeping the UI thread free for interaction. A separate data worker streams Parquet columns directly to the GPU worker, bypassing the main thread entirely. The system is implemented in TypeScript and exposed as a React component, an Anywidget for Jupyter/Marimo notebooks, and a standalone web app at dtour.dev. Source code is publicly released at github.com/flekschas/dtour. No frozen weights are involved (this is a visualization system, not a trained model). Performance figures (≥60 FPS at ≤5M, 40 FPS at 10M, 25 FPS at 20M points) are reported for a single hardware configuration (Apple M1 Max MacBook) without variance estimates, cross-device benchmarks, or browser comparisons.
Evaluation is entirely qualitative and scenario-based. No user study, task-completion metrics, or controlled comparison against baseline tour tools (e.g., tourr, langevitour, GGobi) is reported. The two usage scenarios serve as existence proofs that the interface enables certain analytical discoveries, not as evidence of superiority over alternatives. No ablation of individual interface components (e.g., arc-length parameterization vs. uniform-t, Catmull-Rom vs. piecewise geodesic) is presented. The paper is primarily a system/design contribution submitted to a visualization venue (arXiv cs.HC), and this evaluation style is typical for such work, but it means no falsifiable performance claim about user behavior is made.
Technical innovations
- Unified single-interface traversal across the full tour steerability spectrum—from passive gallery preview through guided arc-length-scrubbing to real-time manual axis dragging and grand tour random walk—with smooth interpolated transitions between all modes, whereas prior tools (tourr, GGobi, langevitour) require the analyst to choose a single mode before starting.
- Arc-length parameterization of Catmull-Rom splines on the Grassmannian via an 8-point-per-segment precomputed geodesic distance table with O(log n) binary-search lookup at runtime, ensuring perceptually uniform scrubbing speed independent of keyframe spacing in projection space.
- Attraction-repulsion sequential tour strategy that treats the Böhm et al. exaggeration hyperparameter as a continuous axis, producing a tour that animates the transition from LE-style attraction-only layouts through UMAP to t-SNE-style heavy-repulsion, enabling visual diagnosis of which cluster structures are force-magnitude artifacts versus genuine manifold features.
- Browser-native GPU rendering via WebGPU/WebGL on a dedicated OffscreenCanvas worker with Parquet column streaming, achieving ≥60 FPS at 5M points without requiring a server-side compute backend, extending interactive tour visualization to datasets previously feasible only in native desktop applications like GGobi.
- Sequential embedding tour with Procrustes alignment and warm-started DR, which repurposes the tour framework for cross-model or cross-hyperparameter embedding comparison rather than exploration of a single latent space, extending the tour concept beyond its traditional hyperdimensional-rotation context.
Datasets
- Fashion MNIST — 70,000 images (28×28 grayscale, 10 classes) — public (Xiao et al. 2017)
- CyTOF immune cell dataset (Mair et al. 2022) — 346,000 cells, 9 surface protein markers, cell-type labels from FAUST — non-public original study data; paper implies derived labels used
- Developing mouse brain single-cell RNA-seq atlas (La Manno et al. 2021) — 276,000–290,000 cells (276K cited in text, 290K in figure caption) — public (Nature 2021)
- arXiv titles and abstracts — 3,000,000 documents — public arXiv corpus; embeddings produced by four models (SPECTER2, BGE-M3, Nomic Embed Text v2, F2LLM-v2-8B)
Figures from the paper
Figures are reproduced from the source paper for academic discussion. Original copyright: the paper authors. See arXiv:2605.04306.
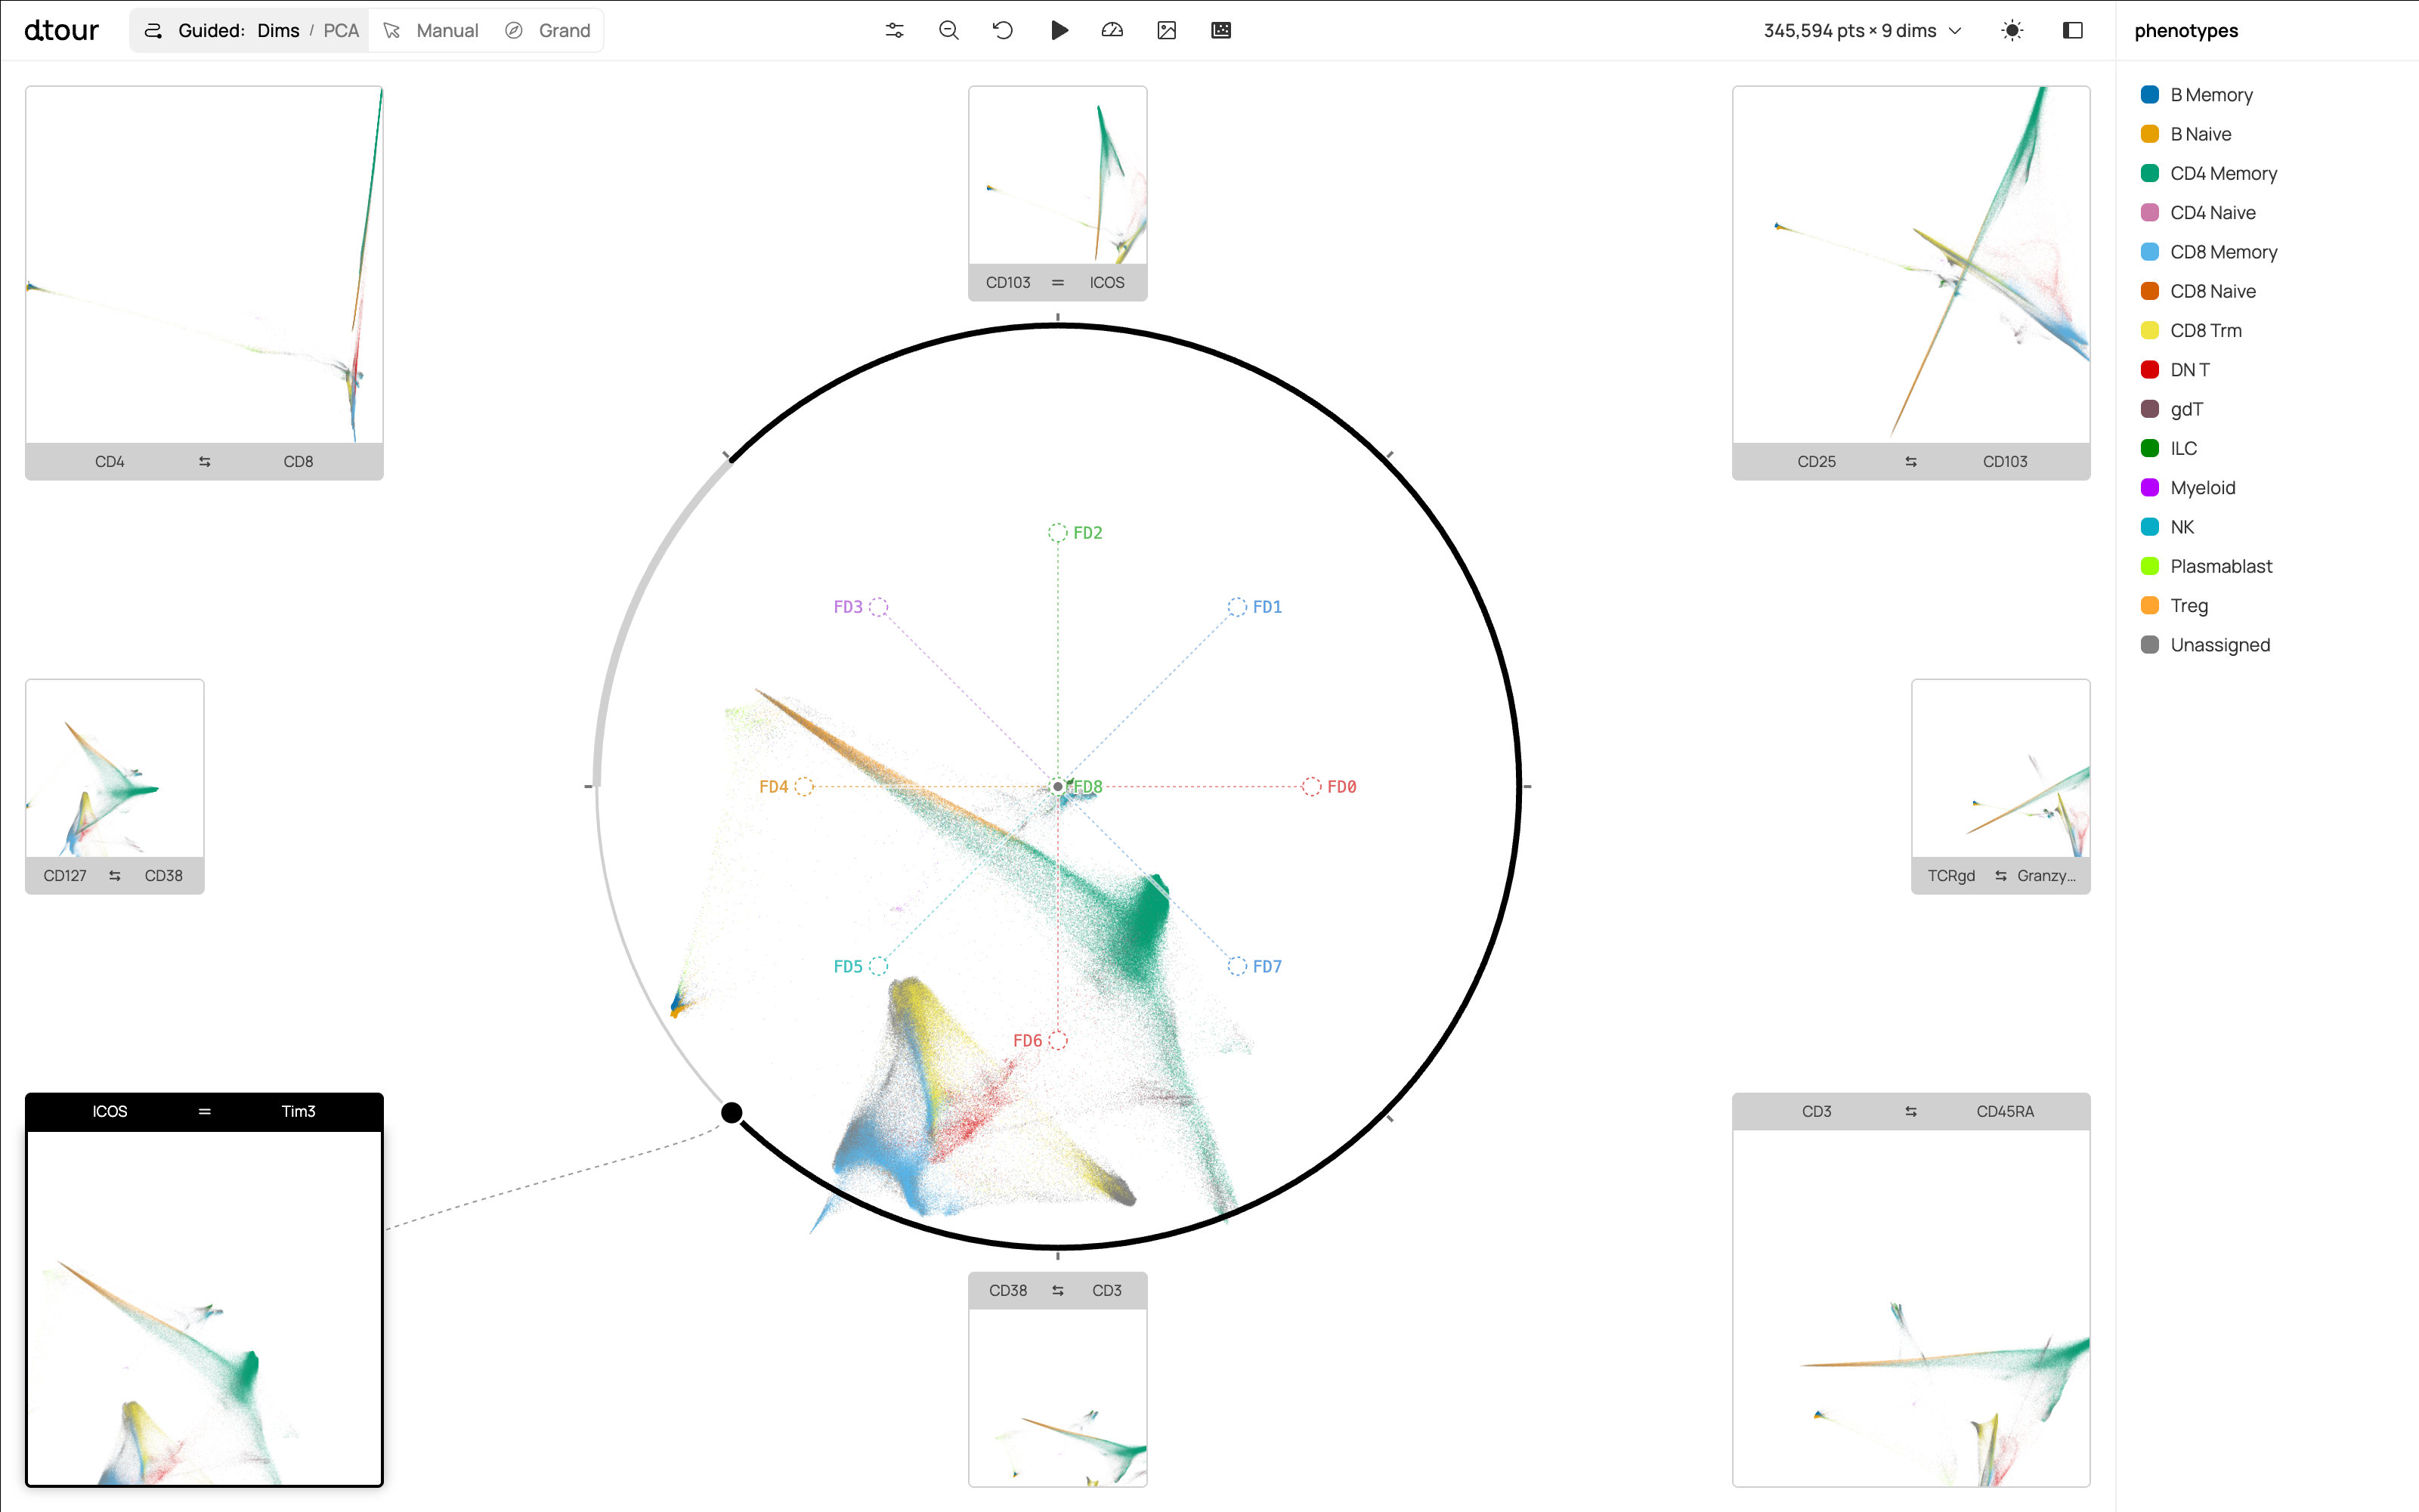
Fig 1: dtour’s interface for exploring high-dimensional data along a tour of keyframe projections. dtour unifies three modes of
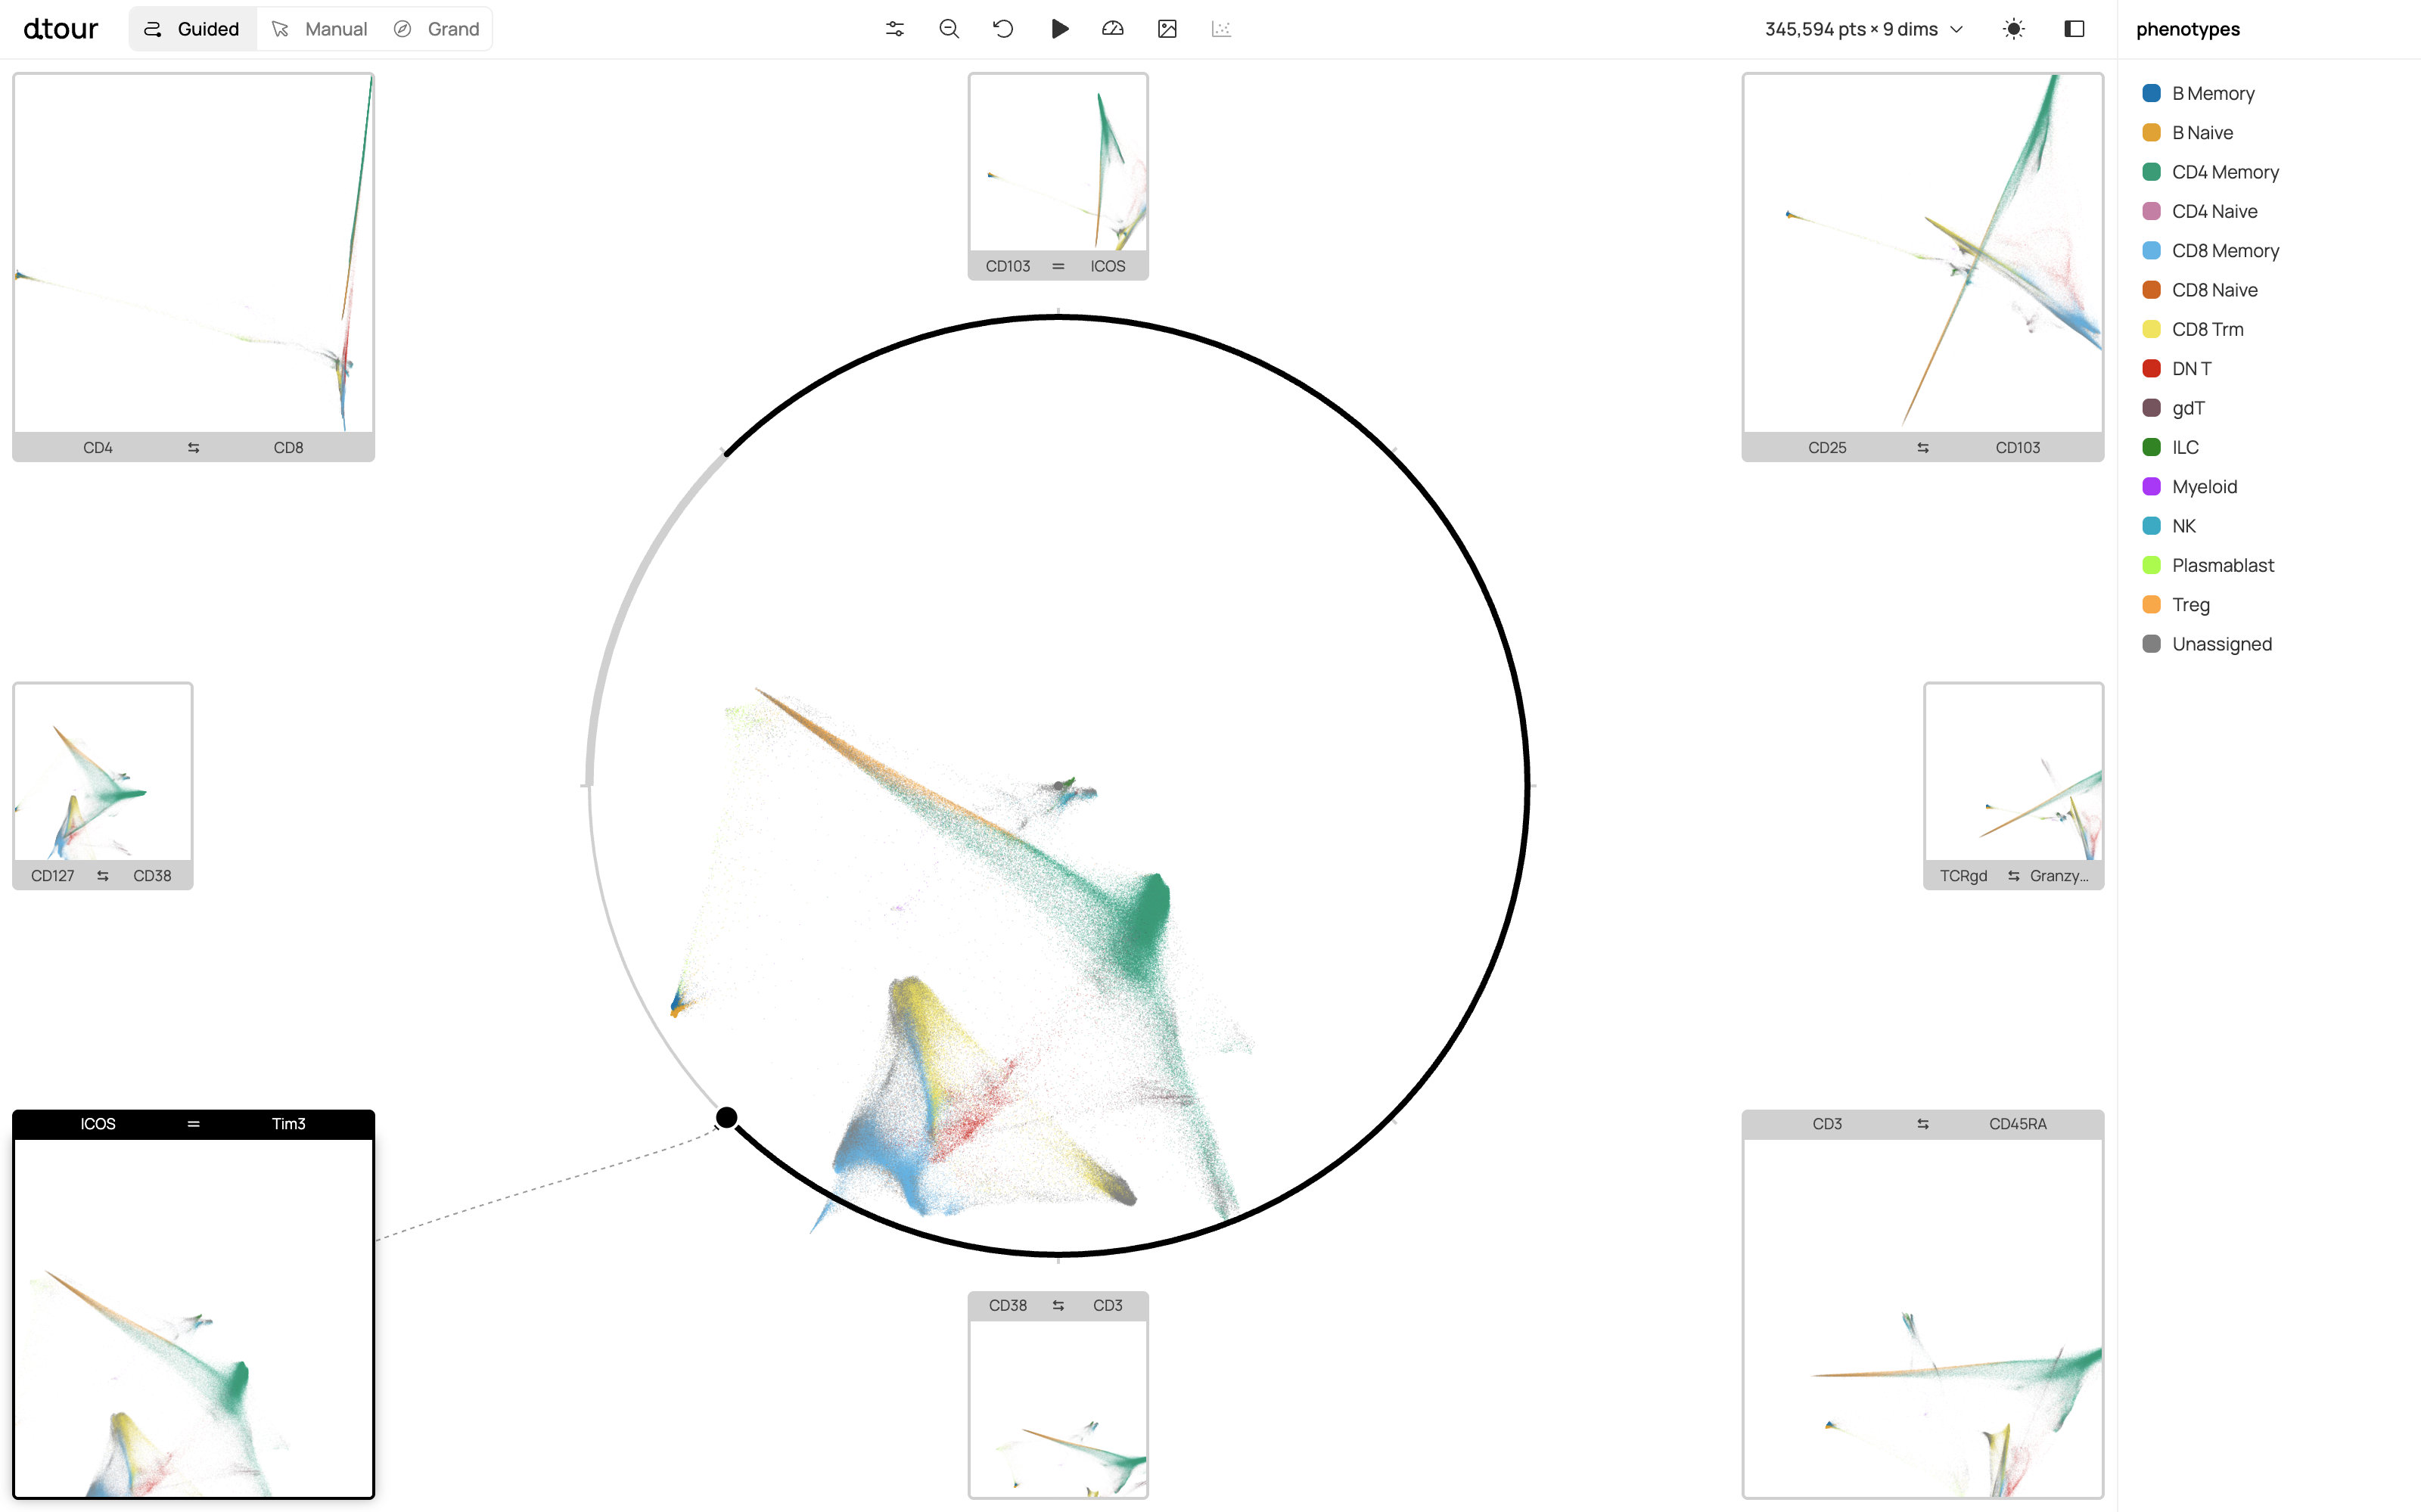
Fig 2 (page 1).
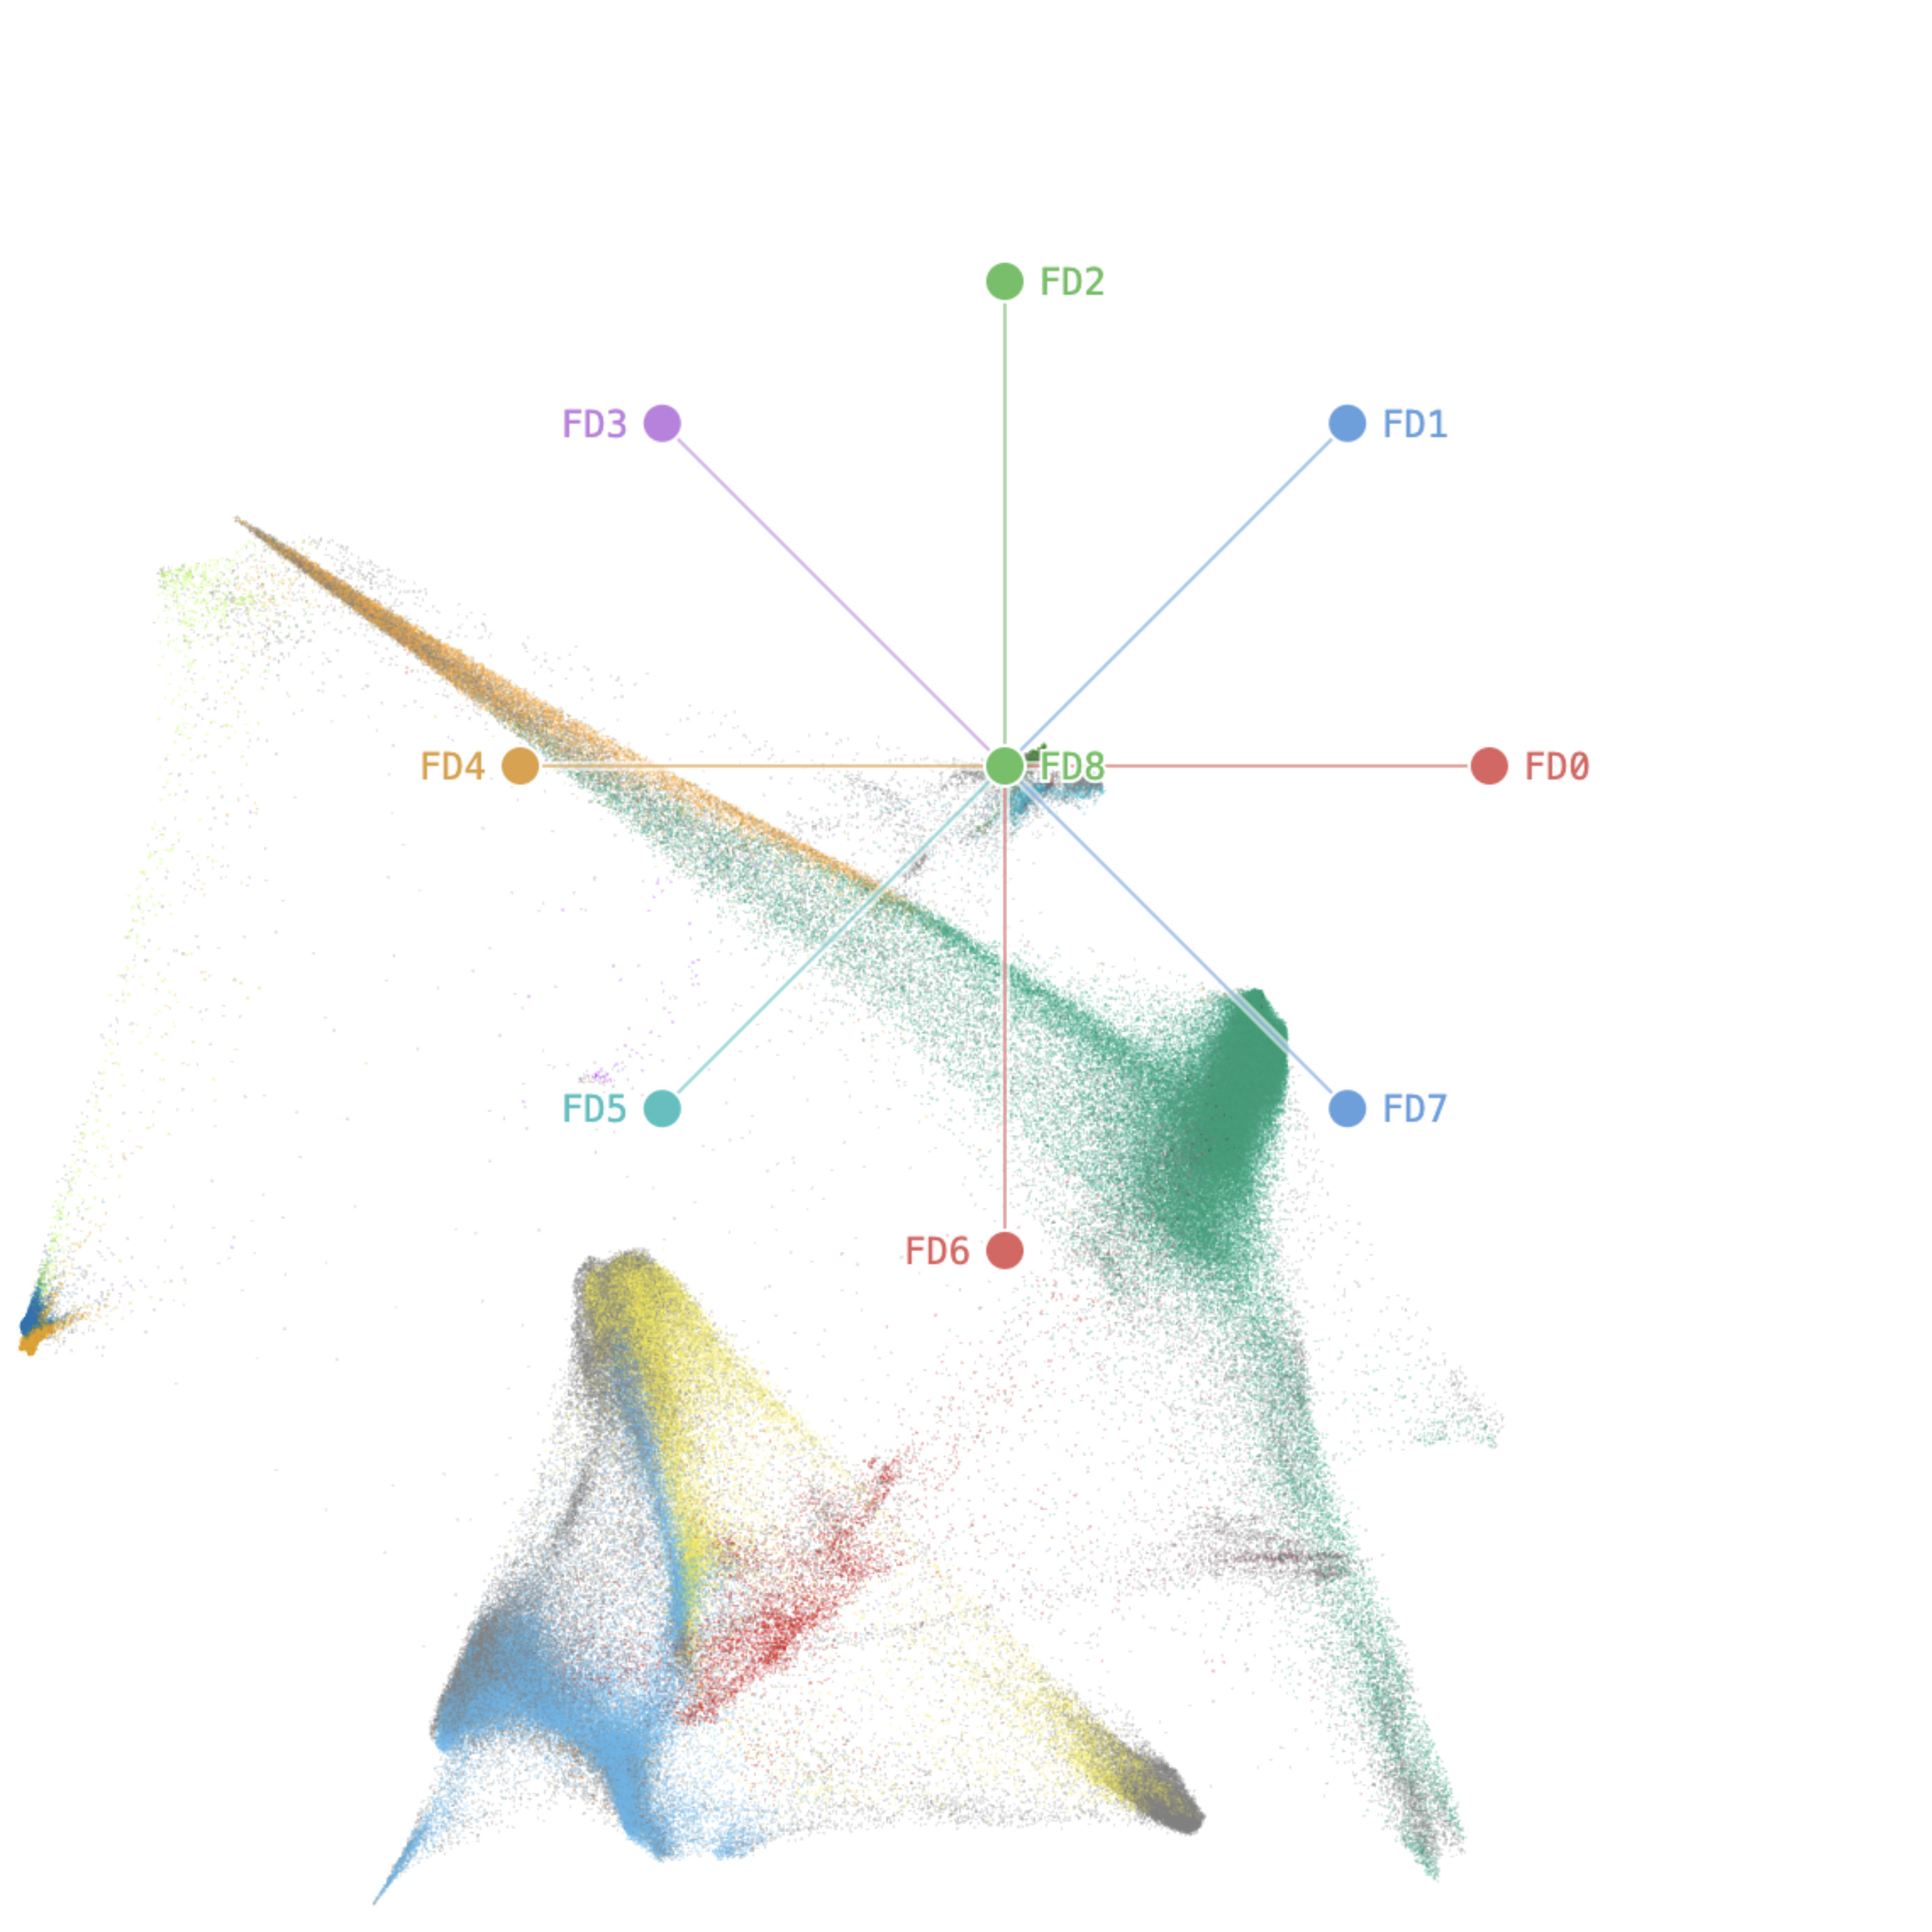
Fig 3 (page 1).
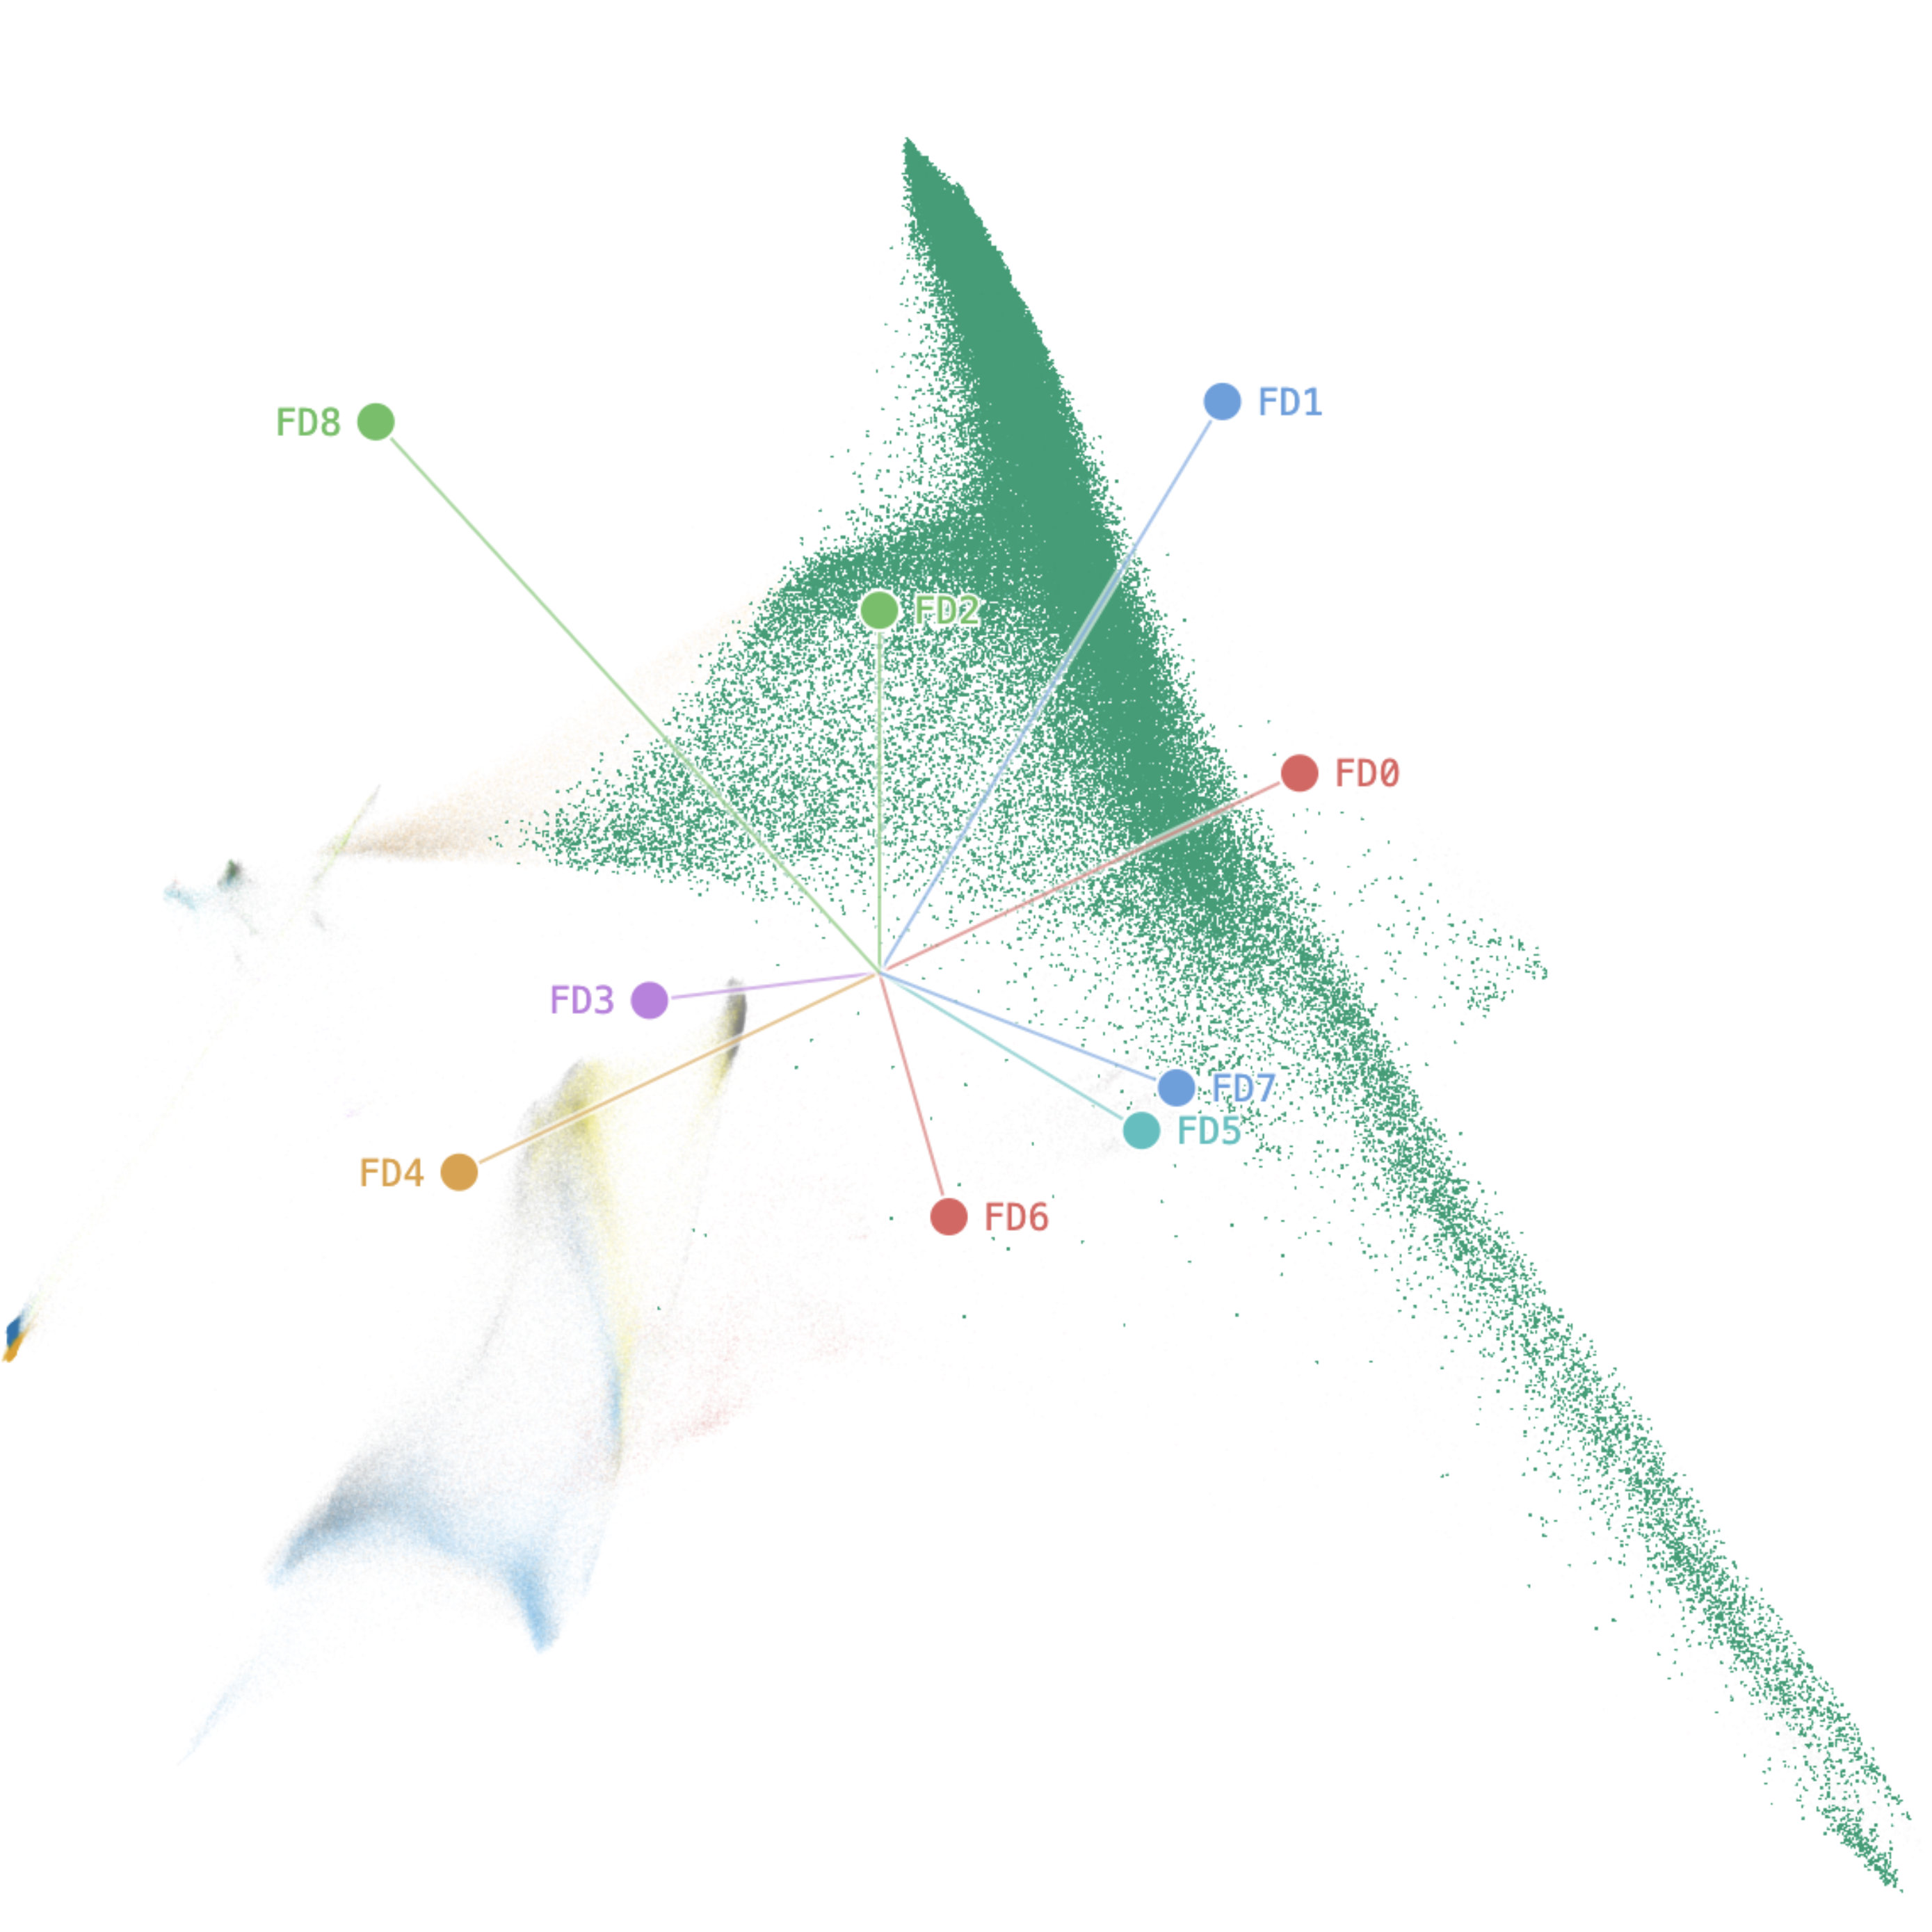
Fig 4 (page 1).
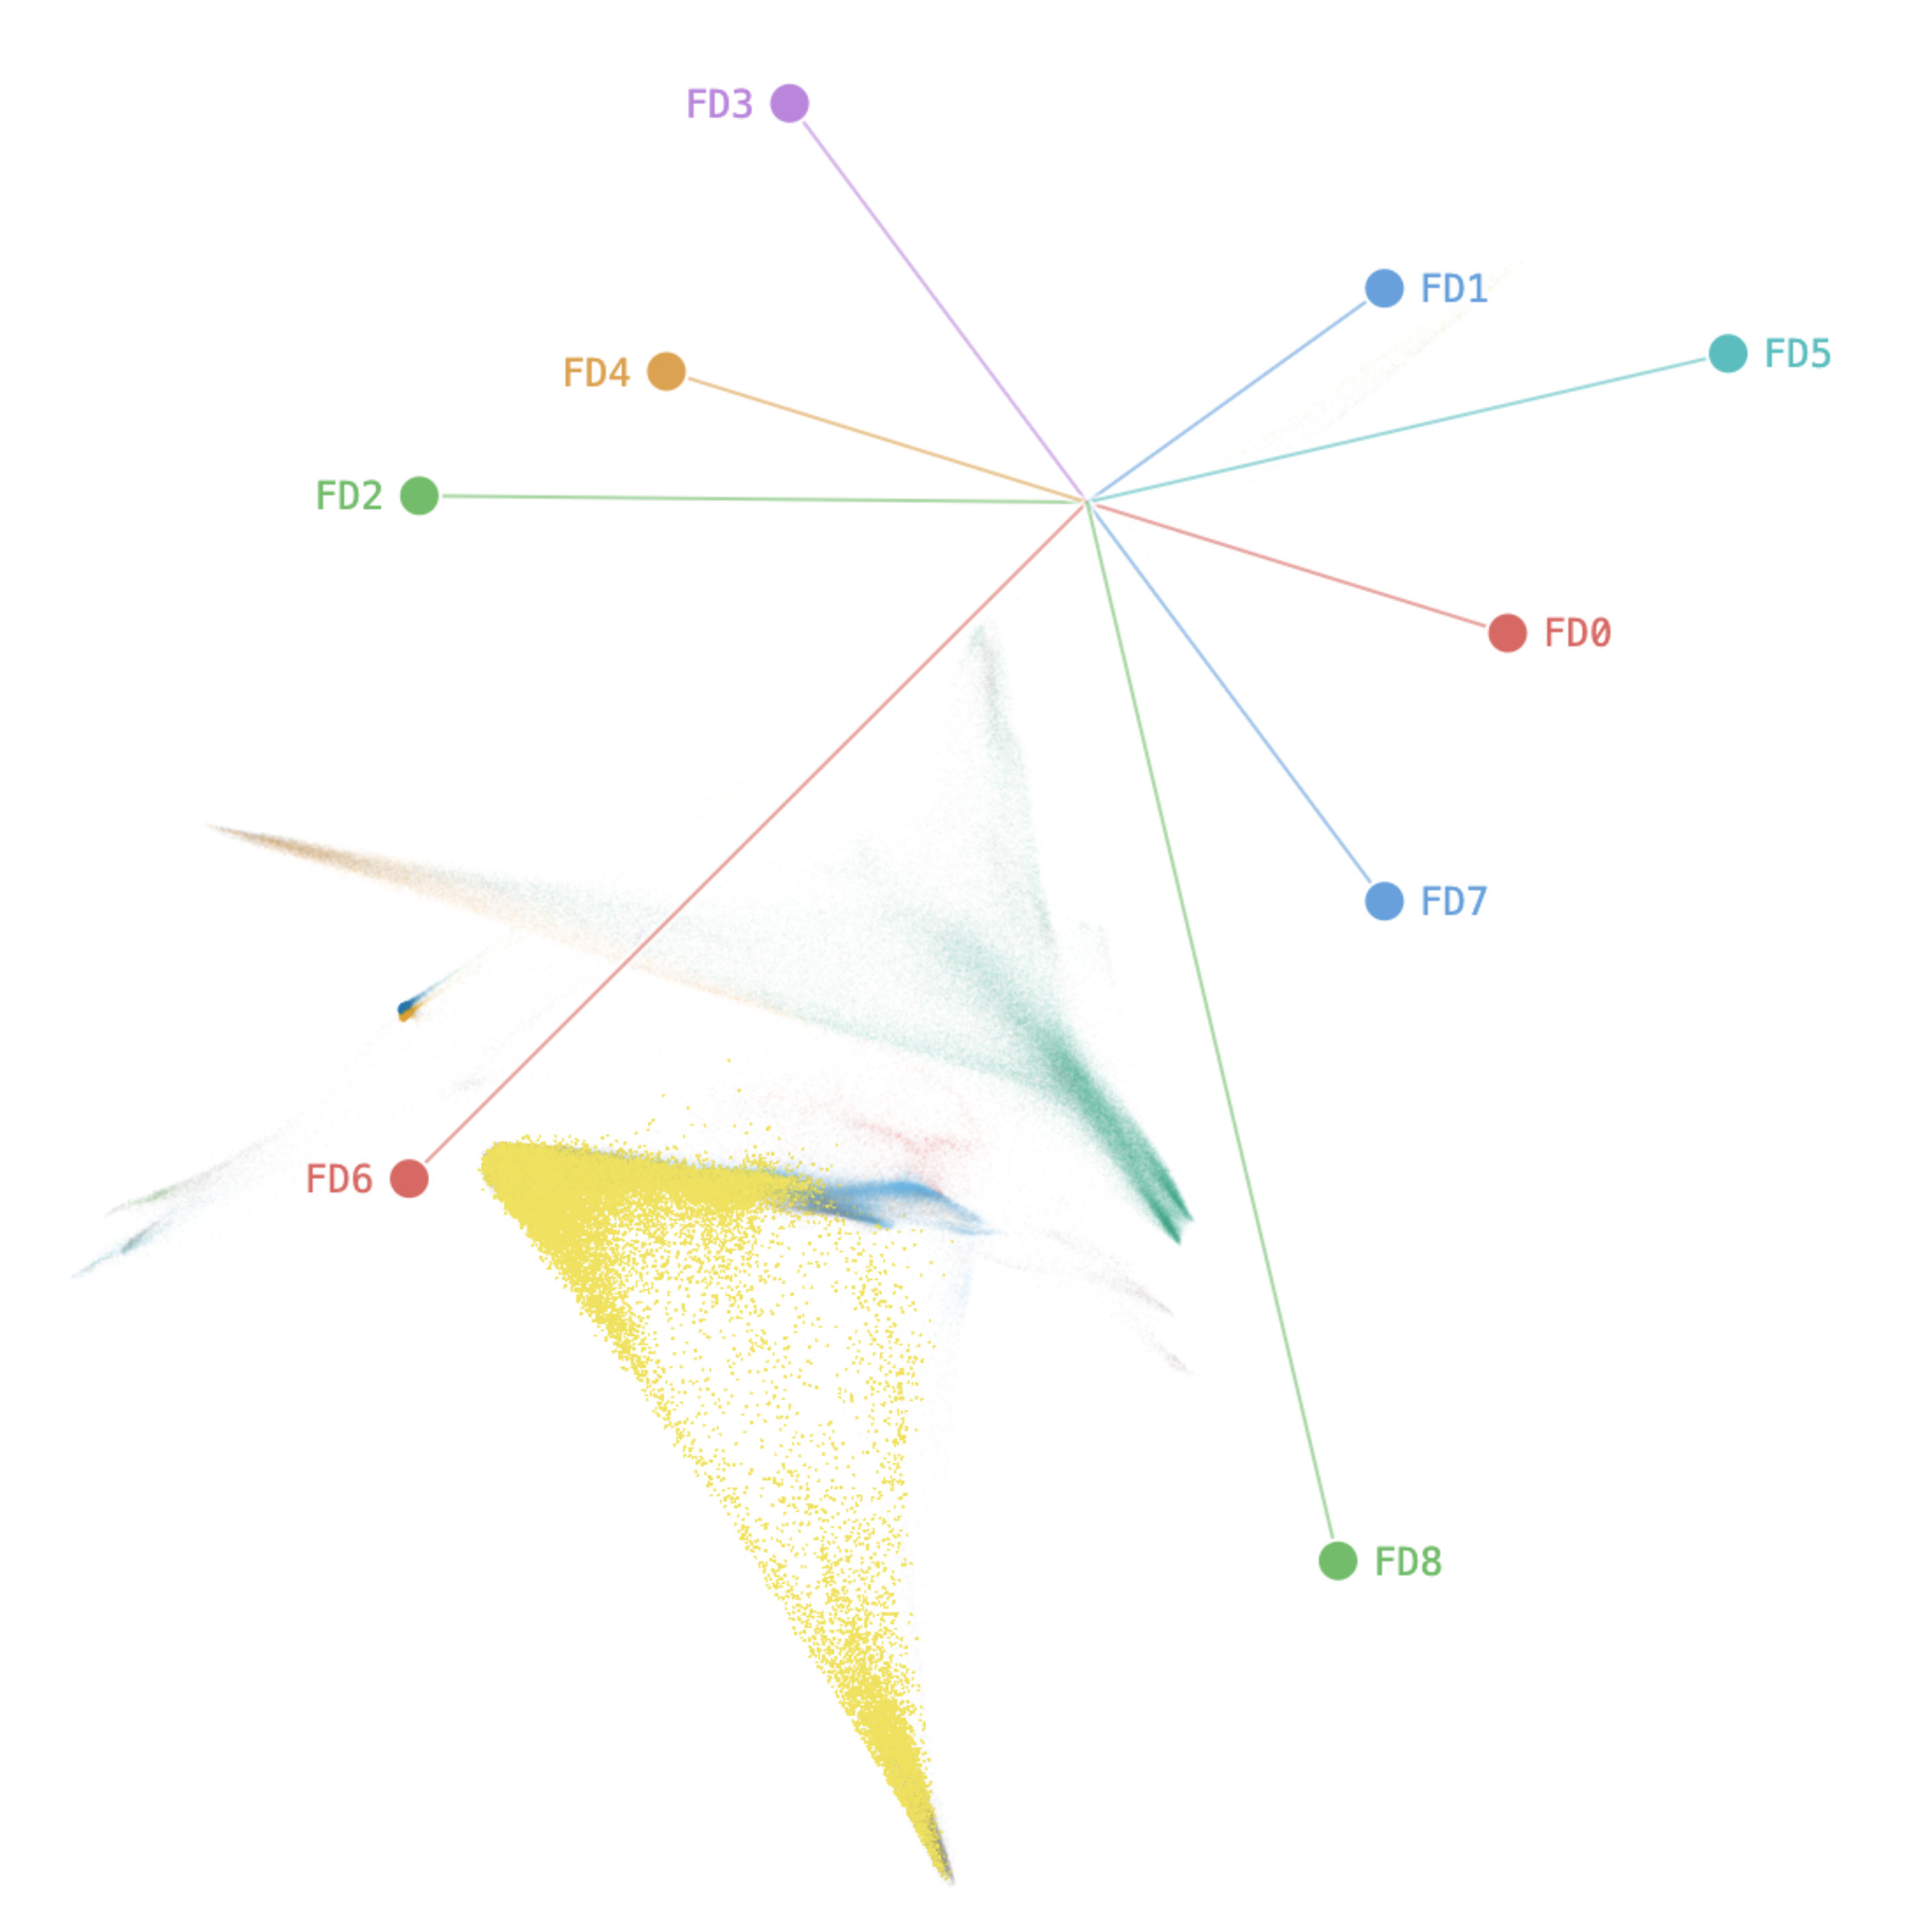
Fig 5 (page 1).
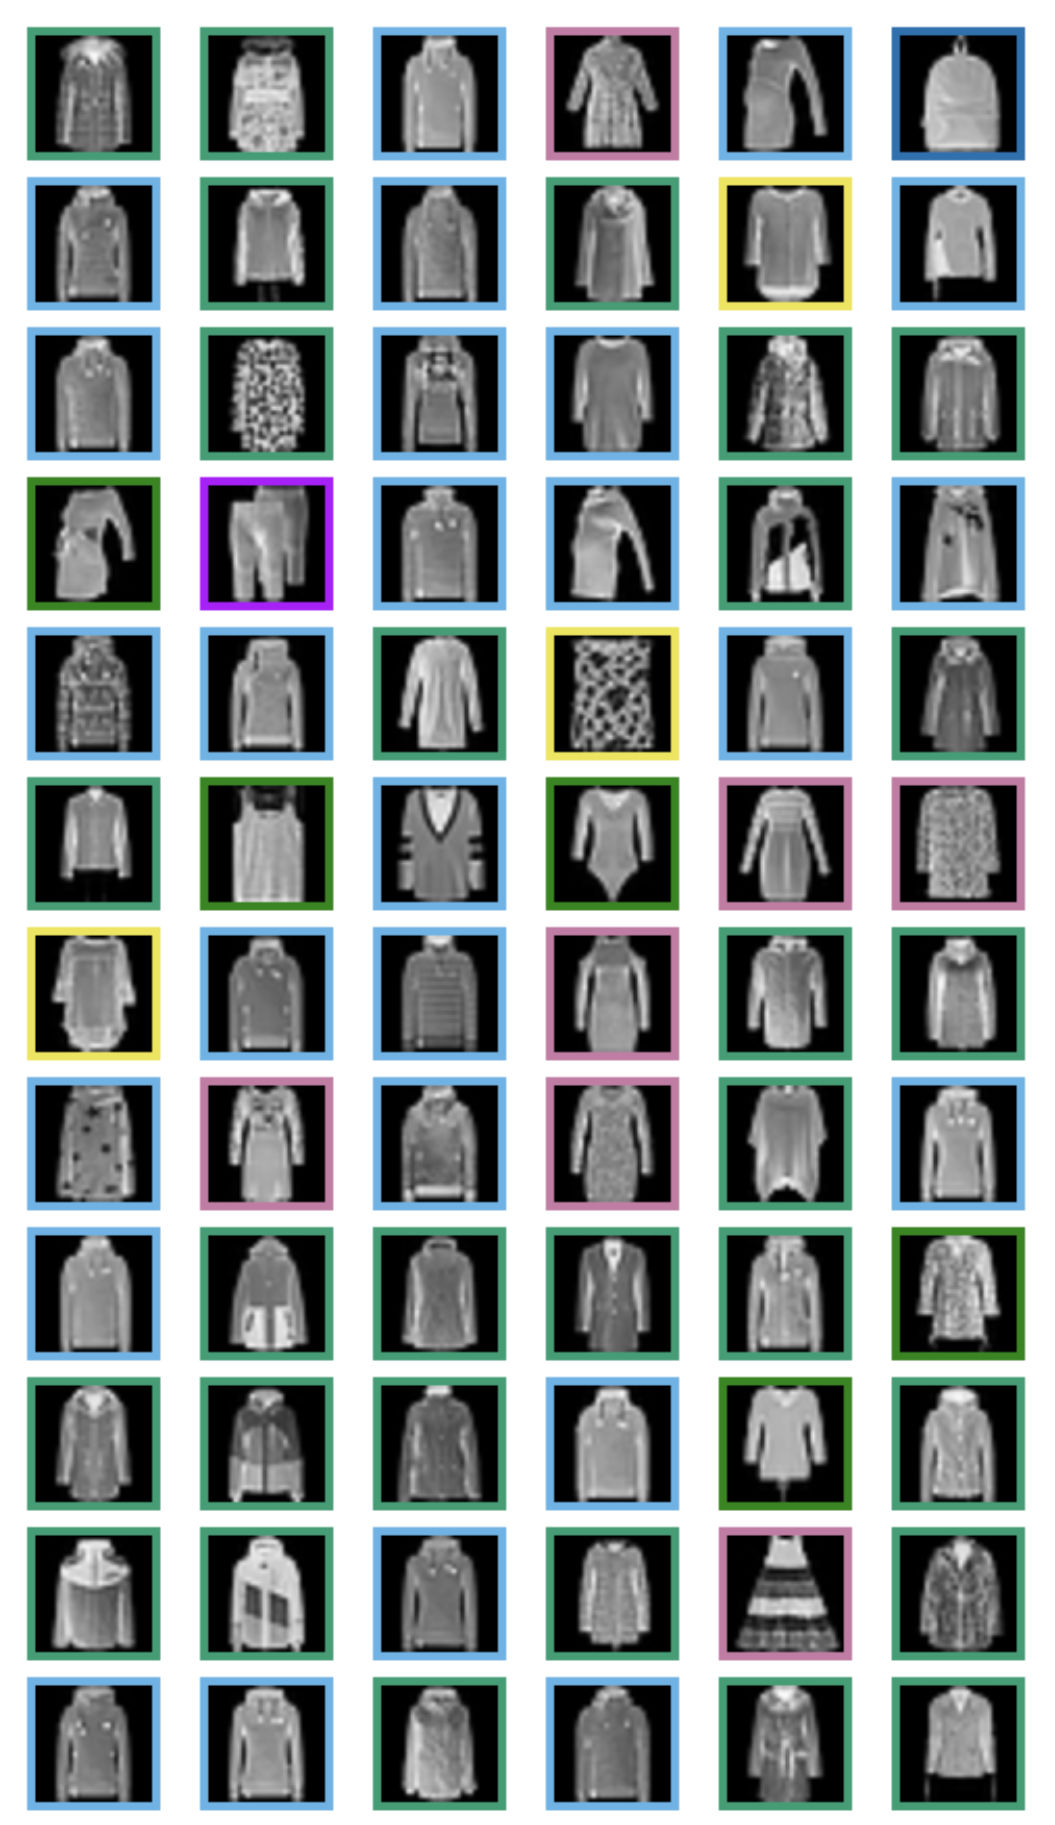
Fig 2: Usage Scenarios. Left: Attraction–repulsion tour of 70K Fashion MNIST images. Middle: UMAP-Validating little PCA tour of 290K
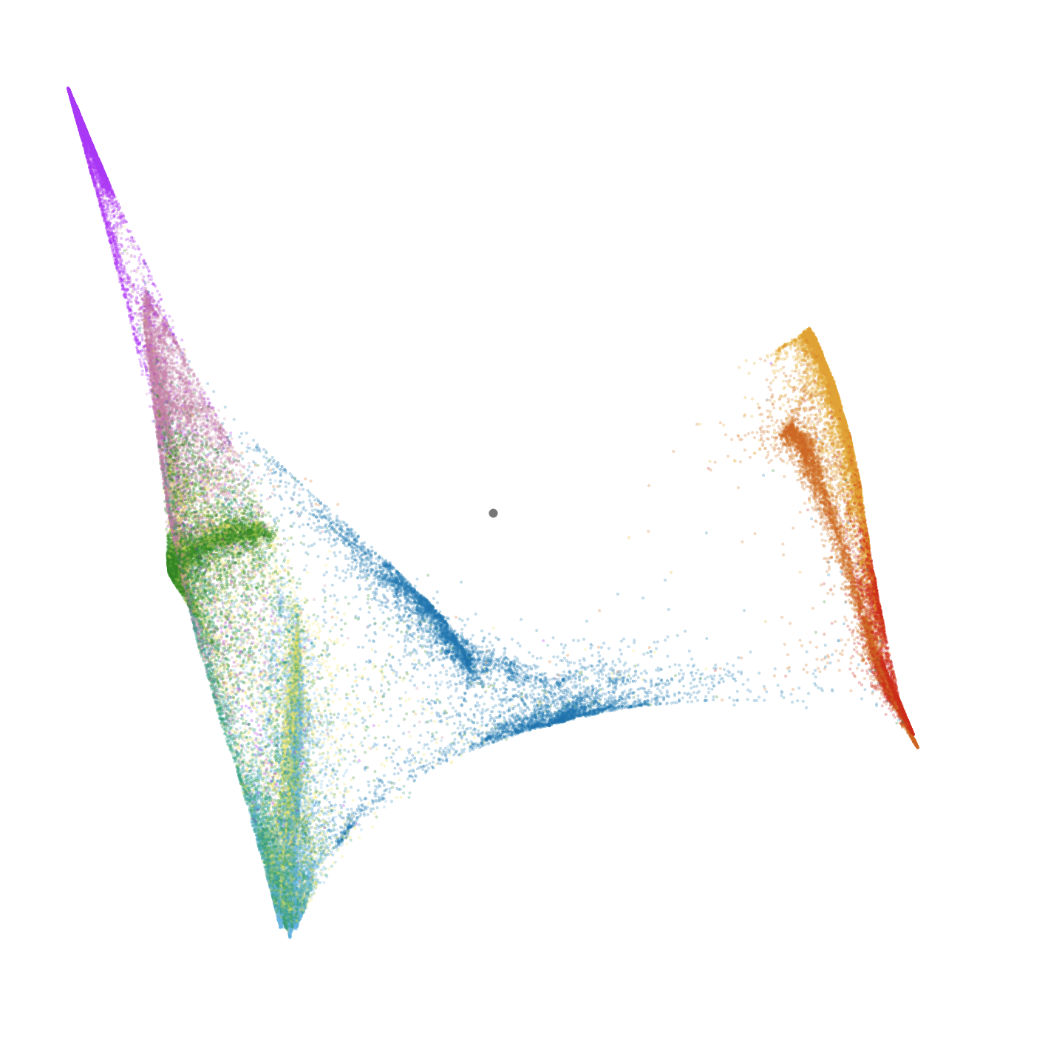
Fig 7 (page 4).
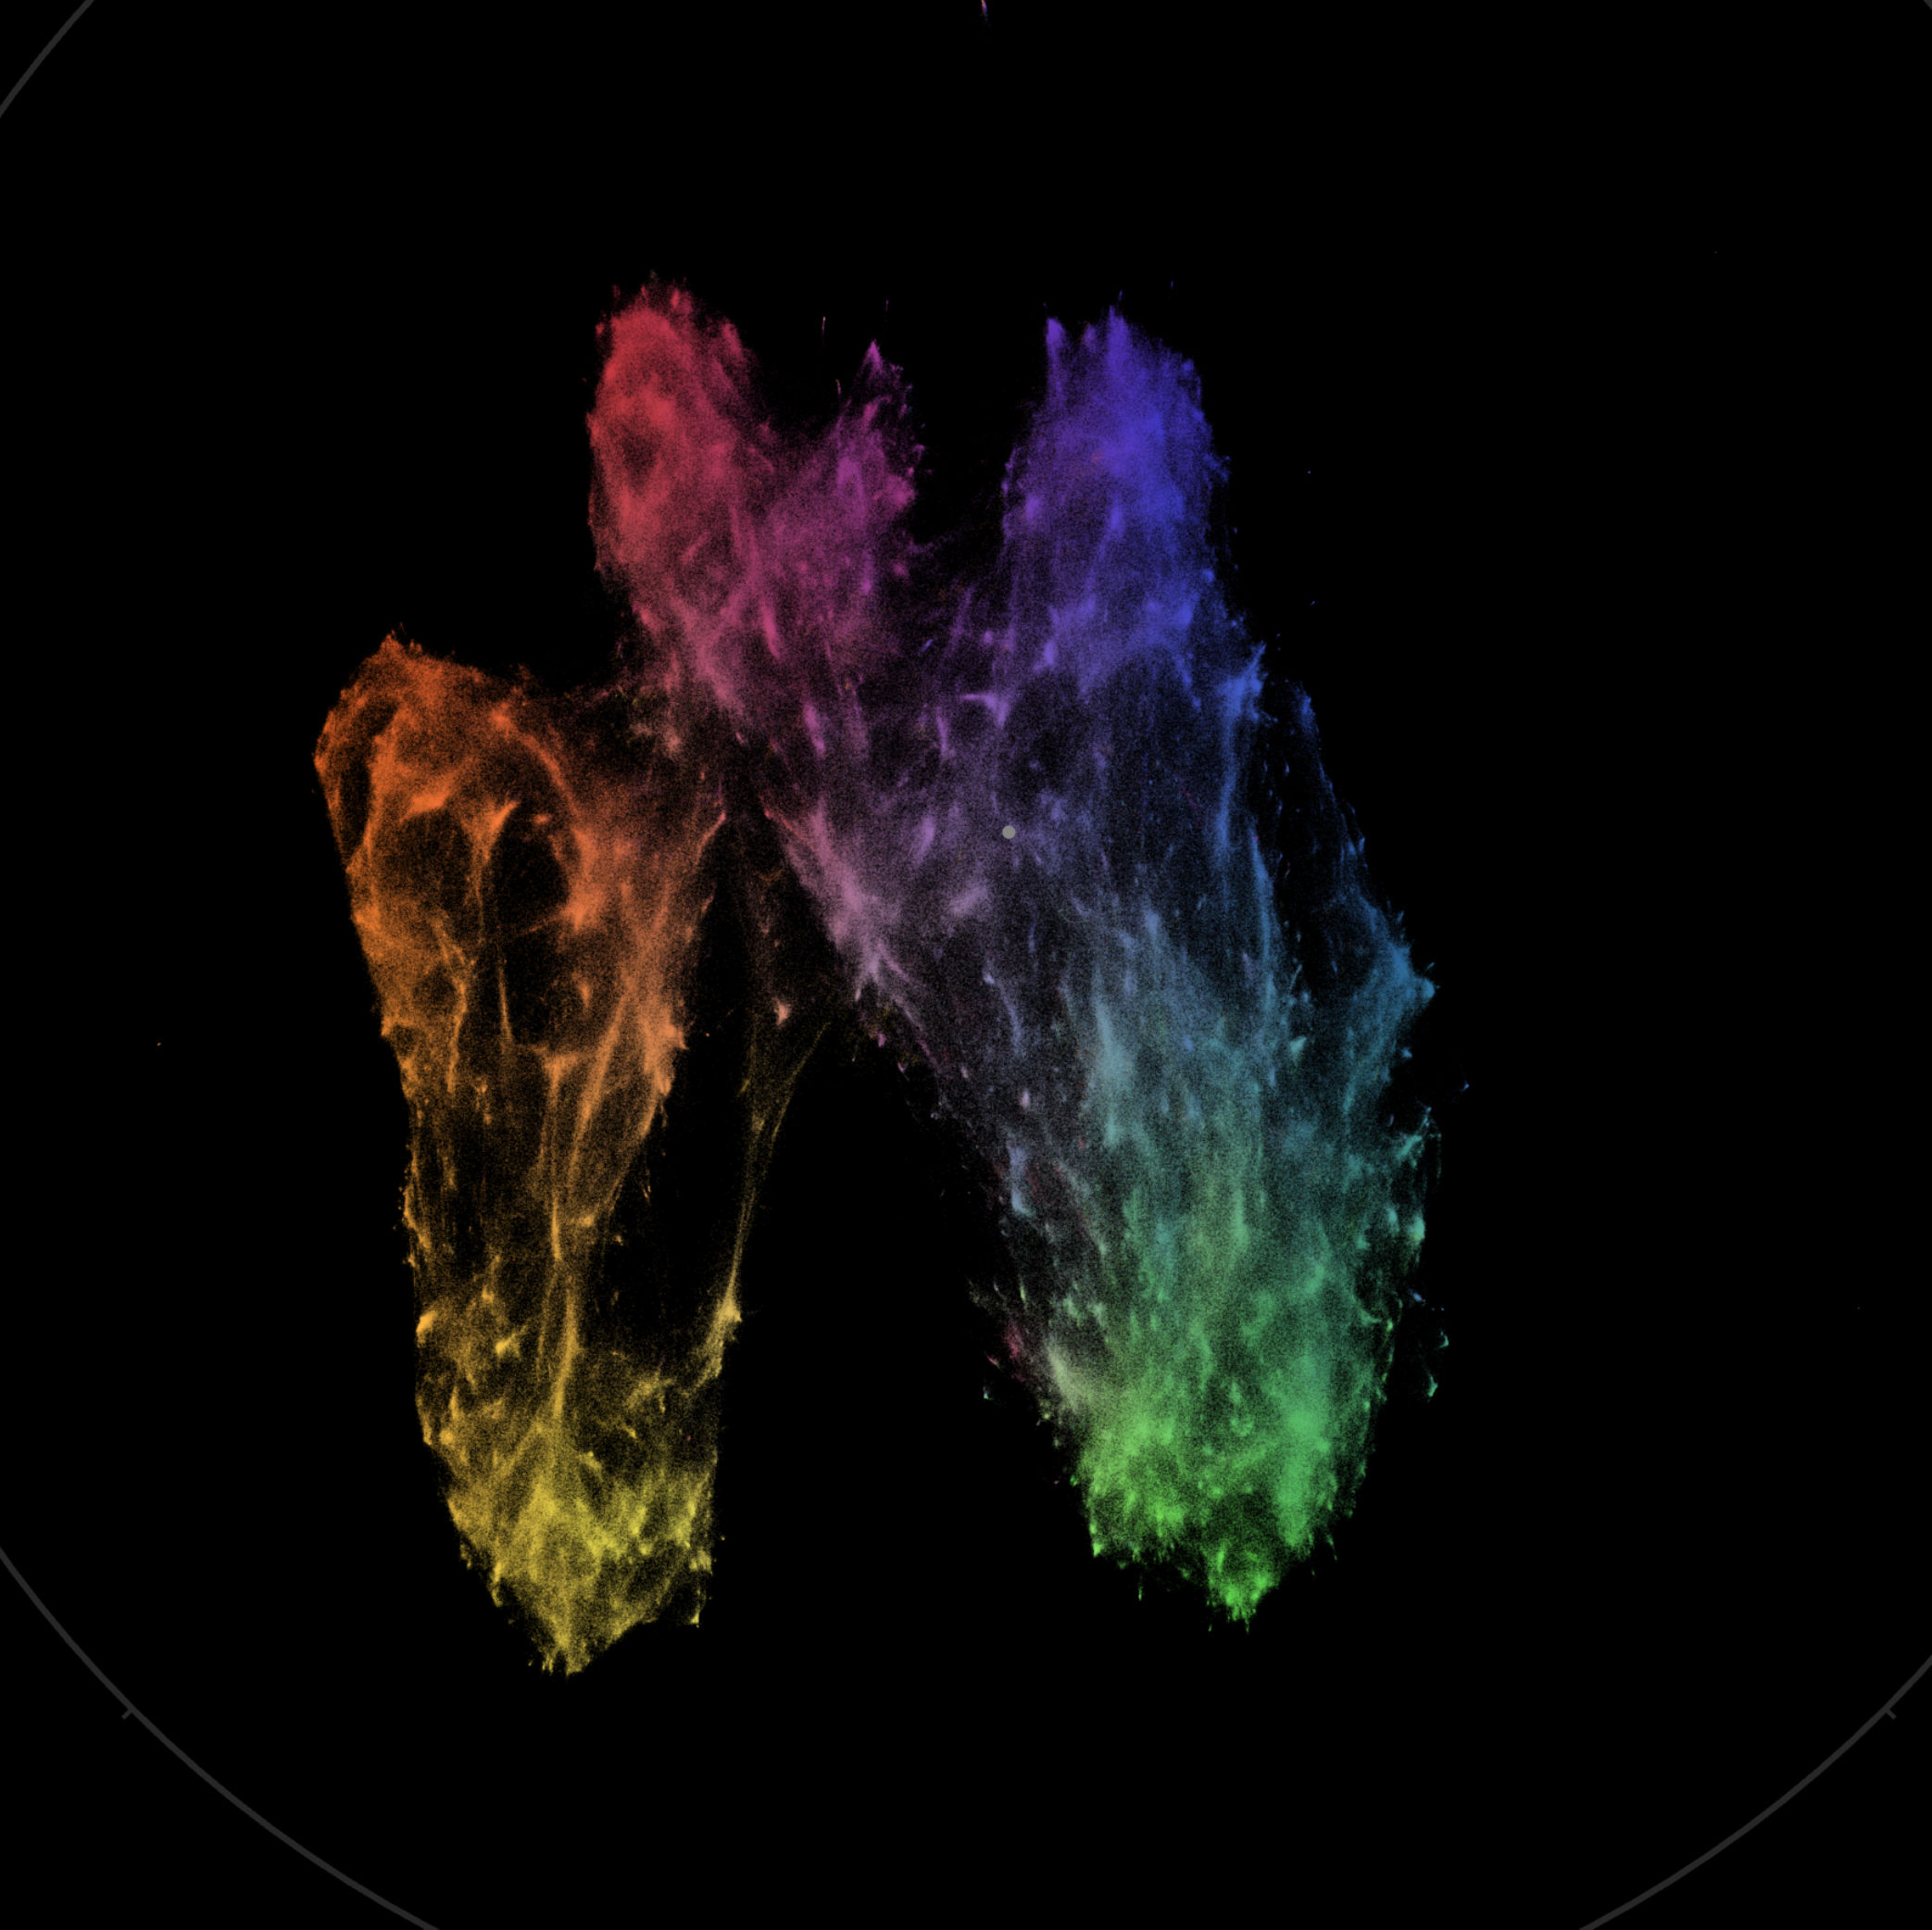
Fig 8 (page 4).
Limitations
- No quantitative user study or controlled experiment: all claims about analytical utility rest on three hand-selected qualitative case studies; no task-completion time, error rate, or insight-discovery metric is reported against any alternative tool.
- Performance benchmarks reported for a single hardware platform (Apple M1 Max MacBook) with no variance across runs, no cross-browser comparisons, and no degradation curves for lower-end hardware, making it unclear how the tool performs on typical analyst workstations.
- The 8-interior-point arc-length sampling resolution is stated without justification or sensitivity analysis; it is unknown whether this produces perceptually uniform playback for tours with very uneven keyframe spacing or very high-dimensional data.
- Intermediate frames of sequential embedding tours (e.g., the cross-model arXiv tour) are geometrically valid 2D projections but are explicitly acknowledged to not correspond to any meaningful view of latent structure—yet the interface does not visually distinguish these interpolated non-meaningful frames from genuine keyframes, which could mislead analysts.
- The Laplacian Eigenmaps tour strategy details (cumulative circular basis construction, choice of graph construction parameters) are deferred to supplementary material not included in the main text, limiting reproducibility assessment from the paper alone.
- No adversarial or stress-test evaluation: the tool is not tested on pathological datasets (e.g., near-duplicate keyframes causing numerical instability in SVD, very high p dimensions causing Gram-Schmidt numerical drift, or datasets where Procrustes alignment fails due to reflection ambiguity).
- The 276K vs. 290K cell count discrepancy between the paper text and Figure 2 caption is unexplained and suggests possible inconsistency in dataset preprocessing or subsetting.
Open questions / follow-ons
- How does analyst insight quality (measured by, e.g., think-aloud protocol or downstream task accuracy) compare between dtour's unified interface and dedicated single-mode tools like tourr or langevitour on identical datasets and tasks?
- Can the sequential embedding tour be extended to handle datasets where point correspondence is not one-to-one (e.g., comparing embeddings of different corpora or across model vocabulary differences), potentially via soft alignment or optimal transport?
- What is the perceptual optimal arc-length sampling resolution (currently fixed at 8 points per segment) as a function of dataset dimensionality, keyframe count, and geodesic distance variance—and does adaptive sampling improve perceived smoothness at low FPS?
- Could projection pursuit optimization (as in Cook et al.'s guided tour) be integrated as a fifth tour strategy that runs asynchronously in a web worker, steering the tour toward projections maximizing an interestingness criterion while maintaining the scrub-and-select UX?
Why it matters for bot defense
For bot-defense and CAPTCHA practitioners, dtour's most direct relevance lies in the embedding validation workflow. Teams that embed behavioral signals—mouse dynamics, keystroke timing, request sequences, device fingerprints—into dense vector spaces for bot/human classification routinely face the interpretability problem: does a cluster in a UMAP represent a genuine behavioral phenotype or a UMAP artifact? The UMAP-validating PCA tour demonstrated on single-cell data applies directly: sweeping through PCA component pairs alongside a UMAP of the same PCA space allows an analyst to confirm whether a suspicious cluster (e.g., a tight group of sessions flagged as bots) is present in the linear structure or was manufactured by UMAP's repulsive forces. The Fashion MNIST finding—that 96 points formed a tight cluster solely due to repulsion magnitude, not genuine similarity—is a concrete cautionary example for any team that treats UMAP cluster membership as ground truth for labeling bot sessions.
The sequential model comparison use case is also actionable: bot-defense teams frequently evaluate multiple embedding models (e.g., different versions of behavioral encoders or session transformers) and need to understand whether a model change shifts which sessions cluster together. The 3M arXiv tour showing that F2LLM clusters physics education papers by discourse style while SPECTER2 distributes them by subfield is a direct analogy to a behavioral encoder that might cluster bots by scripting framework rather than by attack intent. dtour provides a browser-native, Python-integrated tool for this kind of qualitative audit without requiring a data scientist to write custom visualization code. The scalability to millions of points (relevant for session-level data at large platforms) and the lasso-then-manual-explore workflow are practically useful. However, the absence of any quantitative evaluation means teams would need to run their own validation studies before relying on dtour for consequential labeling or model selection decisions.
Cite
@article{arxiv2605_04306,
  title={ dtour: a steerable tour de vis through high-dimensional data },
  author={ Fritz Lekschas and Nezar Abdennur },
  journal={arXiv preprint arXiv:2605.04306},
  year={ 2026 },
  url={https://arxiv.org/abs/2605.04306}
}