
Green by Design? Investigating the Energy and Carbon Footprint of Chia Network
Source: arXiv:2604.13044 · Published 2026-03-05 · By Soraya Djerrab, Clémentine Gritti, Rahima Benzenati
TL;DR
This paper asks a simple but important question: if Chia is marketed as a greener blockchain because it replaces computation with storage, what is its real energy and carbon footprint once you account for the full lifecycle cost of plotting, farming, hardware wear, and embodied emissions? The authors argue that prior public claims focus too narrowly on operational electricity and miss the heavy cost of plot creation plus the hardware that must be bought, replaced, and kept running.
Their contribution is a combined empirical and modeling study. They first measure plotting and farming on a controlled Grid’5000 testbed, then scale those measurements to network-wide annual emissions using two models: a homogeneous server-only model and a more granular cohort model that separates servers, desktops, and laptops and assigns different PUE and embodied-carbon parameters. The main result is that Chia’s annual footprint is estimated at 0.884 MtCO2/year in the cohort model and 1.32 MtCO2/year in the homogeneous model, far above Chia’s own implied figure (~0.05 MtCO2/year) and much larger than most PoS blockchains.
The paper’s larger point is methodological as much as substantive: for systems like Chia, sustainability claims can be badly distorted if you ignore storage wear, hardware replacement, and the actual mix of machines doing the work. The authors explicitly frame Chia as a case where “green” branding survives only by narrowing the accounting boundary.
Key findings
- The cohort-based model estimates Chia at 0.884 MtCO2/year, while the homogeneous server-only model gives 1.32 MtCO2/year; both are far above Chia’s own claimed footprint of about 0.05 MtCO2/year.
- The paper says the 0.884 MtCO2/year estimate is about 18× higher than Chia’s claimed figure, while the 1.32 MtCO2/year estimate is about 27× higher.
- Standard Chia plotting on the testbed costs 4,995.0485 Wh and 1.64 TiB of disk writes per plot, versus 85.968 Wh and 0.0813125 TiB for BladeBit GPU plotting.
- MadMax plotting reduces energy to 927.634 Wh per plot, still about 5.3× lower than standard Chia plotting but about 10.8× higher than BladeBit GPU mode.
- Farming 20 plots still consumed 771.836 Wh over 60 minutes in the authors’ experiment, supporting their claim that the farming phase is non-trivial when scaled to 250k nodes.
- In their sensitivity analysis, emissions ranged from 0.584 to 1.402 MtCO2/year depending on hardware mix and compression assumptions.
- Embodied carbon was not a minor term: the paper reports 230,042.037 tCO2/year total embodied emissions in Method 1, with embodied carbon contributing 17–66% of total emissions across scenarios.
- The paper states that even the lowest sensitivity scenario (0.584 MtCO2/year) exceeds the cited footprints of PoS blockchains such as Algorand (0.000389 MtCO2/year), Tezos (0.000075 MtCO2/year), Celo (0.000010319 MtCO2/year), Cardano (0.000172 MtCO2/year), Polkadot (0.000309 MtCO2/year), Avalanche (0.001146367 MtCO2/year), Solana (0.005279701 MtCO2/year), and Ethereum PoS (0.001313 MtCO2/year) by more than two orders of magnitude.
Threat model
The paper assumes a real-world Chia deployment with ordinary farmers running full nodes, harvesters, farmers, and wallets on heterogeneous hardware, and an external evaluator who can observe public network statistics such as netspace and node counts. The evaluator cannot inspect private operator infrastructure, so the model relies on public data plus controlled measurements. The main risk is not an attacker but incomplete disclosure: if the network mix, compression adoption, or hardware lifespan differs materially from assumptions, the estimated emissions can shift. The model does not assume any adversary can alter the protocol; it assumes honest-but-diverse operation and asks what that implies for carbon accounting.
Methodology — deep read
The threat model is not an adversarial security model in the usual cryptographic sense; it is an accounting and systems-modeling problem. The authors assume a real Chia network with ordinary farmers, real-world hardware heterogeneity, and publicly observable network statistics. Their “adversary,” insofar as there is one, is optimistic marketing or incomplete accounting: claims that omit plot creation, hardware replacement, or embodied emissions. They do not model an attacker trying to break PoST; instead they model the system under normal operation and ask what it costs environmentally. That means the key assumptions are about who farms, what hardware they use, how often hardware is replaced, and how much of the network is using compressed plots.
For the data, the empirical portion uses the Grid’5000 Lyon “Gemini” node, an Nvidia DGX-1 with dual Intel Xeon E5-2698 v4 CPUs, 512 GiB RAM, 480 GB SSD storage, and 8× Tesla V100 GPUs. They ran 10 experiments on Chia version 2.5.2 across five scenarios: standard Chia plotting, BladeBit RAM plotting, BladeBit GPU plotting, MadMax plotting, farming with standard k32 plots, and farming with compressed C5 plots. Each setup appears to have been run multiple times, with Table 1 reporting averages from 6–10 runs per configuration. For measurement, they relied on Kwollect wattmeter data for whole-node energy and /proc/diskstats for disk writes; they mention pidstat, iotop, Scaphandre, and CodeCarbon as cross-checks but do not use them in the final model because of over-/under-estimation or implementation constraints. The paper is explicit that energy comes from Kwollect and I/O from diskstats, which is a good reproducibility choice.
The algorithmic core is actually a lifecycle carbon model rather than a machine-learning or protocol algorithm. The authors define common parameters such as total netspace (33.8465 EiB at 2024/02/01), netspace growth (12.6593 EiB/year from 2023/02/01 to 2024/02/01), node count (250,000), plot size (101.4 GiB for k=32; 81.3 GiB for compressed C5), PUE (1.58 for servers, from literature), U.S. grid carbon intensity (0.384 kgCO2/kWh), and embodied-carbon coefficients for SSDs, HDDs, GPUs, and servers. They then build two complementary models. Method 1 is homogeneous: it scales empirical per-plot and per-node energy to the whole network using a single PUE factor and a single hardware profile, with plotting energy split across standard, MadMax, and BladeBit according to assumed adoption shares. Method 2 is cohort-based: the network is divided into servers (15%), desktops (60%), and laptops (25%), with different PUEs, plotting power draw, embodied-carbon assumptions, and plot-compression adoption rates. This second model is the more realistic one because it attempts to capture heterogeneity in who farms and what hardware they use.
The training regime is not applicable in the ML sense; there is no model training. Instead, the “regime” is experimental execution. The paper does not report hyperparameters, seeds, or optimizer settings because there is no learned model. What matters is the hardware and software configuration: Chia 2.5.2, fixed bash automation, controlled testbed, and repeated runs. The paper also states that compressed plots were assumed to be 60% of server-generated plots, MadMax 30%, and standard plotting 10% among server-equipped farmers in Method 1; in Method 2, servers hold 65% of plot share, desktops 30%, laptops 5%, with varying adoption of BladeBit and MadMax. One concrete end-to-end example from Method 1: for standard plotting, they take the empirical per-plot energy of 4.995 kWh, multiply by the number of standard plots inferred from annual netspace growth and assumed standard-plot share, apply PUE, and then convert to carbon using the U.S. grid intensity. They then add embodied carbon from SSD writes by scaling total writes per plot against SSD TBW and embodied emissions per TiB, plus HDD and server/GPU CAPEX emissions. The final output is total annual carbon.
Evaluation is a combination of controlled measurement and scenario-based modeling. The empirical metrics are plotting duration, energy in Wh/kWh, and SSD writes in TiB. The modeled outputs are annual operational energy, electricity-related carbon, embodied carbon, and total carbon. The paper compares Method 1 versus Method 2 and also runs a sensitivity analysis with three extra scenarios: homogeneous servers without compression, tiered cohorts without compression, and tiered cohorts with lower server plot share. The main reported results are not statistical tests but deterministic estimates under stated assumptions. There is no confidence interval, no formal uncertainty propagation, and no held-out validation against an independent ground truth; instead, the paper validates component measurements against multiple monitoring tools and then uses literature parameters for the network-scale extrapolation. Reproducibility is relatively strong on the experimental side: the authors say all source code is available in a public GitHub repository, and they reference a master’s thesis for more details. The dataset itself is not a public labeled benchmark, but the network parameters and literature constants are cited, and the testbed setup is documented closely enough that a reader could reproduce the experiments on comparable hardware.
Technical innovations
- Combines direct energy and disk-I/O measurements with lifecycle carbon accounting, rather than estimating Chia’s footprint from electricity use alone.
- Introduces two scaling models for Chia’s annual emissions: a homogeneous server-only model and a heterogeneous cohort model spanning servers, desktops, and laptops.
- Accounts explicitly for embodied emissions from SSD wear, HDD storage, GPUs, and server CAPEX, which are usually omitted in blockchain energy studies.
- Uses compression-specific plotting/farming configurations (e.g., BladeBit C5) as first-class inputs to the carbon model, not just as performance optimizations.
Datasets
- Grid’5000 Lyon Gemini node experiments — 10 experimental scenarios, 6–10 runs per scenario — controlled testbed (public research infrastructure)
- Chia network parameters — netspace 33.8465 EiB, netspace growth 12.6593 EiB/year, node count 250,000 — public sources (Spacescan, Chia docs, related references)
Baselines vs proposed
- Chia standard plotter vs BladeBit GPU: energy per plot = 4,995.0485 Wh vs 85.968 Wh
- Chia standard plotter vs BladeBit GPU: duration per plot = 379.02 min vs 7.346 min
- Chia standard plotter vs MadMax: energy per plot = 4,995.0485 Wh vs 927.634 Wh
- Chia standard plotter vs BladeBit GPU: disk writes per plot = 1.64 TiB vs 0.0813125 TiB
- Method 1 vs Method 2: annual carbon = 1.32 MtCO2/year vs 0.884 MtCO2/year
- Chia claim vs Method 2: annual carbon ≈ 0.05 MtCO2/year claimed vs 0.884 MtCO2/year estimated
Figures from the paper
Figures are reproduced from the source paper for academic discussion. Original copyright: the paper authors. See arXiv:2604.13044.
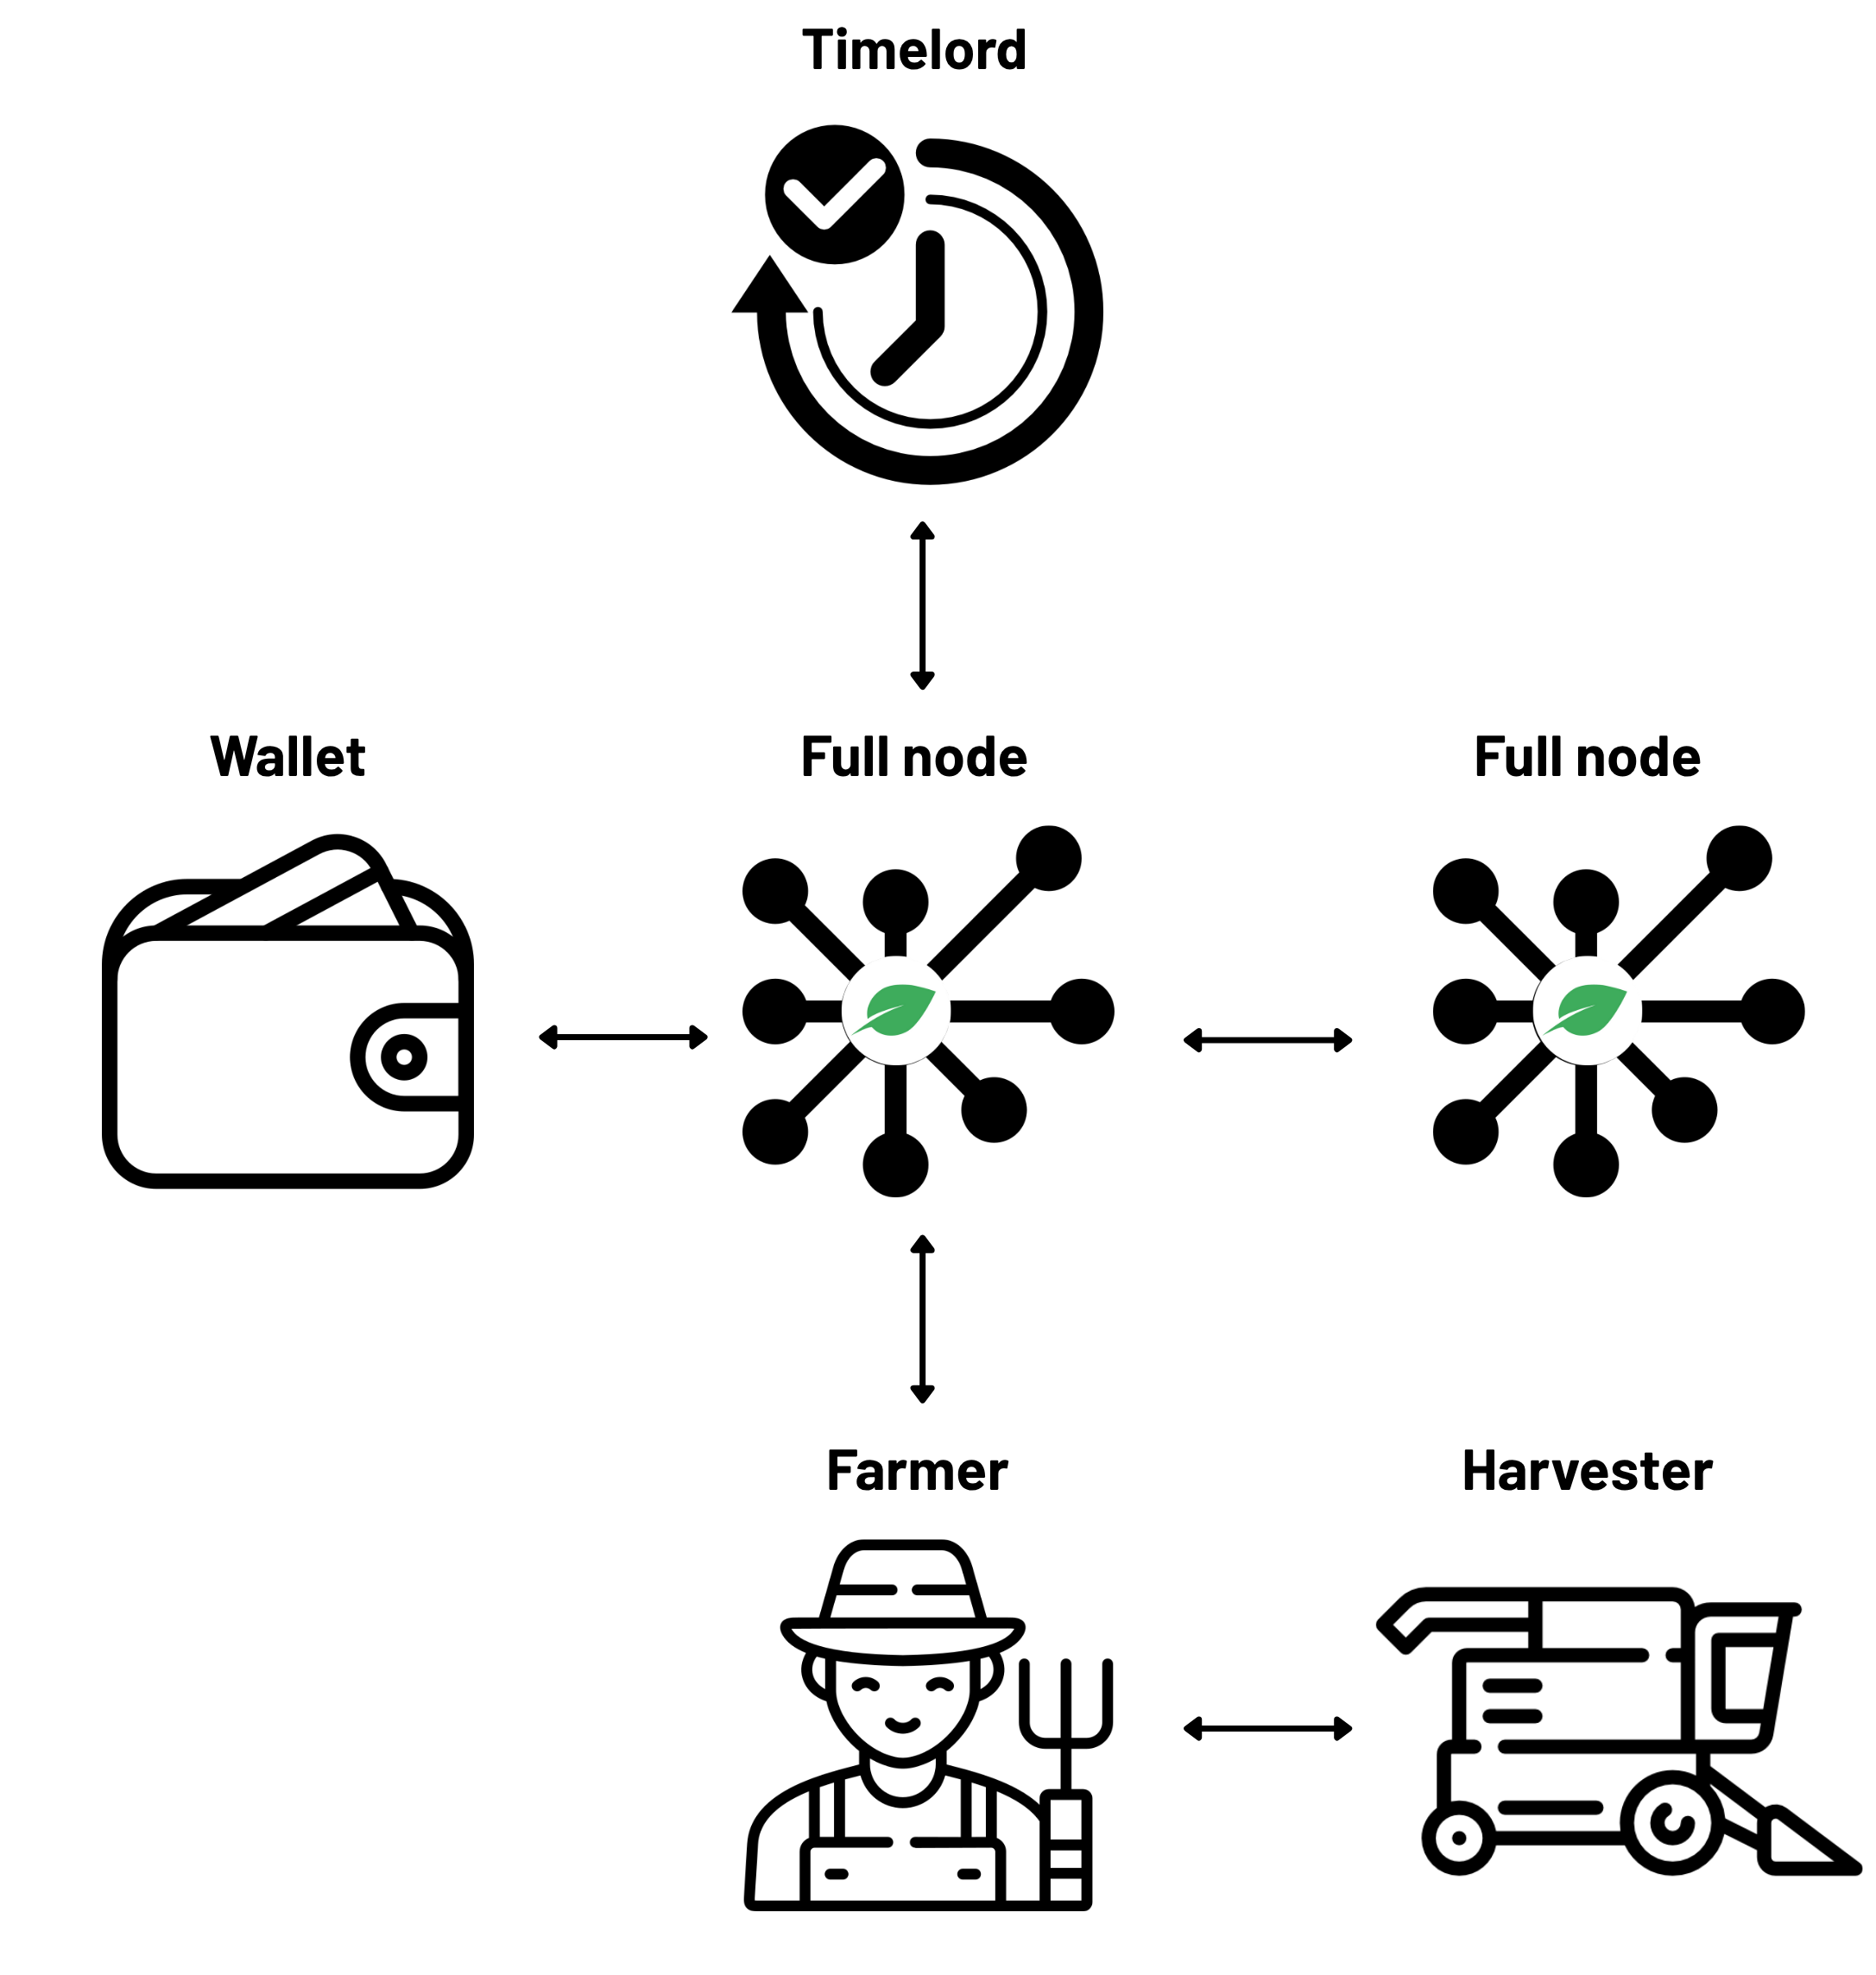
Fig 1: Chia’s architecture overview
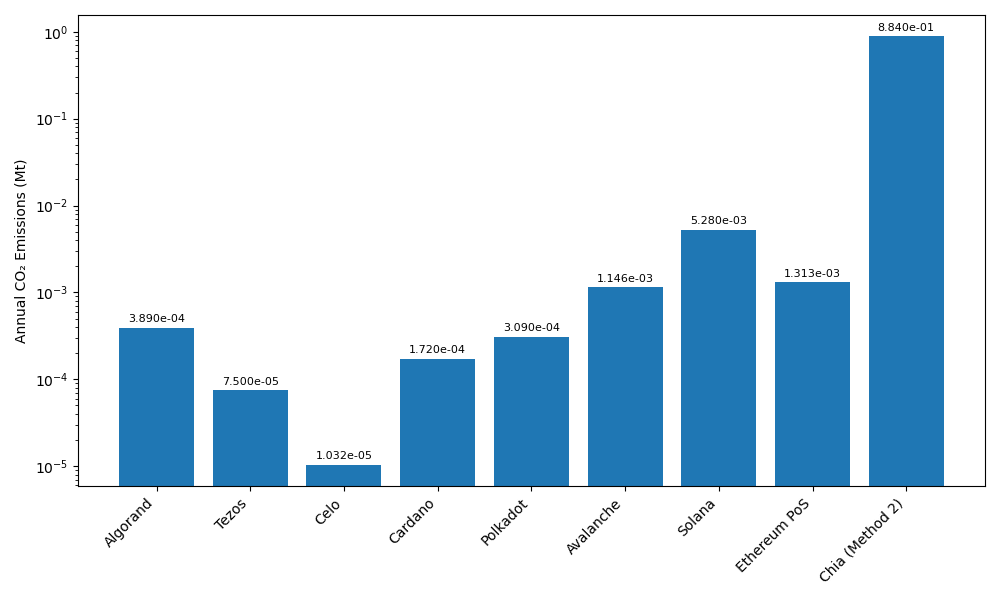
Fig 2: Comparison of annual CO2 emissions across blockchains (log scale).
Limitations
- The network-wide model depends on many assumed shares and literature-derived constants, including node counts, PUE, hardware lifetimes, and adoption rates for compression and plotters.
- Empirical measurements were run on one high-end testbed node; the paper does not report a broad hardware sweep across consumer machines or geographically diverse deployments.
- The farming experiment used only 20 plots, and the authors note they saw no noticeable difference between compressed and uncompressed farming at that small scale.
- There is no uncertainty interval, formal error propagation, or statistical hypothesis test for the final MtCO2/year estimates.
- The carbon-intensity assumption uses a U.S. grid value and the authors explicitly assume most farmers are U.S.-based; this may not match actual geographic distribution.
- Some inputs are taken from external websites or secondary references rather than primary measurements of the live Chia network, so model accuracy is sensitive to source quality.
Open questions / follow-ons
- How much do the estimates change if farm locations are weighted by actual regional electricity mixes instead of a single U.S. carbon-intensity value?
- What is the empirical distribution of real Chia hardware across consumer desktops, laptops, and servers, and how stable is that distribution over time?
- How should embodied emissions be amortized for shared hardware that also serves non-Chia workloads, especially for servers and desktops?
- What is the transaction-level carbon cost of Chia when normalized by actual throughput or smart-contract usage rather than by network-wide annual totals?
Why it matters for bot defense
For bot-defense and CAPTCHA practitioners, the main takeaway is methodological: resource costs can be badly mischaracterized if you only measure the visible online phase and ignore the expensive setup phase plus hardware churn. In CAPTCHA systems, that maps to the difference between per-request solve cost and the broader cost of building and maintaining solver infrastructure at scale.
A defender could use this style of analysis to compare attack economics more honestly: measure not just solve latency or GPU-hours, but the embodied cost of the hardware fleets and the operational mix that attackers actually use. The paper also shows why coarse “one number” sustainability or cost claims are fragile; a realistic model needs segmentation by hardware cohort, workload phase, and geographic energy mix.
Cite
@article{arxiv2604_13044,
  title={ Green by Design? Investigating the Energy and Carbon Footprint of Chia Network },
  author={ Soraya Djerrab and Clémentine Gritti and Rahima Benzenati },
  journal={arXiv preprint arXiv:2604.13044},
  year={ 2026 },
  url={https://arxiv.org/abs/2604.13044}
}