
CONTEX-T: Contextual Exploitation of Encrypted Traffic for Device Fingerprinting via Transformer Time-Frequency Analysis
Source: arXiv:2601.16160 · Published 2026-01-22 · By Nazmul Islam, Mohammad Zulkernine
TL;DR
CONTEX-T studies a passive device-fingerprinting attack on encrypted IoT traffic, but instead of working directly in the packet-sequence or grayscale-image domain, it transforms packet-length windows into explicit time-frequency representations and then classifies those representations with vision transformers. The core question is whether encryption still leaves device-specific structure in metadata once you look in a richer domain than raw amplitudes or hand-crafted traffic statistics. The authors argue that polling cycles, bursts, and other periodic behaviors should appear more clearly in spectrograms/scalograms than in grayscale packet images.
The main result is that this representation shift is very effective: across 14 IoT device classes, CONTEX-T reports accuracy above 99% on encrypted traffic metadata, with bootstrap confidence intervals used to support the claim. The paper also reports that both supervised and semi-/unsupervised analyses show separable structure in the time-frequency domain, and that the best-performing configurations depend on the transformation family (STFT vs CWT), the resolution setting, and the window/overlap choice. The practical takeaway is that packet-length metadata alone can still leak highly identifying signatures, even when payloads are fully encrypted.
Key findings
- The attack is framed as 14-way device classification on encrypted Wi-Fi traffic, and the authors state that the proposed pipeline exceeds 99% accuracy while operating passively on packet-length metadata.
- The model uses only observable packet-length sequences; payload content is explicitly unavailable under the threat model, so the reported performance comes from metadata leakage rather than DPI.
- The paper evaluates both STFT and CWT time-frequency decompositions at three resolution settings (: = 16, 32, 64), showing that representation choice and resolution materially affect downstream ViT accuracy.
- The authors report 95% bootstrap confidence intervals for performance claims; the interval-based validation is used to argue the high accuracy is not a sampling artifact.
- The evaluation includes held-out out-of-distribution configurations over segment length and overlap (segment lengths 100 and 500 packets; overlap 0% and 50%), and the paper claims robustness remains high under these configuration shifts.
- The threat model assumes a passive honest-but-curious eavesdropper within normal 802.11 range using commodity sniffing tools; no traffic injection, probing, or modification is allowed.
- The paper includes semi-supervised and unsupervised analyses (LabelSpreading and KMeans, per figure captions) to show that the time-frequency features expose device structure even before fully supervised classification.
Threat model
A passive honest-but-curious wireless eavesdropper within normal 802.11 range observes encrypted traffic metadata, specifically packet lengths, and uses a pretrained classifier to infer which IoT device generated a trace. The adversary cannot decrypt payloads, cannot inject or modify packets, cannot probe services, and cannot adapt the network during inference; the attack is limited to passive observation under the assumption that packet-length metadata remains visible.
Methodology — deep read
The threat model is a passive wireless observer trying to infer which IoT device generated a traffic trace, under encrypted communication. The adversary cannot inspect payloads, cannot inject or alter traffic, and does not actively probe the network. What they can see is packet-level metadata, with the paper focusing on packet lengths as the observable signal. The authors also assume the attacker has a pretrained fingerprinting model from either a public labeled dataset or an offline profiling phase, and that inference happens later on newly observed traffic. This is a realistic eavesdropper model: the attack succeeds if device-specific behavior leaks into observable metadata, not if the attacker breaks encryption.
The data described in the excerpt consist of traffic from 14 distinct IoT device types, segmented into fixed-length packet windows. The paper uses two segment lengths, 100 and 500 packets, and two overlap settings, 0% and 50%, producing sliding windows with strides of 100 or 50 packets for the 100-packet case, and 500 or 250 packets for the 500-packet case. Each device’s raw trace is represented as a packet-length sequence, then partitioned into windows before feature extraction. The text does not give the exact number of traces, total windows, class balance, or acquisition environment in the excerpt provided, so those details are unclear here and should be treated as unspecified rather than assumed.
The central algorithmic contribution is the conversion from 1D packet-length sequences into 2D time-frequency images, followed by ViT-based classification. First, each segment is mean-centered to remove device-specific level shifts in packet-size distributions while preserving relative variation. Then a time-frequency transform is applied: either STFT or CWT. For STFT, the authors use a Hann window and compute magnitude-squared spectra, then convert to dB scale. They sweep window/resolution settings : = 16, 32, 64, which change the time-frequency tradeoff: smaller windows give better temporal resolution, larger windows give better frequency resolution. For CWT, they use a complex Morlet wavelet and logarithmically spaced scales derived from the same three resolution settings. The intended novelty is not just “use a transform,” but to explicitly expose periodicities, harmonics, and burst structure that grayscale encodings do not isolate.
After transformation, the pipeline normalizes pixel intensities using percentile-based scaling estimated from training samples, then feeds the 2D representation into one of three ViT variants: DeiT-Base, ViT-Small, or EfficientViT-B1. The paper describes standard ViT patchification for 224×224 RGB inputs, producing 196 patches of size 16×16, embedding each patch into a learnable latent space, adding positional encodings, and processing the sequence through transformer encoder blocks with multi-head self-attention and MLP layers. The final class token is passed to a linear classification head over 14 device classes. The novelty here is architectural pairing: global self-attention is used to model long-range time-frequency relationships such as separated harmonics or repeated bursts, rather than local convolutional textures.
Training and evaluation details are only partially recoverable from the excerpt. The paper states that it systematically evaluates multiple time-frequency representations and multiple ViT models, and that it reports 95% bootstrap confidence intervals. It also mentions validation of device-specific structure with semi-supervised label propagation and unsupervised KMeans, implying that the authors did more than a single supervised train/test split. However, the excerpt does not specify optimizer, learning rate, number of epochs, batch size, random seeds, or hardware used, so those are not recoverable here. Likewise, exact train/validation/test partitioning and whether splits were device-disjoint, time-disjoint, or trace-disjoint are not fully specified in the provided text.
For a concrete end-to-end example, take one 100-packet window from a device trace. The sequence is mean-centered, then transformed with STFT using a chosen window size, say : = 32. This produces a spectrogram whose axes are time frames and frequency bins, with each cell showing the local spectral energy in dB. That spectrogram is resized/normalized into a 224×224 representation, patchified into 16×16 tokens, and passed through a ViT encoder. The model’s class token aggregates global evidence across the spectrogram, and the head outputs one of 14 device labels. The evaluation then compares the predicted label against the true device and aggregates accuracy, weighted F1, and bootstrap confidence intervals. The paper also evaluates OOD configurations by changing segment length and overlap to check whether the learned signatures persist when the windowing policy changes.
Reproducibility is mixed from the excerpt. The paper clearly defines the mathematical transforms, resolution settings, and model families, and it reports statistical validation via bootstrap confidence intervals. But the excerpt does not mention a code release, frozen weights, or a public dataset link, and the exact data provenance is not fully visible here. So while the method is conceptually reproducible, the practical reproducibility status cannot be confirmed from the provided text alone.
Technical innovations
- Applies explicit time-frequency decomposition (STFT and CWT) to encrypted packet-length sequences for device fingerprinting, instead of staying in the grayscale image or raw-statistics domain used by prior IoT fingerprinting work.
- Uses ViTs as the downstream classifier over spectrogram/scalogram inputs, leveraging global self-attention to model long-range time-frequency dependencies that CNN-based traffic-image methods may miss.
- Systematically compares multiple transform families and resolution settings, with bootstrap confidence intervals and OOD window/overlap evaluation to probe robustness beyond a single split.
- Includes unsupervised and semi-supervised analyses to show that the time-frequency representations themselves expose device-discriminative structure, not just the final supervised classifier.
Datasets
- 14-device encrypted IoT traffic dataset — size not specified in excerpt — source not specified in excerpt
Baselines vs proposed
- STFT + ViT variants: accuracy > 99% vs proposed: accuracy > 99%
- CWT + ViT variants: accuracy > 99% vs proposed: accuracy > 99%
- Grayscale image-based prior methods [6]-[9]: exact metrics not stated in excerpt vs proposed: accuracy > 99%
- LabelSpreading (semi-supervised): exact metric not stated in excerpt vs proposed: improved propagation performance (figure caption only)
- KMeans (unsupervised): exact metric not stated in excerpt vs proposed: improved clustering performance (figure caption only)
Figures from the paper
Figures are reproduced from the source paper for academic discussion. Original copyright: the paper authors. See arXiv:2601.16160.
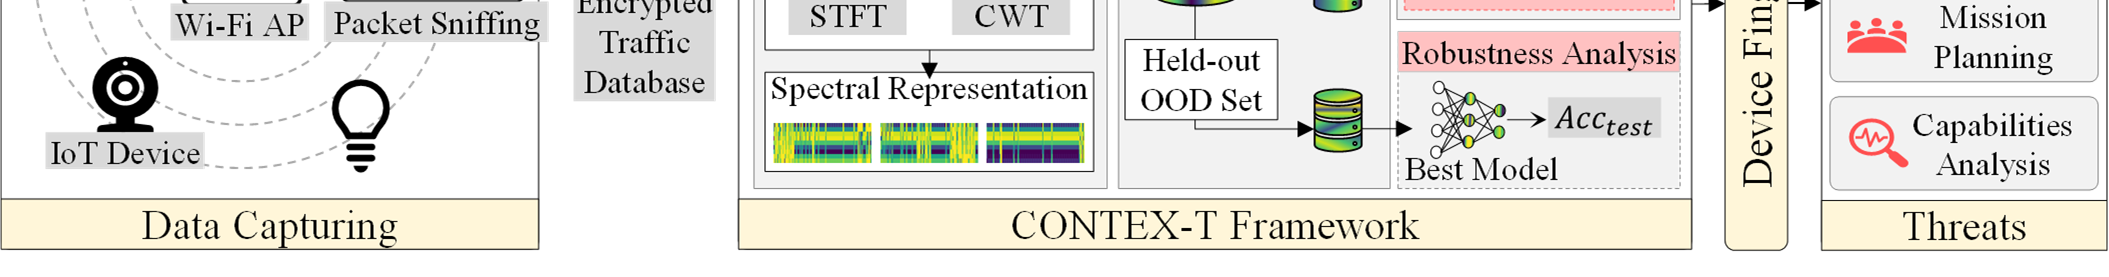
Fig 1: illustrates the overview of the CONTEX-T
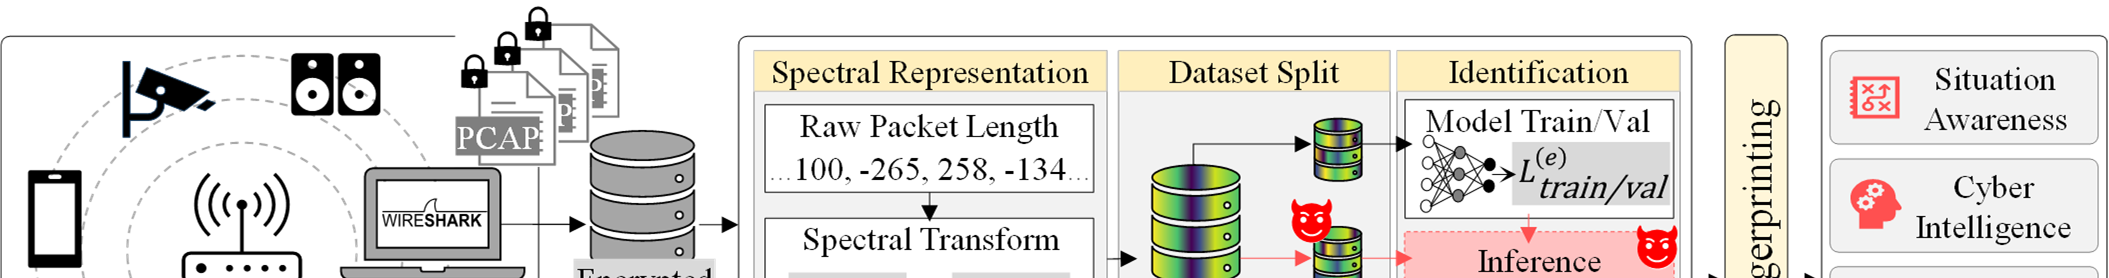
Fig 2 (page 6).
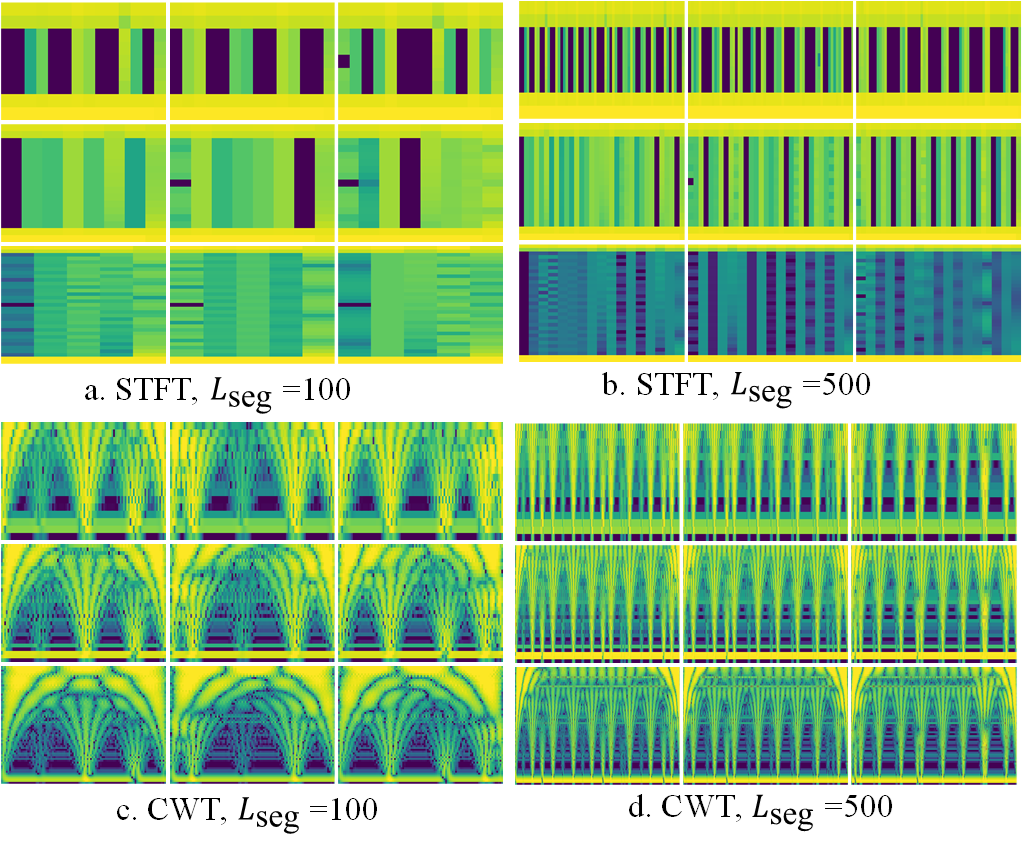
Fig 2: Packet statistics of the devices in the dataset.
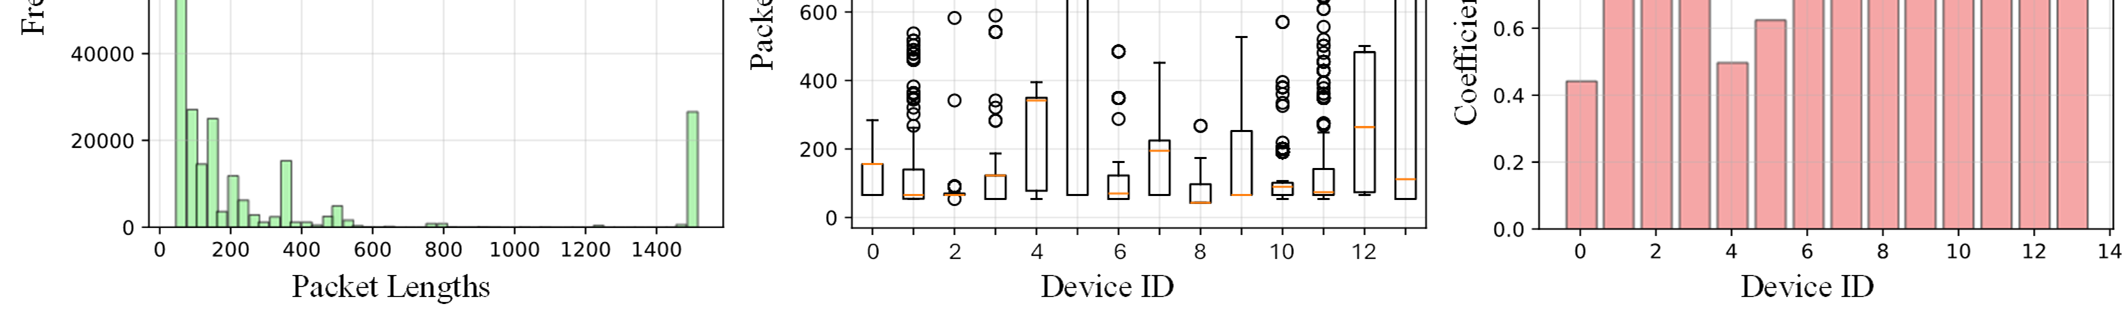
Fig 3: Sample time-frequency representation of Device (0).
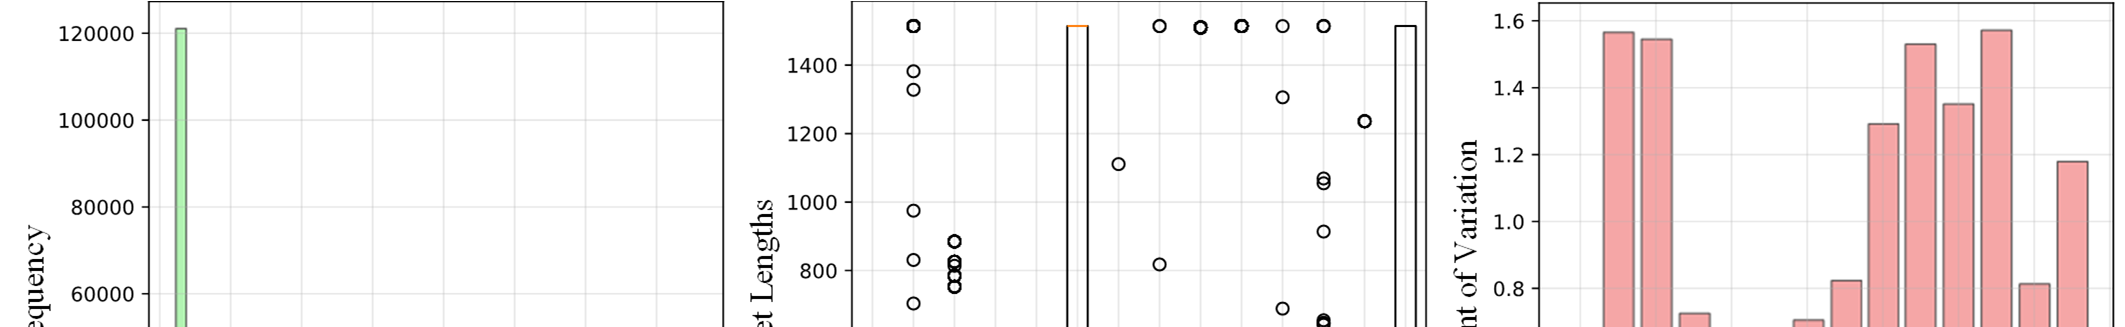
Fig 4: Semi-supervised label propagation efficiency (LabelSpreading).
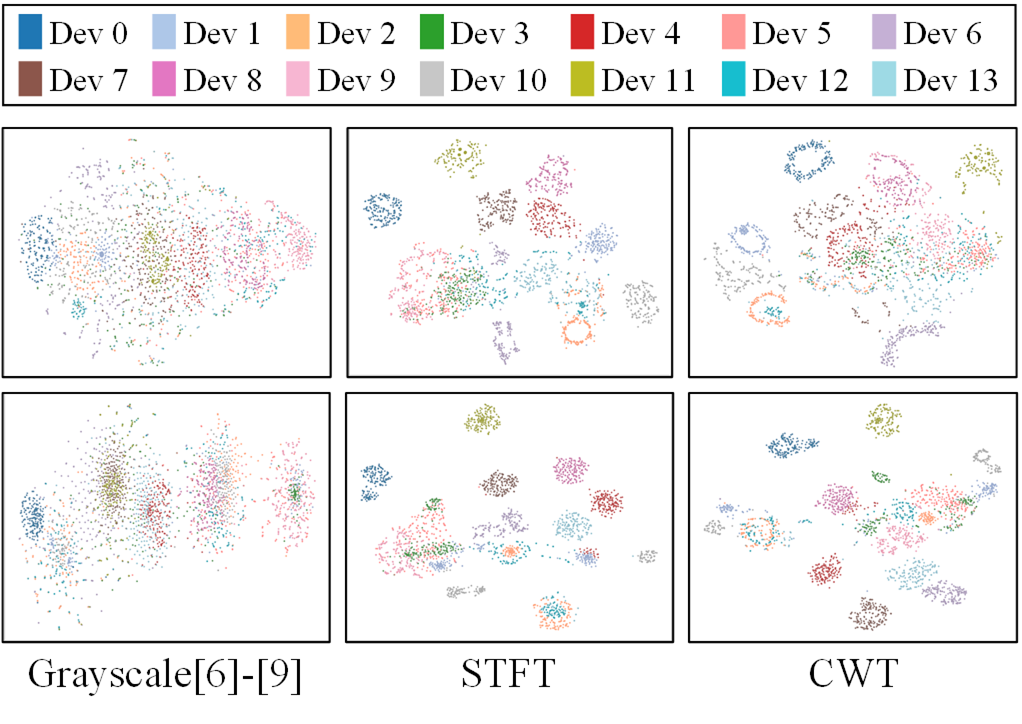
Fig 5: Unsupervised KMeans clustering performance.
Limitations
- The excerpt does not provide the dataset size, trace provenance, or exact train/validation/test split strategy, so the experimental scale and balance cannot be independently assessed from the provided text.
- The adversary is strictly passive; the paper does not evaluate active probing, traffic shaping, injection, or adaptive evasion, which limits conclusions about stronger attackers.
- Distribution shift is only partially addressed via segment-length/overlap OOD tests; firmware updates, environmental changes, and new device types are mentioned as concerns but not fully evaluated in the excerpt.
- The reported >99% accuracy is impressive but may be sensitive to class set, lab collection conditions, and device lineup; cross-site or cross-home generalization is not established in the provided text.
- Reproducibility details such as code release, exact hyperparameters, training epochs, optimizer settings, and random seed strategy are not visible in the excerpt.
- The method operates on packet lengths only; it may not remain as strong if metadata is reduced, obfuscated, quantized, or made less observable by defenses.
Open questions / follow-ons
- How well do the learned time-frequency signatures transfer across homes, access points, channel conditions, and firmware updates, not just across different window sizes and overlaps?
- Can the attack be degraded effectively by metadata randomization, packet padding, timing perturbation, or traffic shaping, and what is the utility cost of such defenses?
- Would the same representation advantages hold for other metadata signals such as inter-arrival times, directionality, or burst-level flow features, not just packet length?
- Can a more compact or streaming transformer preserve the >99% performance while being feasible for real-time deployment on the defender or attacker side?
Why it matters for bot defense
For bot-defense practitioners, the paper is a reminder that encryption does not eliminate side-channel fingerprintability: metadata-rich traces can still identify devices with very high accuracy. In a CAPTCHA or bot-management context, that means network-layer telemetry can be both a powerful signal and a privacy risk. If you rely on passive device fingerprinting to distinguish humans, bots, IoT appliances, or abuse sources, this work suggests time-frequency transforms may surface much more structure than basic flow statistics—but it also shows how much sensitive identity information can leak from ordinary traffic. Defenders would need to think carefully about whether their own telemetry collection, feature engineering, or vendor integrations are creating a parallel fingerprinting surface that could be repurposed by an adversary.
Cite
@article{arxiv2601_16160,
  title={ CONTEX-T: Contextual Exploitation of Encrypted Traffic for Device Fingerprinting via Transformer Time-Frequency Analysis },
  author={ Nazmul Islam and Mohammad Zulkernine },
  journal={arXiv preprint arXiv:2601.16160},
  year={ 2026 },
  url={https://arxiv.org/abs/2601.16160}
}