
Optic Fingerprint(OFP): Enhancing Security in Li-Fi Networks
Source: arXiv:2504.12956 · Published 2025-04-17 · By Ziqi Liu, Xuanbang Chen, Xun Zhang
TL;DR
This paper tackles a practical security gap in Li-Fi / visible light communication: how to authenticate transmitters without adding heavyweight cryptography or breaking IEEE 802.15.7 compatibility. The authors’ idea is to turn unavoidable LED hardware nonidealities into a device fingerprint, then embed fingerprint-bearing data into the normal Li-Fi frame structure so identification can happen as part of the physical/link layer workflow rather than as an external add-on.
What is new here is not LED fingerprinting per se, but the protocol-integrated formulation: they define an Optic Fingerprint (OFP) feature set based on amplitude statistics in the time and frequency domains, map it into an IEEE 802.15.7-compatible payload structure, and evaluate it on 39 commercial white LEDs. In their lab setup plus noise/distance simulations, the best reported classifier reaches 91.08% accuracy on the clean lab data and 90.36% under the stated SNR/distance sweep, while BER stays within the IEEE 802.15.7 target (below 10^-3 at SNR >= 10 dB). The evidence suggests OFP is feasible as a lightweight physical-layer authentication signal, but the paper’s evaluation is still mostly controlled-lab and simulation-based.
Key findings
- 39 commercial LEDs were used in the database; the paper reports 90.36% classification accuracy at SNR/distance sweep conditions and 91.08% on the clean laboratory feature set with SVM linear.
- The combined feature vector (mean amplitude, variance, baseband amplitude) outperformed individual features (f_base, Mean Mean, Period Variance) across KNN, EnsembleKNN, and SVM linear in Fig. 8.
- Under Gaussian-noise simulation from 10 dB to 30 dB SNR, the combined feature set stayed above 70% accuracy at 10 dB and above 90.03% at 30 dB and above (Fig. 9).
- In the distance sweep from 5 cm to 30 cm, accuracy peaked at 90.36% at 30 dB SNR, and remained above 70% even at 10 dB across all tested distances (Fig. 10).
- BER satisfied the IEEE 802.15.7 standard target, dropping below 10^-3 at SNR levels of 10 dB or higher (Fig. 11).
- The experimental dataset was collected at 3 cm in the text to suppress channel effects, but the setup description also states testing at 30 cm; the paper does not fully reconcile this inconsistency.
- The authors report that SVM linear performs best at higher SNRs, while EnsembleKNN is strongest at lower SNRs (Fig. 9), indicating classifier choice materially affects robustness.
Threat model
The adversary is an unauthorized optical transmitter or impersonator attempting to pass as a legitimate LED device within a Li-Fi link. The system assumes the attacker can observe or participate in the optical channel, but cannot perfectly reproduce the target LED’s inherent nonlinear hardware response or the exact amplitude signature induced by manufacturing tolerances. The paper does not explicitly model a sophisticated attacker with access to the same LED model, detailed channel knowledge, or the ability to fine-tune emission to mimic the target fingerprint.
Methodology — deep read
Threat model and assumptions: the paper’s security model is a transmitter-authentication problem in a Li-Fi downlink. The adversary is an unauthorized device or emitter trying to masquerade as a legitimate LED transmitter, or a passive observer trying to exploit broadcast nature of Li-Fi. The authors assume the attacker cannot perfectly clone device-specific LED nonlinearities and that the receiver can observe the optical waveform. The work does not develop an explicit active spoofing model, replay model, or adaptive adversary who measures the target LED and crafts a close imitation; instead it relies on the premise that manufacturing-level differences in LED response are sufficiently stable to serve as identifiers. It also assumes a fixed receiver/channel during feature extraction so that observed amplitude differences can be attributed mainly to the transmitter hardware.
Data and provenance: the experimental dataset is collected from 39 commercial white LEDs drawn from four product families named in the text: Cree XTE, Cree XPE2, LUMILEDS REBEL-LXMA, and LG3535. The setup uses a 200 kHz square wave at 10 V peak-to-peak from a Keysight 33500B waveform generator, a New Focus 1601 photodetector, and a Keysight MSOX6004A oscilloscope. The paper says the experimental data are gathered under controlled short-distance conditions to reduce channel effects and isolate LED variation; the text mentions 3 cm in one place and 30 cm in another, so the exact acquisition distance is not entirely consistent in the source. For simulations, they inject Gaussian noise and sweep SNR over {10, 15, 20, 25, 30} dB and distance over {5, 10, 15, 20, 25, 30} cm under a line-of-sight (LOS) channel with OOK modulation. The paper does not specify train/test split ratios, cross-validation protocol, number of frames per LED, or whether samples from the same physical device are split across train and test in a way that might leak device-specific temporal correlations.
Architecture / algorithm: the core contribution is the OFP feature design and protocol embedding. The authors model the LED as a nonlinear, device-specific transfer function H_led(t), combine it with an optical wireless channel H_channel(t) and receiver response H_rx(t), and argue that under fixed channel/receiver conditions the residual amplitude variation is dominated by LED hardware. From that they select three amplitude-based features: mean amplitude and variance in the time domain, plus baseband amplitude in the frequency domain. These are normalized and used as a compact feature vector. The novelty is that the features are intentionally chosen to be observable during normal communication, unlike prior OFP work that focused on features such as S21 or emission spectra that are less accessible online. On top of the features, they define an IEEE 802.15.7-compatible frame: a standard physical layer frame (preamble, SFD, PHR, PSDU) with a fingerprint data subframe embedded in the PSDU payload. That subframe includes a 1-byte signal type, 1-byte signal length, and 25-byte fingerprint data corresponding to a 200-bit binary sequence. The idea is that the fingerprint is carried in-band, not as a separate side channel.
Training regime: the paper’s learning stage is conventional supervised classification on extracted feature vectors. It explicitly mentions KNN, EnsembleKNN, and linear SVM; the best results reported are from linear SVM. However, the paper does not report epochs, because these are not neural models; it also does not give kernel hyperparameters, the K value for KNN, ensemble composition details for EnsembleKNN, optimizer settings, random seeds, or repeated-run variance. Since the classifier is classical ML, the training burden is presumably light, but the reproducibility of the exact configuration is limited by the missing hyperparameters. The workflow is: transmit an OFP frame, receive and preprocess the signal, extract the three features, normalize them, then fit the classifier on labeled device instances and use the model to identify the emitting LED during testing/authentication.
Evaluation protocol and concrete end-to-end example: the evaluation has two parts. First, on the laboratory dataset, Fig. 7 visualizes normalized features for 39 LEDs in a triangular coordinate system, where each triangle corresponds to one device and the vertices map to mean amplitude, variance, and baseband amplitude. Fig. 8 compares individual features against the combined feature vector across KNN, EnsembleKNN, and linear SVM; the combined vector is best, and linear SVM reaches 91.08% accuracy. Second, the authors simulate noisy and varying-distance conditions by adding Gaussian noise and sweeping SNR/distance. Fig. 9 reports accuracy versus SNR for the three classifiers, with the combined feature set maintaining >70% accuracy at 10 dB and >90.03% at 30 dB and above; Fig. 10 adds distance, showing the peak of 90.36% at 30 dB and modest distance sensitivity at high SNR. Fig. 11 shows BER over SNR/distance and claims compliance with IEEE 802.15.7, specifically BER below 10^-3 at SNR >= 10 dB. A concrete example of the pipeline is: a 200 kHz OOK signal is emitted by one LED, captured by the photodetector, aligned and normalized, converted into mean amplitude/variance/baseband amplitude, and then classified by a linear SVM to infer which of the 39 LEDs produced the waveform. The paper does not mention statistical significance testing, confidence intervals, or repeated-seed averaging.
Reproducibility: the paper gives enough hardware names, modulation choice, and feature definitions to partially replicate the setup, and it references prior physics-based LED/channel models. But it does not mention code release, public dataset release, fixed model weights, or exact preprocessing scripts. Because the data are likely collected in a bespoke lab environment and the paper omits split protocol and hyperparameters, full reproducibility is limited. The evaluation is therefore useful as a proof of concept, but not yet as a fully specified benchmark.
Technical innovations
- Introduces amplitude-based optical fingerprint features (mean amplitude, variance, baseband amplitude) designed for Li-Fi waveforms rather than RF-style fingerprints.
- Embeds fingerprint extraction into an IEEE 802.15.7-compatible physical-layer frame so authentication can occur in-band without breaking the standard frame structure.
- Uses a combined lab-measurement plus noise/distance simulation workflow to test fingerprint robustness under Li-Fi-relevant channel degradations.
- Shows that a simple linear SVM on the proposed feature vector can separate 39 commercial LEDs with over 90% accuracy in the reported setup.
Datasets
- 39 commercial white LEDs (Cree XTE, Cree XPE2, LUMILEDS REBEL-LXMA, LG3535) — 39 devices — collected in the authors’ lab setup
Baselines vs proposed
- Individual feature vectors (f_base, Mean Mean, Period Variance): test accuracy = lower than combined features vs proposed: 91.08% with SVM linear in Fig. 8
- KNN: under noisy conditions accuracy trails SVM linear, with combined features still >70% at 10 dB vs proposed: >70% at 10 dB and >90.03% at 30 dB in Fig. 9
- EnsembleKNN: under noisy conditions best at lower SNRs, but not better than SVM linear at higher SNRs vs proposed: 90.36% peak accuracy at 30 dB in Fig. 10
- BER compliance target (IEEE 802.15.7): BER < 10^-3 at SNR >= 10 dB vs proposed: meets the same threshold in Fig. 11
Figures from the paper
Figures are reproduced from the source paper for academic discussion. Original copyright: the paper authors. See arXiv:2504.12956.
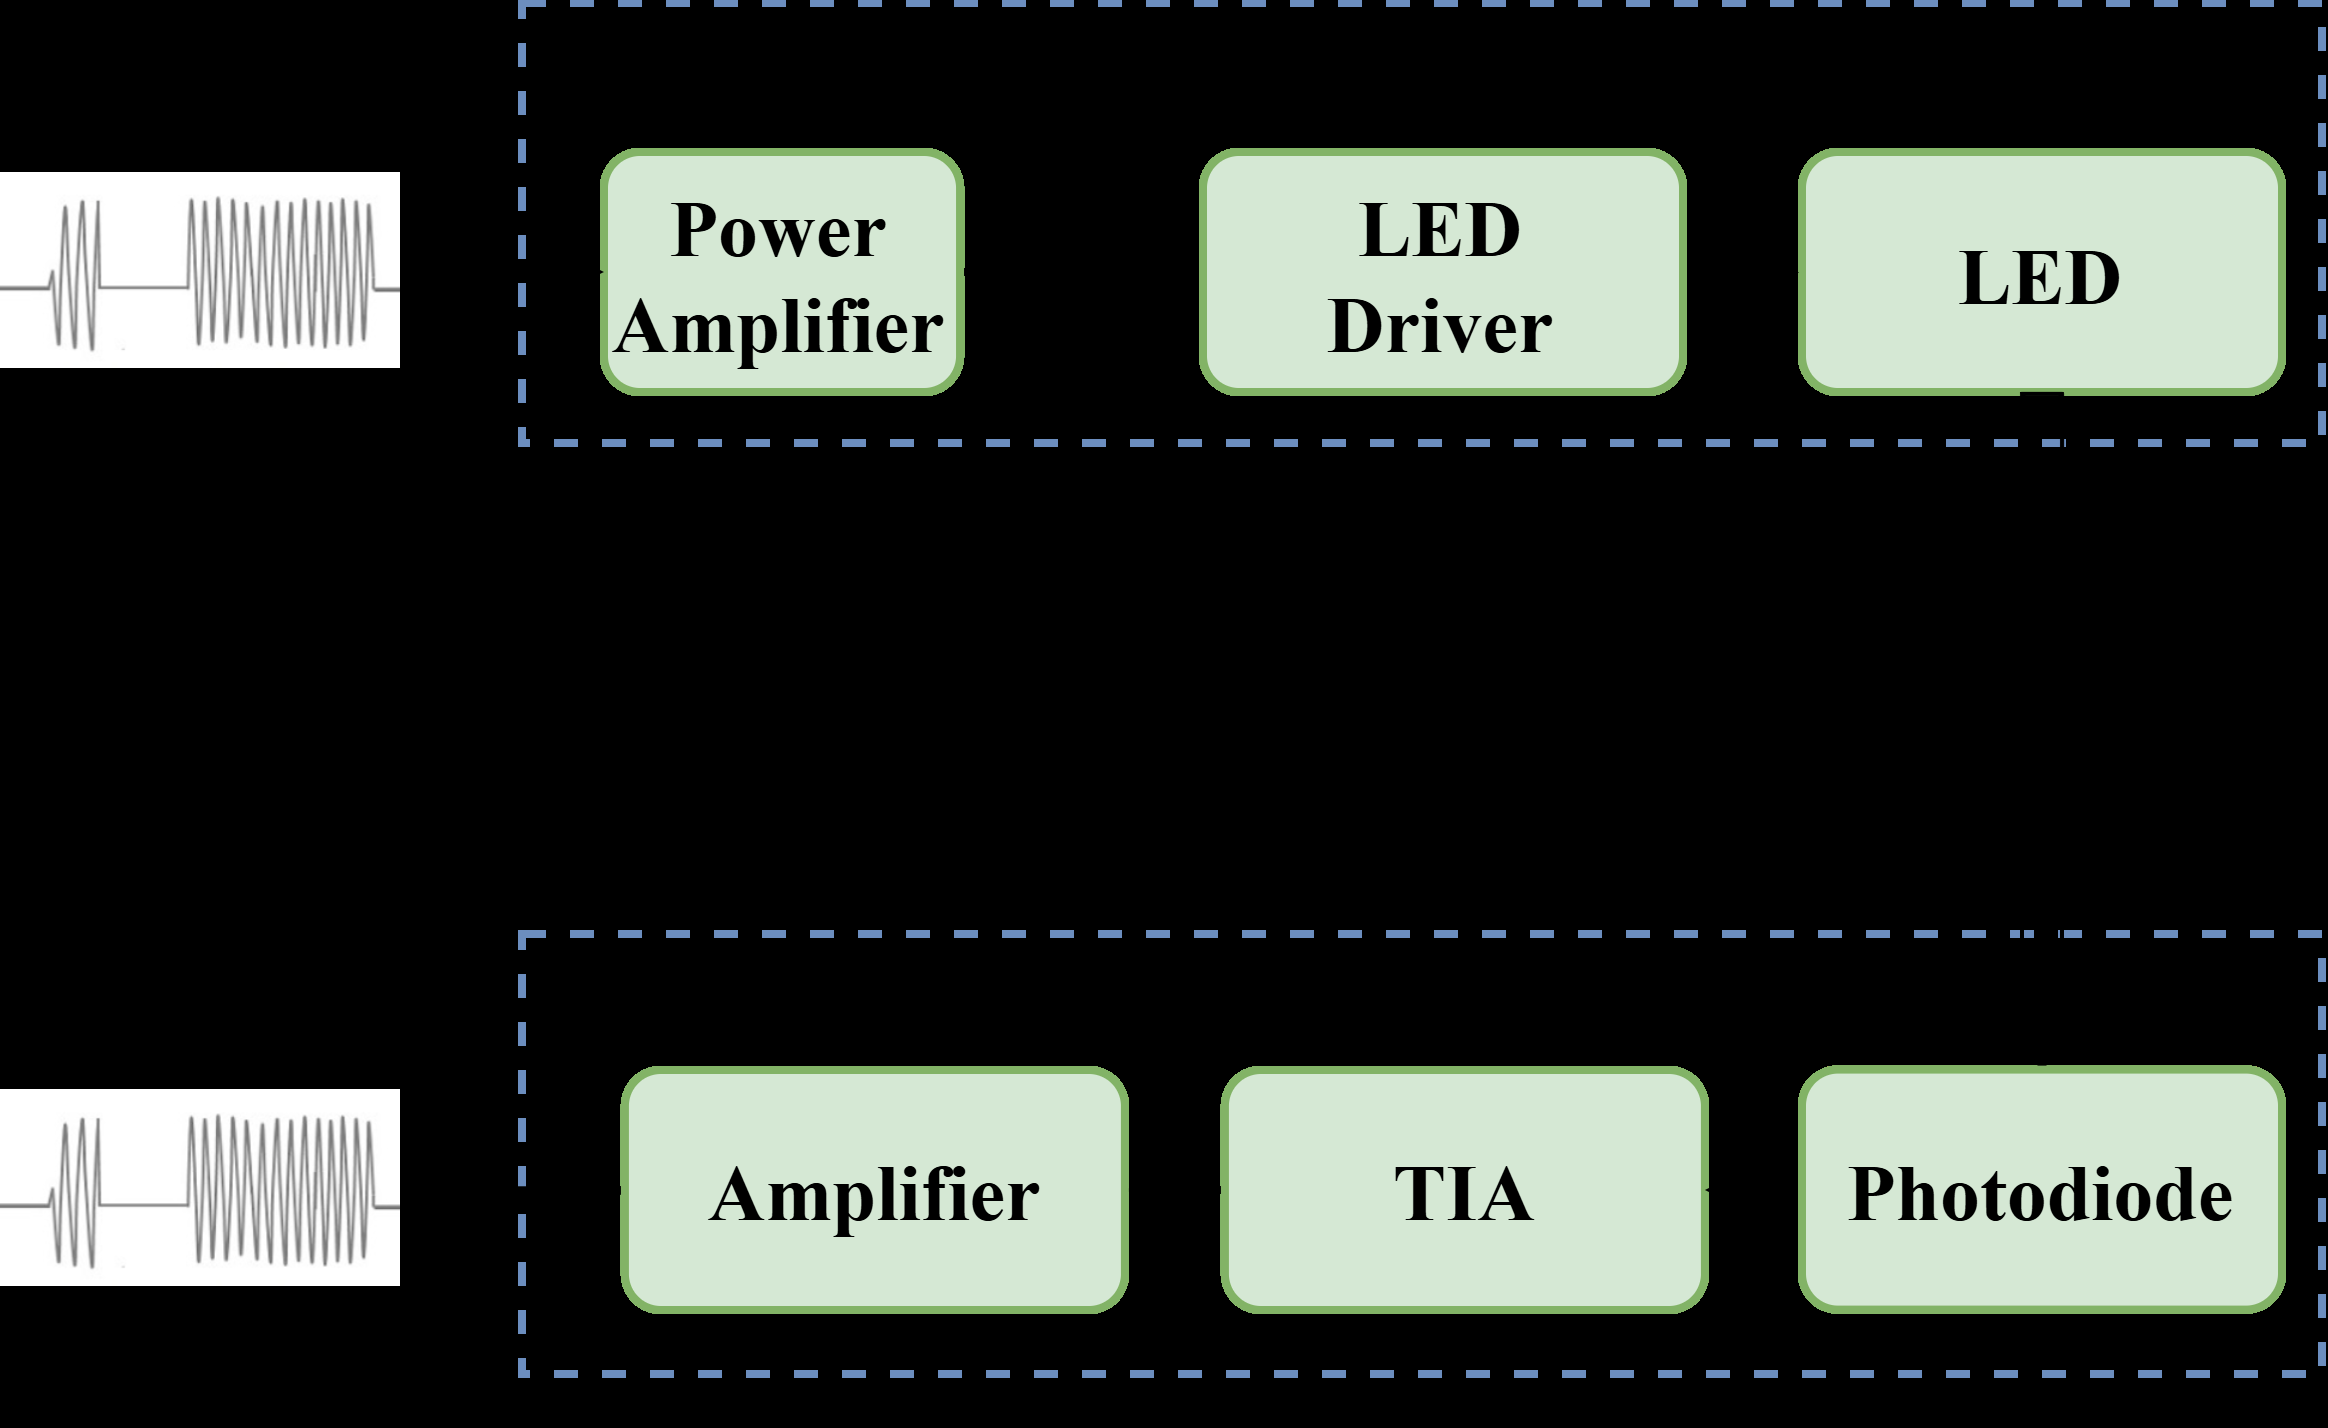
Fig 1: OWC downlink diagram.
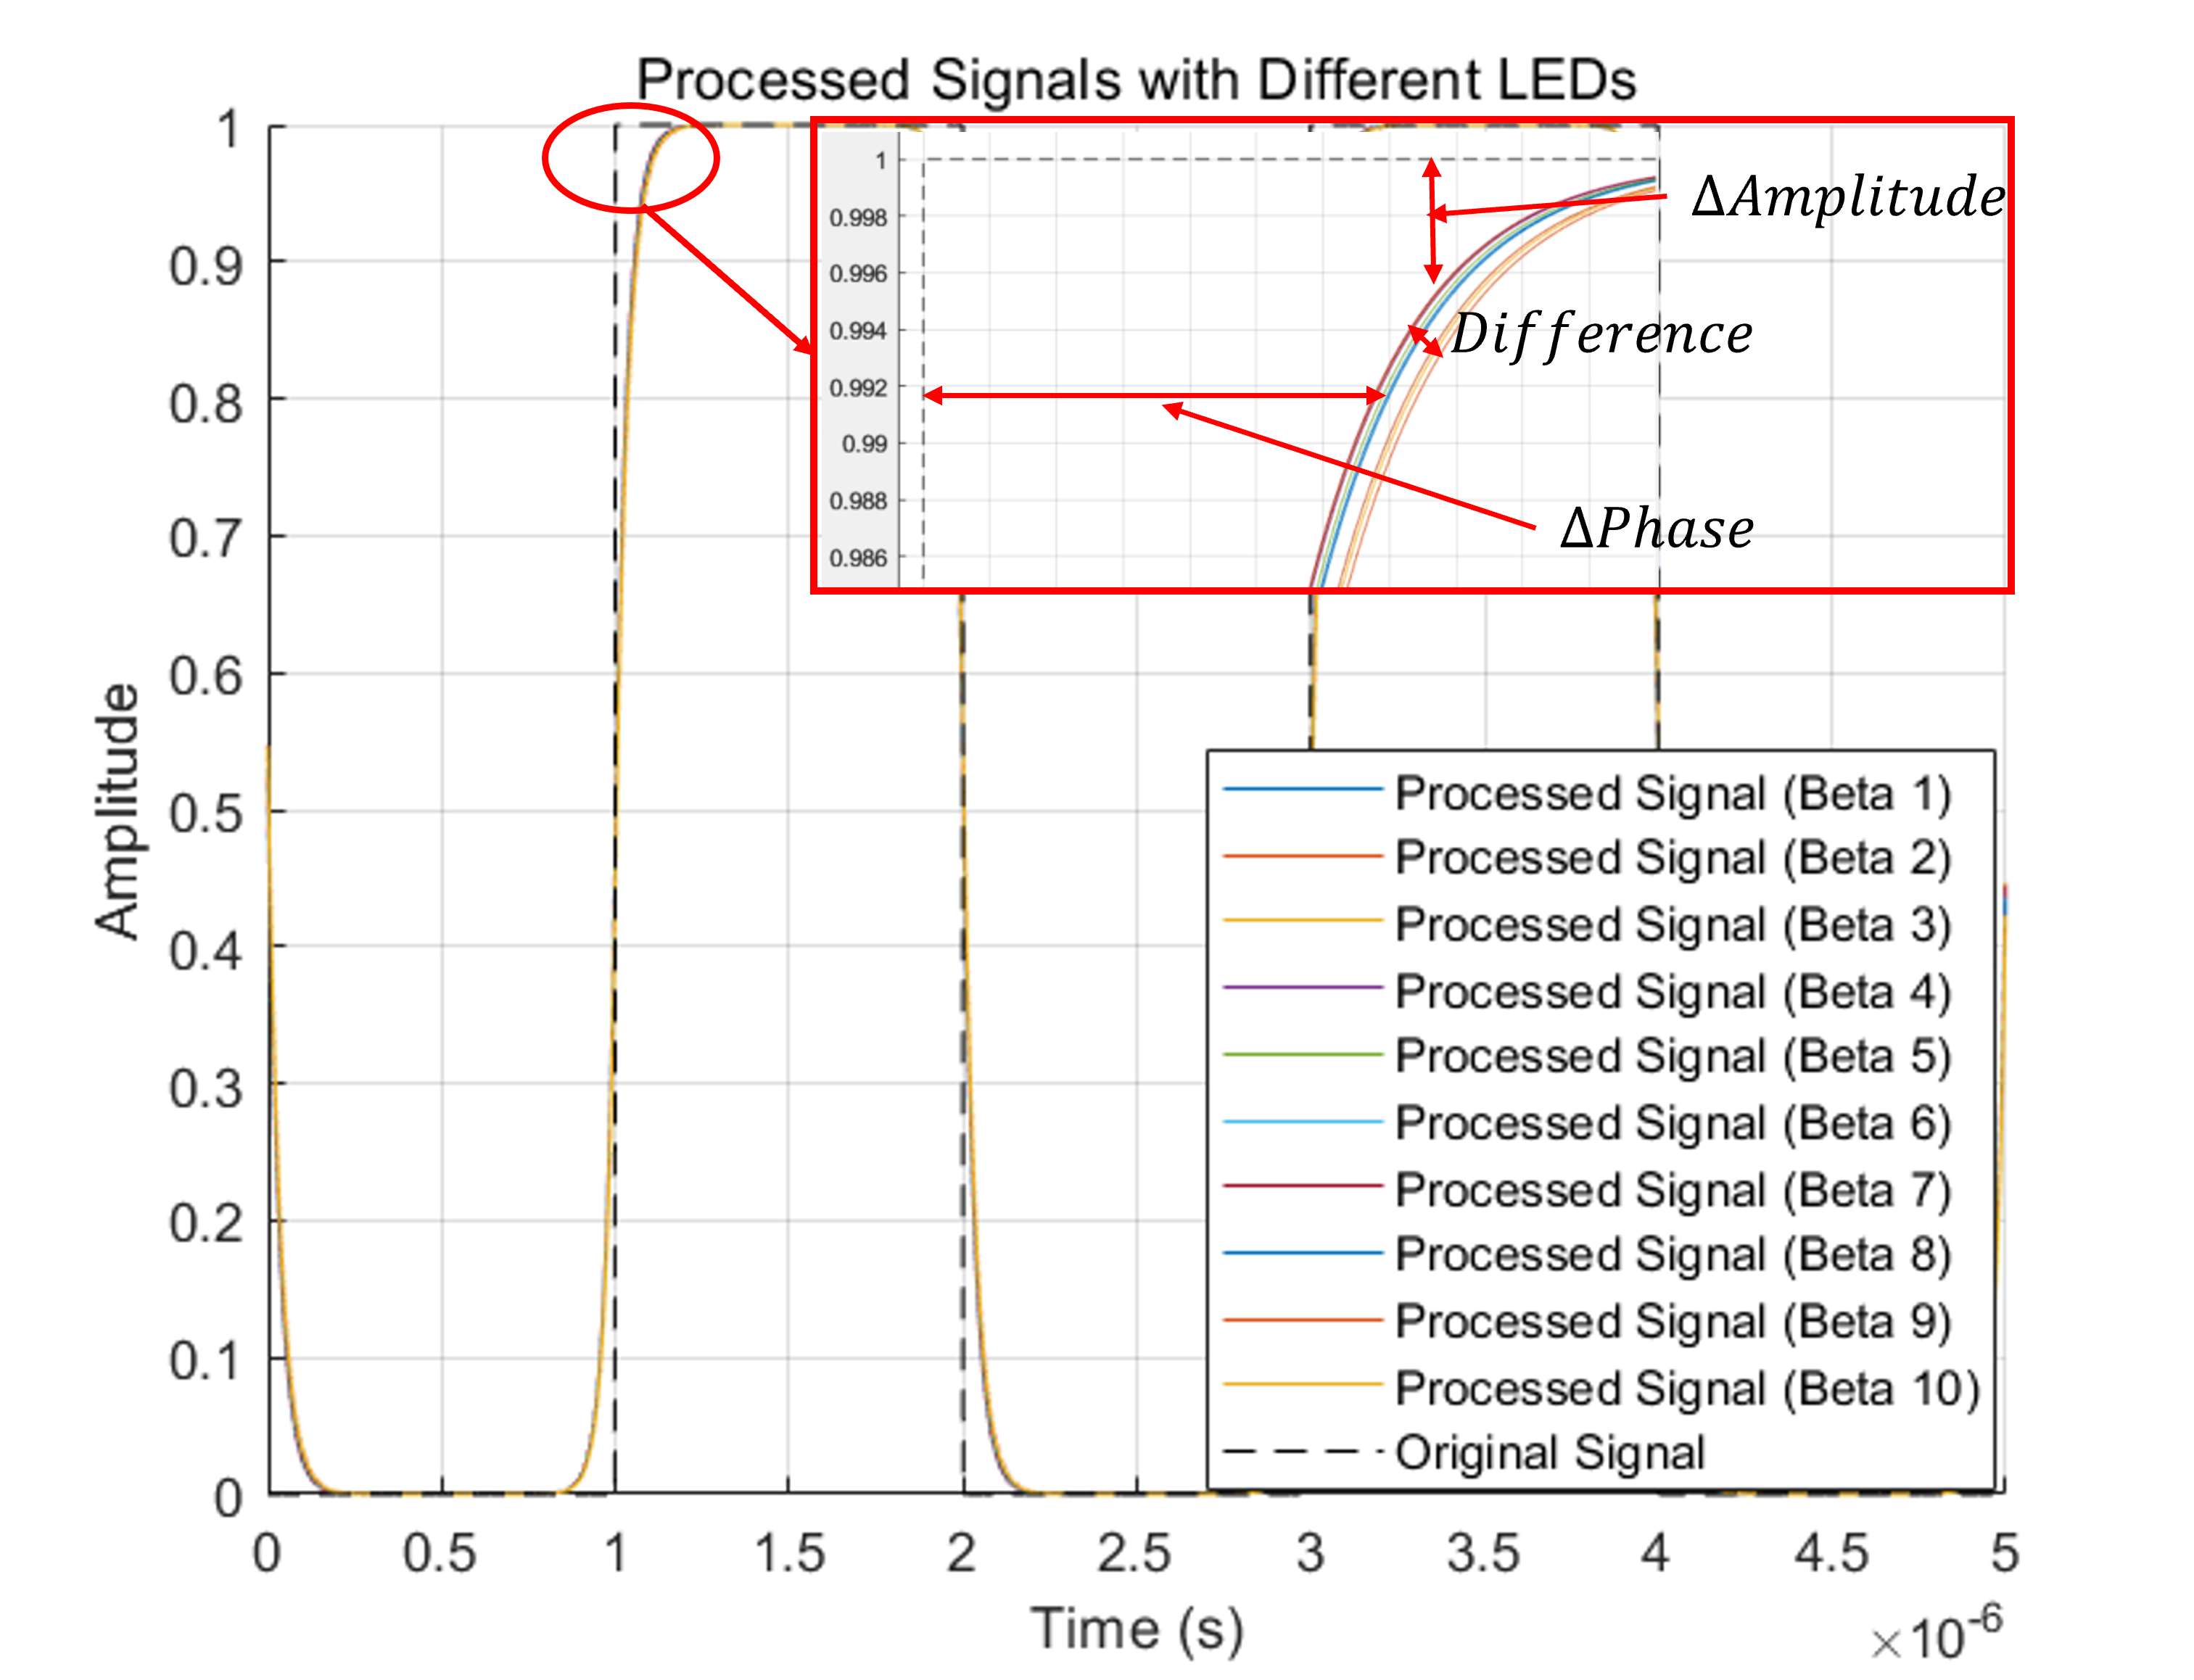
Fig 2: Comparison of Transmitted and Processed Signals:
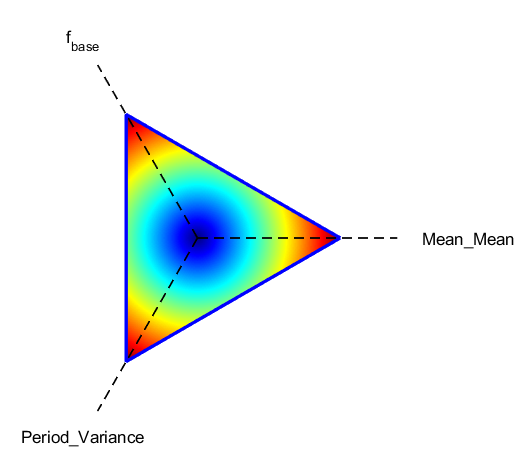
Fig 3: Overall feature distribution of normalized OFP features.
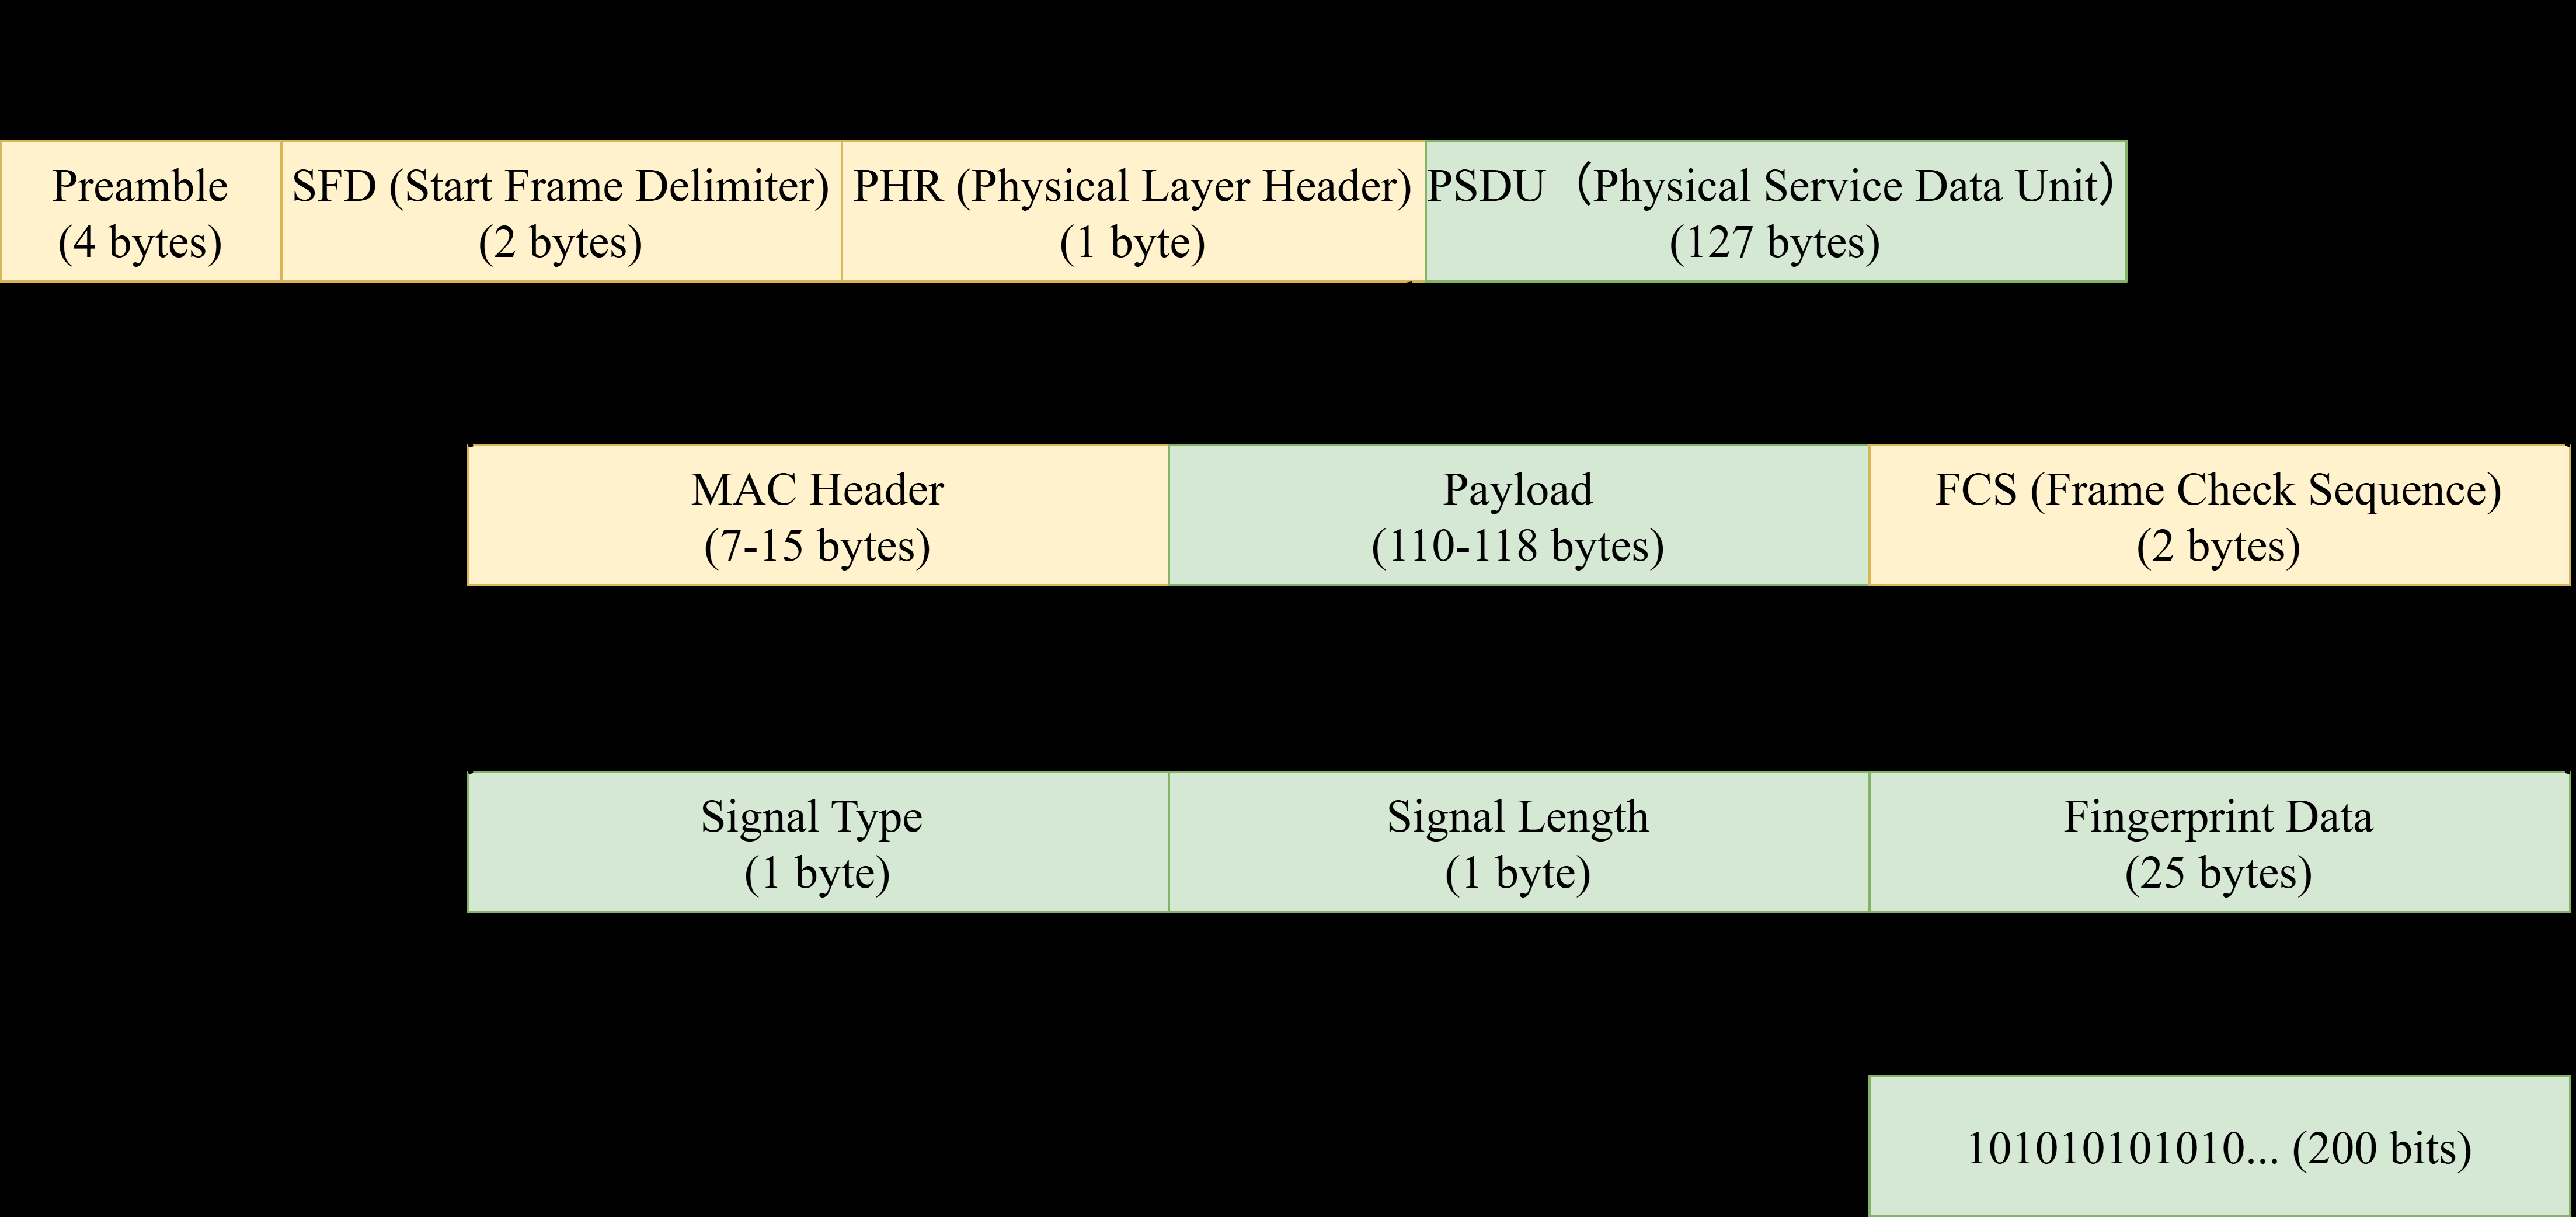
Fig 4: Enhanced Physical Layer Frame and OFP Data Frame
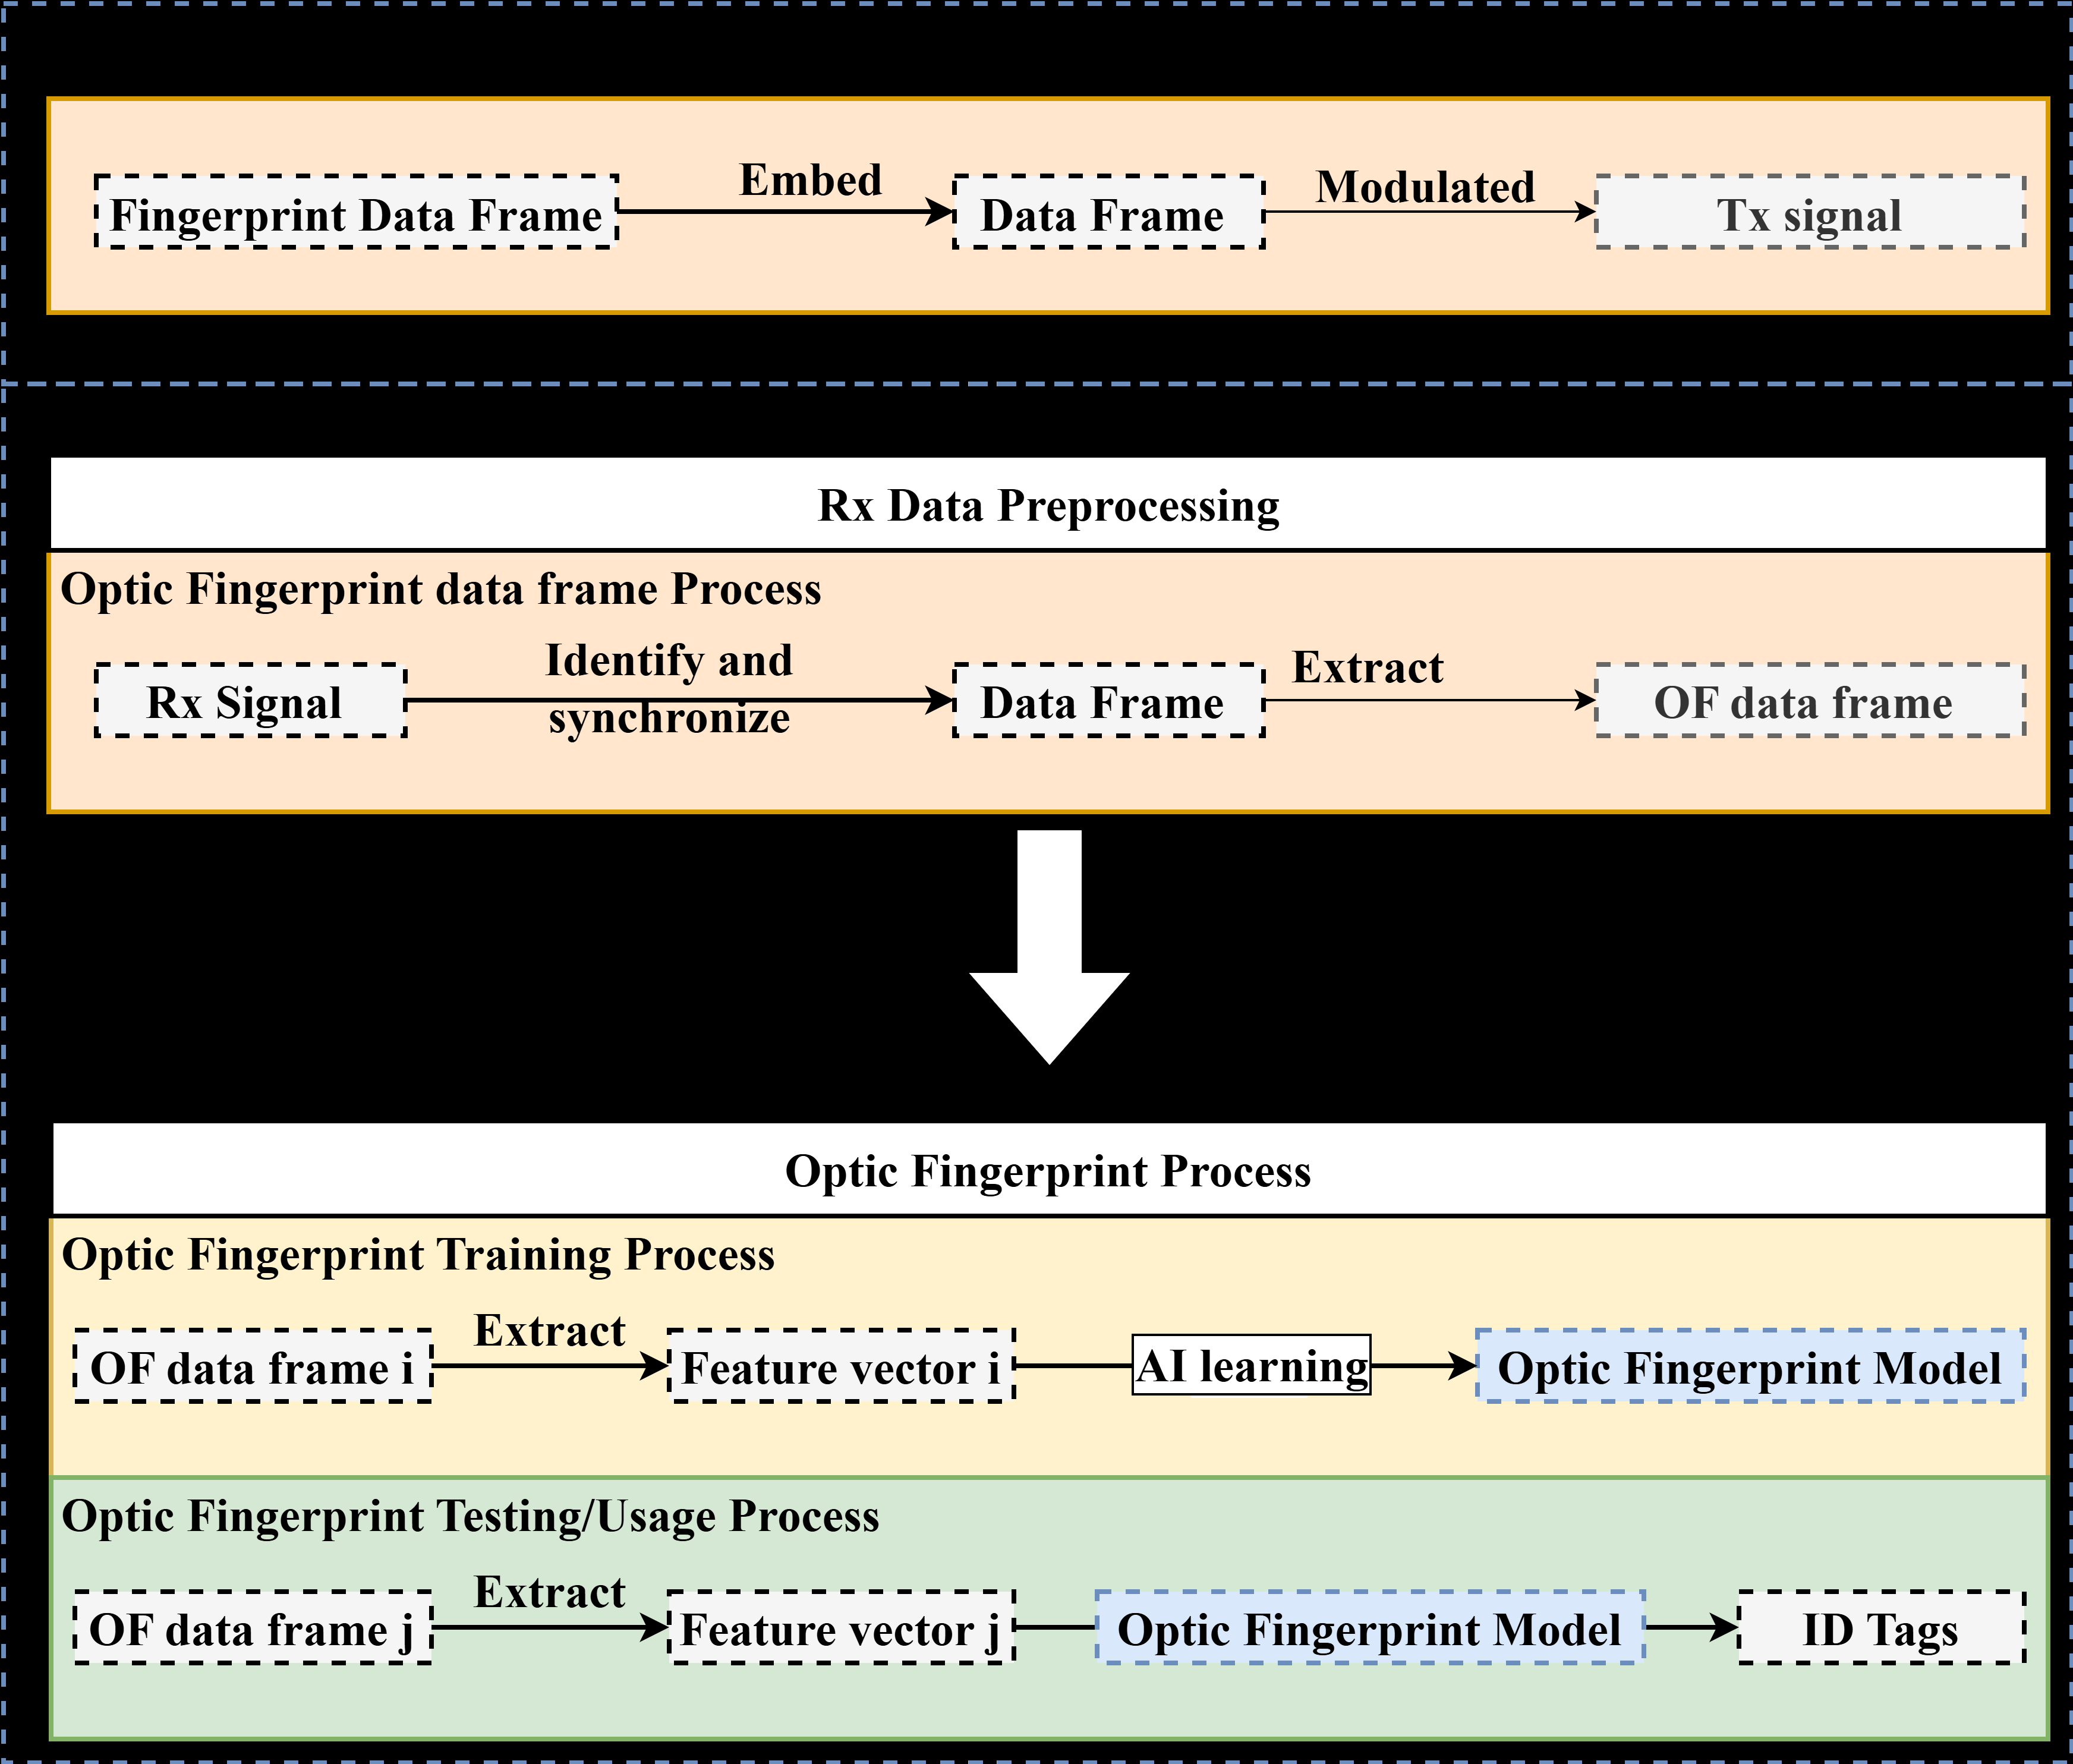
Fig 5: OFP Extraction Mechanism: Transmission and Recep-
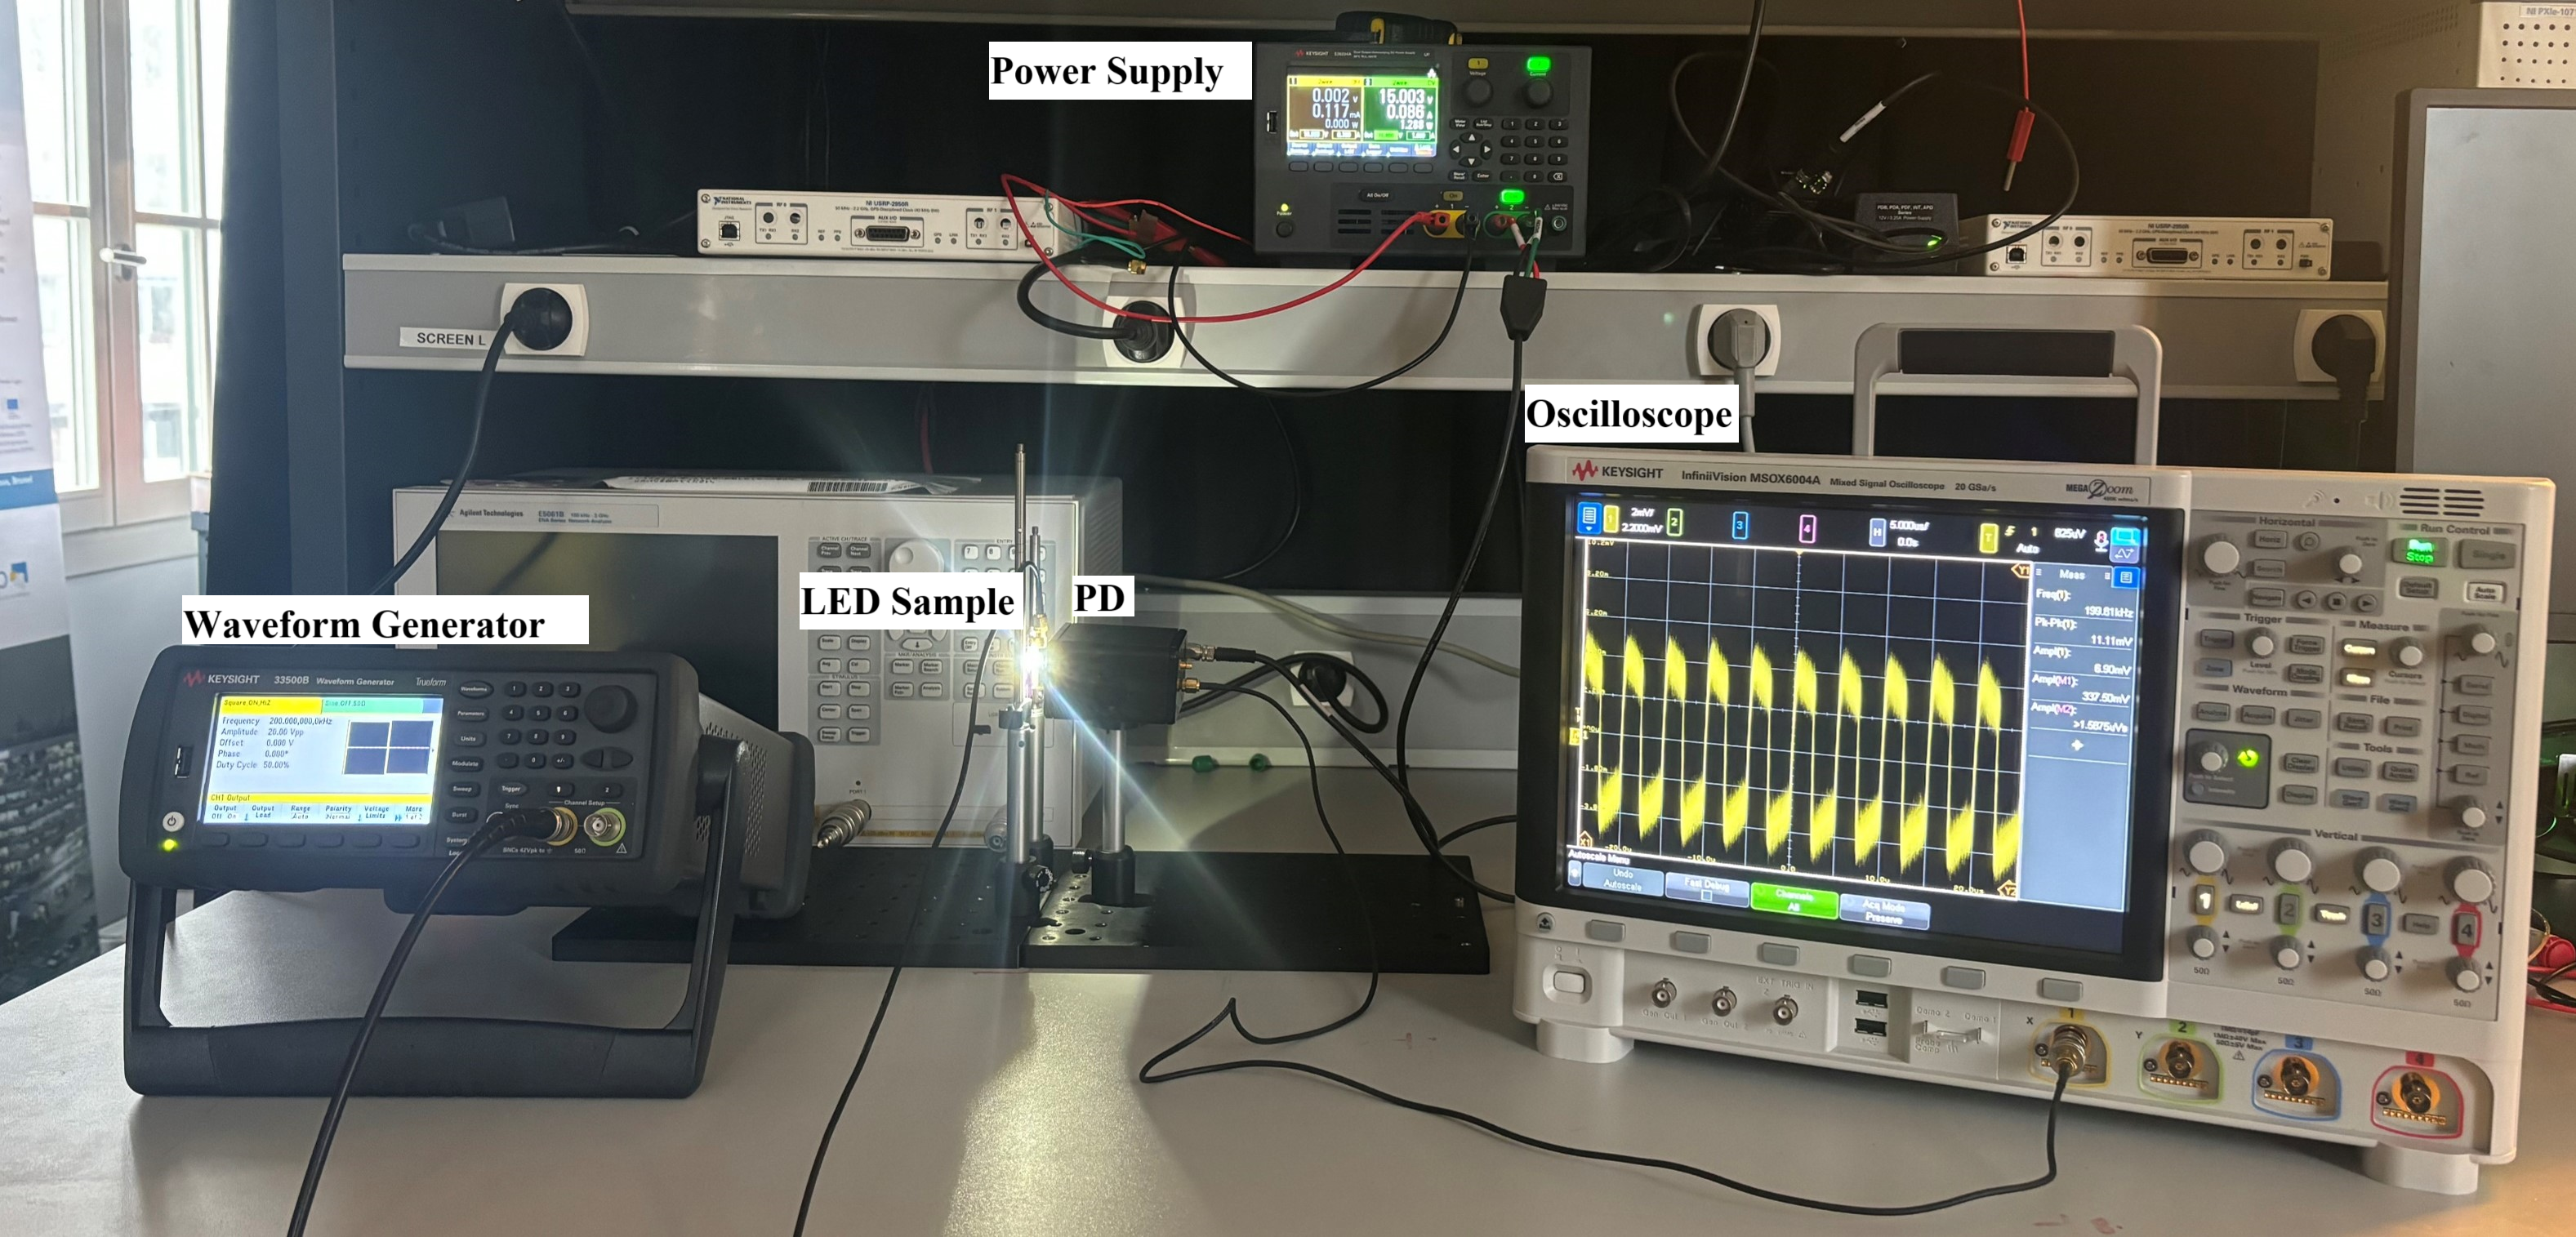
Fig 6: Experimental Testbed for OF Data Collection.
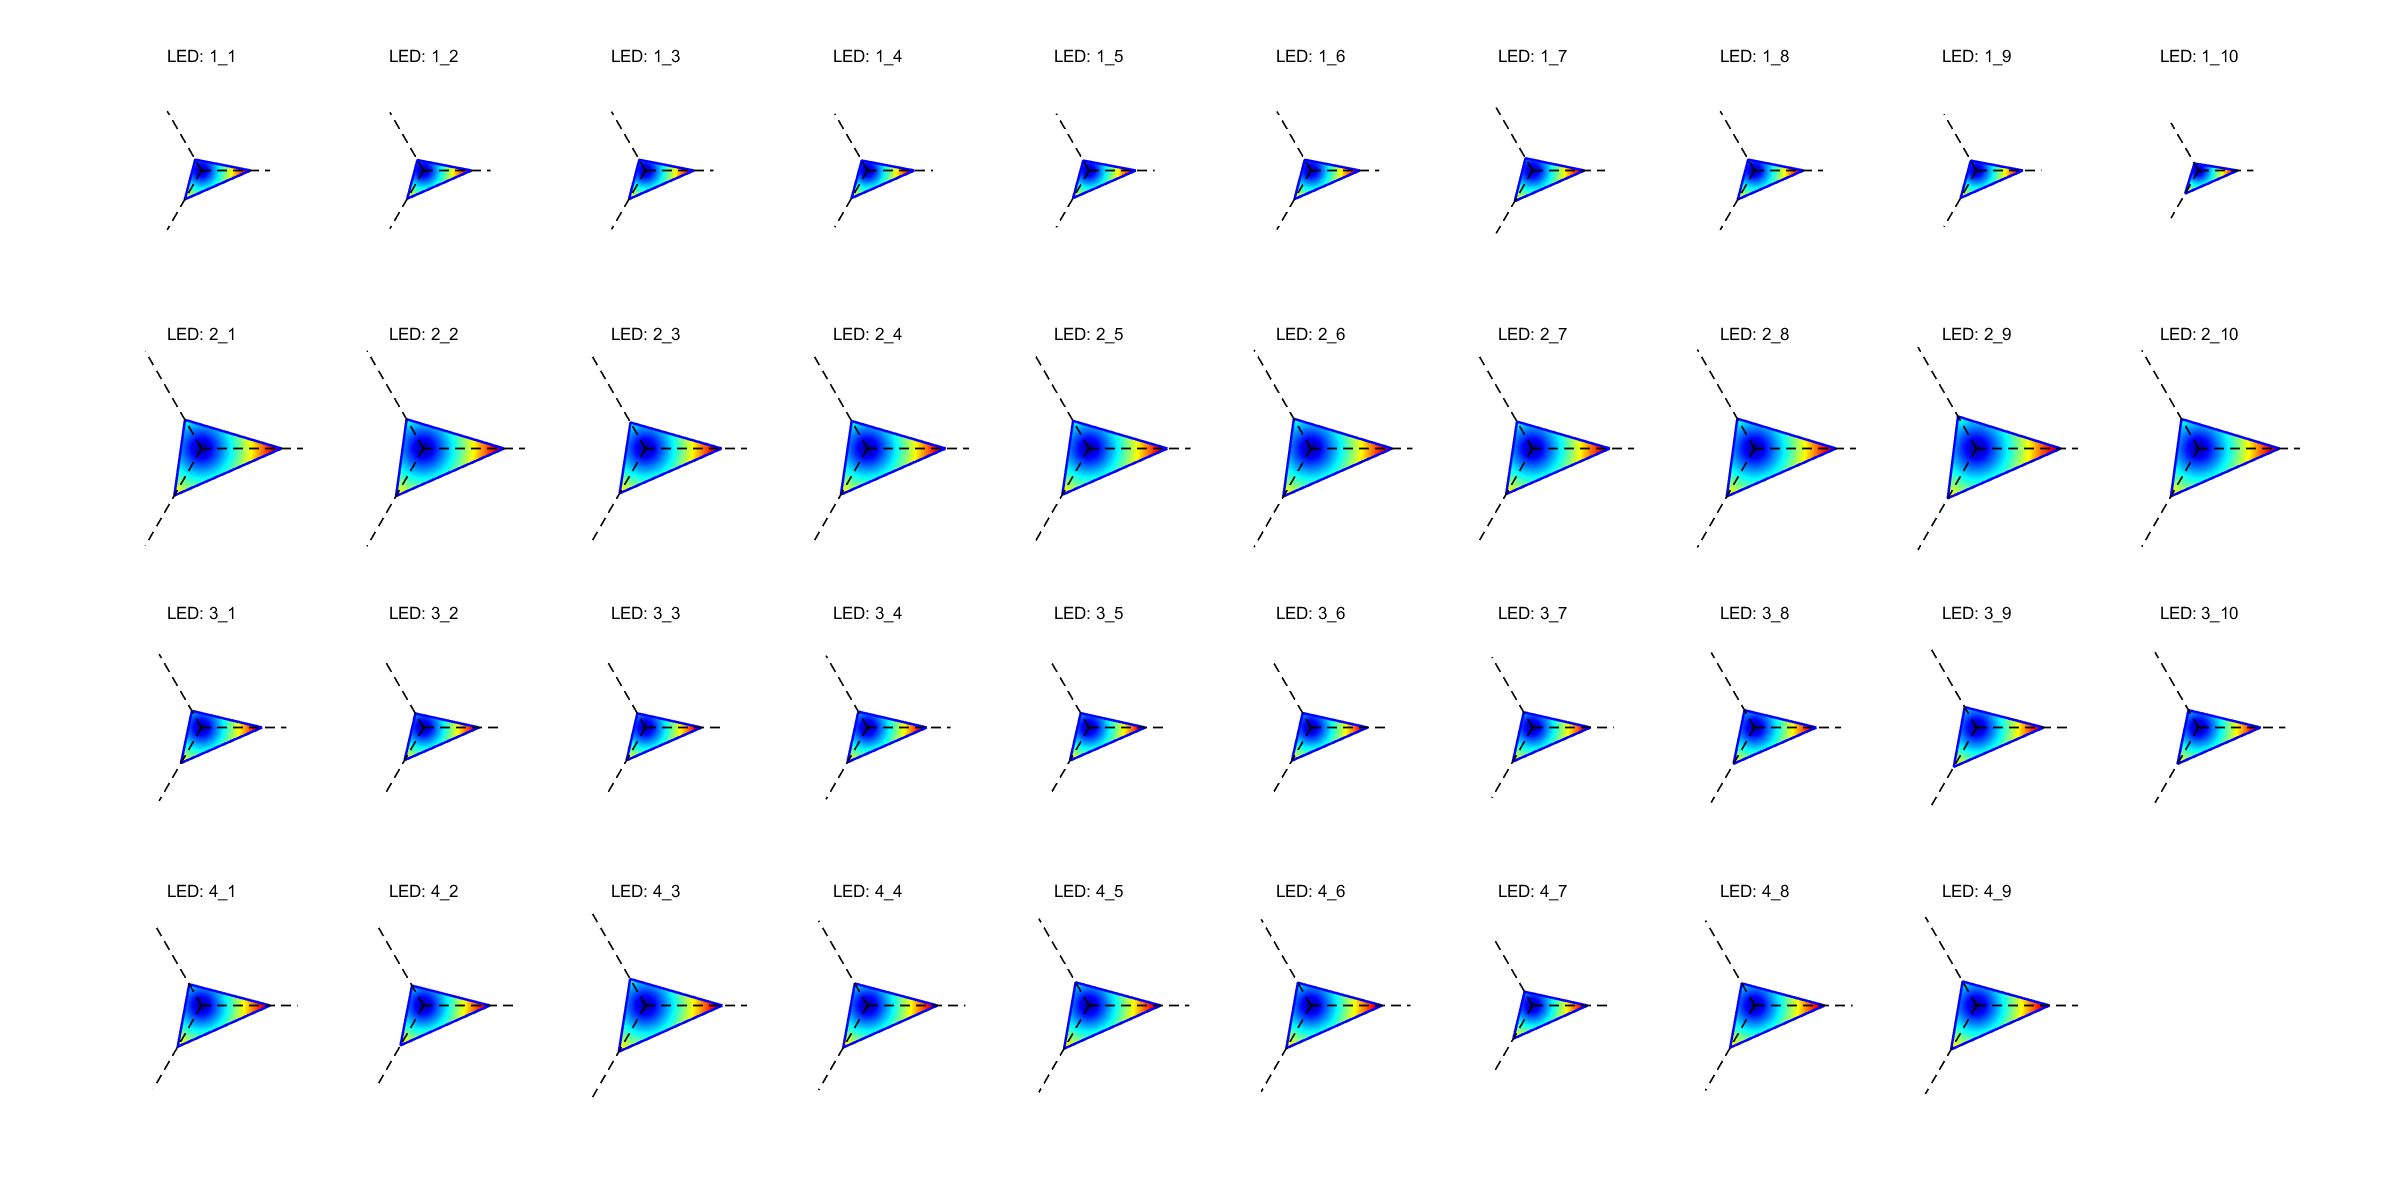
Fig 7: Normalized feature distributions of 39 LEDs in a triangular coordinate system. Each triangle represents a unique LED,
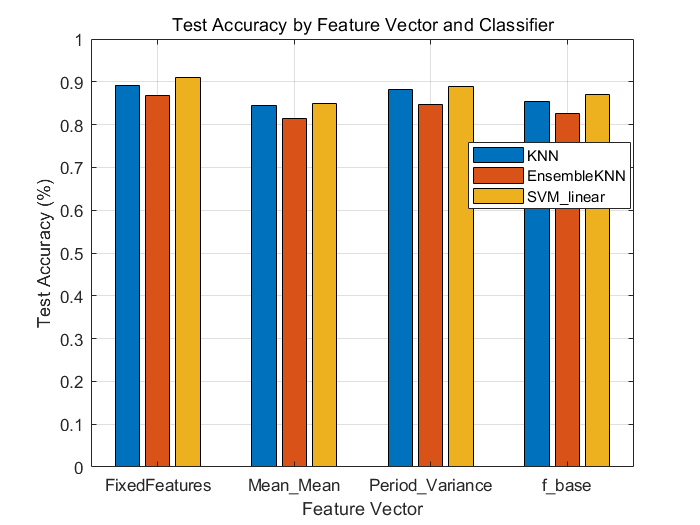
Fig 8: Classification accuracy using different feature vec-
Limitations
- The evaluation is mostly controlled-lab plus simulation; there is no outdoor, moving, multi-path, or user-facing deployment test.
- The paper does not specify train/test split, cross-validation, number of frames per LED, or seed control, which makes the reported accuracy hard to reproduce exactly.
- There is no explicit adaptive attacker evaluation, replay attack test, or spoofing attempt with a physically similar LED.
- The paper does not compare against contemporary LED fingerprinting baselines beyond prior conceptual work; the main comparisons are feature/classifier variants within the proposed pipeline.
- There is an internal inconsistency in the acquisition distance description (3 cm vs 30 cm), which makes the exact experimental conditions ambiguous.
- The reported best accuracy around 90% on 39 classes may be insufficient for high-assurance authentication without a reject option or secondary factor.
Open questions / follow-ons
- How stable are the OFP features across temperature changes, LED aging, driver replacement, and dimming settings?
- Can the approach resist active spoofing if an attacker uses the same LED model or a learned waveform generator?
- What happens in multi-user or longer-range Li-Fi scenarios where the channel is no longer approximately fixed?
- Would a calibrated reject/unknown class or open-set classifier improve practical authentication reliability?
Why it matters for bot defense
For bot-defense practitioners, this paper is best read as a physical-layer analog of device fingerprinting: it tries to identify a transmitter from subtle, hard-to-clone hardware variation rather than from higher-layer credentials. The practical lesson is that protocol-integrated fingerprints can reduce reliance on shared secrets and can be made lightweight enough for real-time checking, but only if the features remain stable under realistic operating conditions.
If you were designing anti-abuse or access control for an optical IoT deployment, this suggests a layered policy: use OFP as one signal among several, not as a sole trust anchor. The evaluation here is encouraging but not yet strong enough to justify high-stakes authentication by itself, especially because the paper does not test adaptive spoofing, environmental drift, or long-horizon stability. A bot-defense engineer would likely want open-set detection, drift monitoring, and fallback authentication before treating such fingerprints as production-grade identity signals.
Cite
@article{arxiv2504_12956,
  title={ Optic Fingerprint(OFP): Enhancing Security in Li-Fi Networks },
  author={ Ziqi Liu and Xuanbang Chen and Xun Zhang },
  journal={arXiv preprint arXiv:2504.12956},
  year={ 2025 },
  url={https://arxiv.org/abs/2504.12956}
}